Transcription
Coastal Engineering 158 (2020) 103674Contents lists available at ScienceDirectCoastal Engineeringjournal homepage: ven erosion and inundation of barrier islands from dune-toregion-scalesAlireza Gharagozlou a, *, Joel Casey Dietrich a, Ayse Karanci a, Richard A. Luettich b,Margery F. Overton aabDept. of Civil, Construction, and Environmental Engineering, NC State University, Campus Box 7908, 2501 Stinson Drive, 428 Mann Hall, Raleigh, NC, 27695, USAInstitute of Marine Sciences, University of North Carolina, 150 Coker Hall, 3431 Arendell St, Morehead City, NC, 28557, USAA R T I C L E I N F OA B S T R A C TKeywords:XBeachHurricane IsabelOuter banksCoastal morphodynamicsADCIRCþSWANBarrier islands are susceptible to erosion, overwash, and breaching during intense storms. However, theseprocesses are not represented typically in large-domain models for storm surge and coastal inundation. In thisstudy, we explore the requirements for bridging the gap between dune-scale morphodynamic and region-scaleflooding models. A high-resolution XBeach model is developed to represent the morphodynamics during Hur ricane Isabel (2003) in the North Carolina (NC) Outer Banks. The model domain is extended to more than 30 kmof Hatteras Island and is thus larger than in previous studies. The predicted dune erosion is in good agreementwith post-storm observed topography, and an ‘‘excellent’’ Skill Score of 0.59 is obtained on this large domain.Sensitivity studies show the morphodynamic model accuracy is decreased as the mesh spacing is coarsened in thecross-shore direction, but the results are less sensitive to the alongshore resolution. A new metric to assess modelskill, Water Overpassing Area (WOA), is introduced to account for the available flow pathway over the dunecrest. Together, these findings allow for upscaled parameterizations of erosion in larger-domain models. Theupdated topography, obtained from XBeach prediction, is applied in a region-scale flooding model, thus allowingfor enhanced flooding predictions in communities along the Outer Banks. It is found that, even using a fixedtopography in region-scale model, the flooding predictions are improved significantly when post-storm topog raphy from XBeach is implemented. These findings can be generalized to similar barrier island systems, whichare common along the U.S. Gulf and Atlantic coasts.1. IntroductionBarrier islands are common coastal features and storm defenses.They line 10% of the world’s open coasts, with 24% of the total withinthe U.S., including most of the Gulf and Atlantic coasts (Stutz and Pilkey,2011). The coastline of North Carolina (NC) is characterized by barrierislands called the Outer Banks, which stretch 320 km, and containdunes with typical crest elevations of 3 to over 10:5 m (Sciaudoneet al., 2016). They are highly vulnerable to erosion and flooding duringtropical cyclones and winter storms (Doran et al., 2012), which occurfrequently in NC (State Climate Office of N, 2017).Storm-driven surge and flooding have been studied in coastal NC,often via computational modeling on region-scales to include the barrierislands, lagoonal estuaries, and inner floodplains (Weaver and Luettich,2009; Sheng et al., 2010). For idealized storms in this system, themagnitude and extent of coastal inundation are sensitive to the storm’sforward speed, size, and track angle relative to the coast (Peng et al.,2004, 2006). For perturbations of forecast storm tracks and intensities,accuracy can deteriorate significantly if the storm’s track over the NCsounds and barrier islands is not predicted correctly (Cyriac et al., 2014).For perturbations of storm forward speed and timing, the storm surgecan interact nonlinearly with the tides, thus increasing and decreasingthe total water levels in regions along the coastline (Thomas et al.,Luettich). All of these storm effects can be represented in ahigh-resolution modeling system, which was automated to provideforecast guidance about coastal circulation and flooding (Mattocks andForbes, 2008; Blanton et al., 2012) and has been expanded for stormsalong the entire U.S. Gulf and Atlantic coast (e.g. https://cera.coastalrisk.live). However, while these studies considered the storm-drivenwaves and flooding near the barrier islands, they did not consider theerosion of beaches and dunes due to overwash and inundation.Erosion and breaching of barrier islands during storms have an* Corresponding author.E-mail address: agharag@ncsu.edu (A. 2020.103674Received 3 June 2019; Received in revised form 27 December 2019; Accepted 25 February 2020Available online 4 March 20200378-3839/ 2020 Elsevier B.V. All rights reserved.
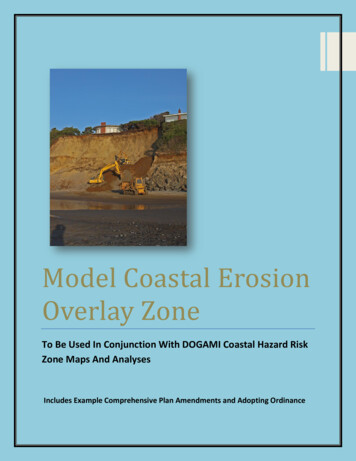
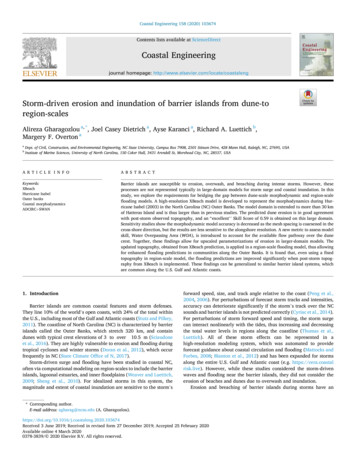
A. Gharagozlou et al.Coastal Engineering 158 (2020) 103674Fig. 1. Hurricane Isabel (2003) track (colors show the storm intensity), with successive insets to show coastal NC and Hatteras Island. The extents of available preand post-storm LiDAR surveys (red line), and the locations of wave buoys (black squares) and water level stations (white triangles) are also shown. (For interpretationof the references to color in this figure legend, the reader is referred to the Web version of this article.)important role on nearshore hydrodynamics, and recent studies haveexplored these processes by using field and remotely-sensed data andnumerical models. The Outer Banks vulnerabilities to inlet breachinghave been identified at several locations (Overton and Fisher, 2004;Mallinson et al., 2010). The opening and eventual closure of the breachat Pea Island due to Hurricane Irene has been characterized extensivelywith aerial photography and other remote sensing data (Clinch et al.,2012; Hardin, 2013; Overton and Smyre, 2013; Velasquez-Montoyaet al., 2018; Safak et al., 2016). Beach and dune erosion were modeled atcross-shore transects in the northern Outer Banks (Fauver, 2005; Gen carelli et al., 2009), but the sediment transport was found to be domi nant in the alongshore direction. These predictions were improved withnewer models to include land cover effects on the dune erosion (Karanciet al., 2014).We emphasize the difference in scales between models for coastalflooding and erosion. Storm-driven waves and surge are modeled typi cally on region-scale domains to represent their interactions with thecomplex coastal landscape. Recent studies for coastal NC have appliedmodels on unstructured meshes, which allow for computational reso lution to vary from kilometers in open water, to hundreds of meters nearthe coastline and through the floodplains, and to tens of meters in thesmall-scale natural and man-made channels that convey surge intoinland regions (Blanton and Luettich, 2008; Cyriac et al., 2014). Circu lation and flooding are predicted at the Outer Banks with a minimumresolution of 50 to 200 m, thus limiting the representation ofcross-shore beach profiles and alongshore dune crest variations. Thisresolution is typical of similar studies at global scale (Muis et al., 2016)or region scales (e.g. in U.S. (Kennedy et al., Dean; Dietrich et al.,Luettich; Bilskie et al., 2016), Australia (Haigh et al., 2014), and Europe(Fernandez-Montblanc et al., 2019)).In contrast, erosion of beaches, dunes, and inlets is modeled typicallyon smaller-scale domains. When breaches at Pea Island were predictedwith a morphodynamic model, less than 1 km of coastline wasconsidered with a minimum resolution of 1 to 2 m (Kurum andOverton, 2013). This resolution is typical of similar studies in other re gions, e.g. Texas (Harter and Figlus, 2017), Louisiana (Lindemer et al.,2010), and Florida (McCall et al., 2010; Passeri et al., 2018), althoughthe domains have grown to now include 10 to 20 km of islandcoastline. While these models can predict accurately the erosion atspecific locations, their smaller-scale domains can limit their in teractions with waves and flooding throughout the region.These interactions may be significant. Erosion of beaches, dunes, andinlets will allow changes to circulation on the open coast and behind theisland. It has been suggested that Isabel Inlet contributed much more tothe local currents than the water levels (Kurum et al., 2010), but thatnumerical study did not include waves, dune overwash, or morphody namics. For the Chandeleur Islands in Louisiana, their removal couldincrease surge by 0:5 m near New Orleans (Wamsley et al., 2009) andwave heights by nearly 500 percent (Grzegorzewski et al., 2009), whilerestored islands could delay the peak surge by 1 to 2 hr (Grze gorzewski et al., 2009). This erosion may have affected significantly theflooding in the region. However, in these studies, the updated groundsurface elevations were taken from remote-sensing data, and not frommodel predictions, and thus they could not consider the evolution of2
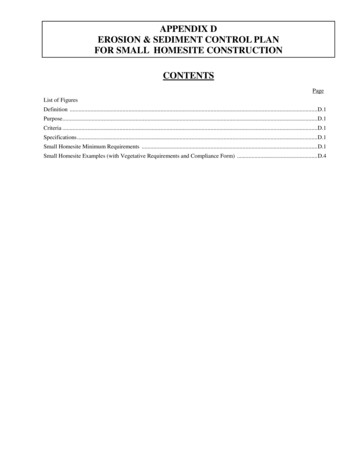
A. Gharagozlou et al.Coastal Engineering 158 (2020) 103674Fig. 2. Comparison of meshes for ADCIRC þ SWAN and XBeach. The region-scale ADCIRC þ SWAN mesh is shown with contoured bathymetry/topography (right)and as black triangular elements in the first inset (center). The 30 km (red box) and 4 km (green box) extents of the XBeach mesh are shown in the first inset(center), with a maximum resolution shown in the second inset (left). (For interpretation of the references to color in this figure legend, the reader is referred to theWeb version of this article.)these interactions during the storms.This study will explore these interactions via hindcast of Isabel’seffects on Hatteras Island, specifically the dune erosion along a 30 kmportion between the communities of Rodanthe and Avon. Our hypoth eses are that: (a) in regions with relatively-uniform topography, aprocess-based morphodynamic model can be coarsened and expanded toa relatively-large domain, without sacrificing accuracy; and (b) thetopographic elevation changes can be further upscaled and passed toregion-scale models to allow overwash and inundation behind thedunes. This study will require a loose coupling of process-basedmodeling systems: the ADvanced CIRCulation (ADCIRC (Luettichet al., 1992; Westerink et al., 2008),) and Simulating WAves Nearshore(SWAN (Booij et al., 1999; Zijlema, 2010),) models, known as ADCIRCþ SWAN, which have gained prominence for simulations ofstorm-driven waves and surge; and the eXtreme Beach (XBeach (Roel vink et al., 2009),) model, which was developed explicitly for beacherosion during storms. Sensitivity tests will explore the relationshipbetween accuracy and structured-mesh resolution in XBeach. Dune crestelevations will be passed to the unstructured mesh used by ADCIRC þSWAN, to allow for inundation of the communities on Hatteras Islandand the results will be compared to XBeach prediction and the obser vations. This study is a necessary step toward the tight coupling ofstorm-driven erosion and flooding on region scales.on 1 September (Beven and Cobb, 2003), strengthened into a tropicalstorm by 6 September, into a hurricane by 15:00 UTC 7 September, andbecame a Category-5 hurricane on the Saffir-Simpson scale by 18:00UTC 11 September with maximum sustained winds estimated at74 m s. During the next week, the storm moved northwestward andweakened, becoming a Category-2 hurricane on 16 September withmaximum wind speeds of 45 m s (Fig. 1). On 17:00 UTC 18 September,Isabel made landfall near Drum Inlet in the NC Outer Banks as aCategory-2 hurricane. The storm continued to weaken as it moved acrosseastern NC and became a tropical storm over southern Virginia. A daylater, the storm weakened to extra-tropical and was eventually absorbedby a larger baroclinic system at 06:00 UTC 20 September (Beven andCobb, 2003).Isabel produced significant wave heights of about 8:1 m at theUSACE Field Research Facility in Duck, NC. This observation exceededthe previous 27-year record by 1:8 m (Geological Survey and h, 2018).Peak storm surge of 1:5 m occurred in phase with the time of high tide,which resulted in almost equal surge level along the northern OuterBanks and near the landfall location (Wamsley and Hathaway, 2004).The National Oceanic and Atmospheric Administration (NOAA) waterlevel gauge at the ocean-side of Cape Hatteras, recorded a water level of2:05 m before failing during the storm (Hovis et al., 2004). A maximumwater level of 1:45 m was recorded at the NOAA station at Oregon Inlet,NC, at 04:00 UTC 19 September, and 1:72 m at Duck station at 18:00UTC 18 September. These waves and surge caused damages to infra structure and permanent changes to the landscape.2. Hurricane Isabel (2003)2.1. Synoptic history2.2. Observed erosion on Hatteras IslandIsabel was the most powerful storm during the 2003 Atlantic hurri cane season, and its winds, waves, and storm surge impacted the NCOuter Banks. Isabel formed as a tropical wave off the West African coastIsabel caused erosion at several spots along the Outer Banks. Thelargest individual erosion event occurred near the western end of3
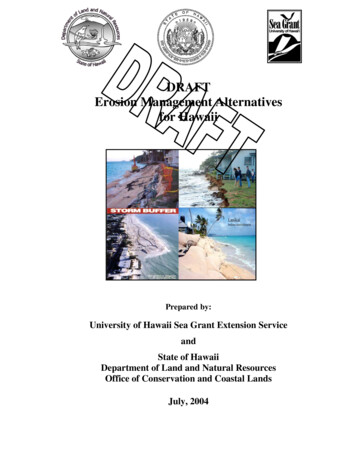
A. Gharagozlou et al.Coastal Engineering 158 (2020) 103674Fig. 3. Observed and predicted dune crest profiles along the 30 km study area, for alongshore distances starting from north of Avon and ranging from south tonorth. The largest dune elevation change of about 4 m occurs near town of Salvo (at an alongshore distance of about 10 km), and the lowest dunes and extensiveoverwash were located near Rodanthe (at an alongshore distance of about 25 km). The red boxes correspond to the location of the three regions specified in Fig. 7.(For interpretation of the references to color in this figure legend, the reader is referred to the Web version of this article.)Hatteras Island, about 60 km east of Isabel’s landfall location, wherethe island was breached due to extensive erosion, overwash, andflooding. The village of Hatteras was inaccessible due to the520 m-wide inlet that connected the ocean and the sound. At this sec tion, the island was narrowest with a width of about 150 m and thedune crest elevation was lower than other points along the island(Wamsley and Hathaway, 2004). Elsewhere on the island, dunes werewashed away at many locations, leaving sand deposits behind the dune,on the road, and against homes and other infrastructure. Dune erosionevents occurred between the towns of Avon and Salvo. The town ofRodanthe was also impacted by a very large amount of erosion andoverwash, causing damage to the buildings and road closure.We select Isabel as a test case because of the extensive observationsof morphodynamic changes to the topography of Hatteras Island. Thesechanges are described in pre- and post-storm Light Detection andRanging (LiDAR) surveys. Experimental Advanced Airborne ResearchLiDAR (EAARL) (Bonisteel et al., 2009) surveys were conducted on 16September (two days before landfall) and 21 September (three days afterlandfall), and cover a width of 200 to 400 m of the beach topographyfor a 350 km stretch of the Outer Banks (Sallenger et al., 2004). Thevertical and horizontal accuracy of these data are within 0:3 m and1 m, respectively (Geological Survey and h, 2019). Thesehigh-resolution LiDAR surveys are especially valuable for understandingof the morphodynamic changes on the barrier island during the storm.This barrier island is characterized by two parallel dunes, which arenot completely continuous, and which merge into one dune in a fewlocations. The study area includes 30 km of Hatteras Island between thetowns of Rodanthe and Avon (Fig. 2). The peak, pre-storm, dune crestelevation is about 10 m relative to the North American Vertical Datumof 1988 (NAVD88), and the average dune crest elevation change due tothe storm was about 1 m (Fig. 3). Aerial photos from the EAARL surveysshow more than 20 erosion events with widths of 100 to 300 m in thisregion. The extent of overwash fans from the shoreline varies between80 to 200 m, where the sand deposits cover the road. Rodanthe wasimpacted by overwash and the northern side was covered by sand de posits with 5 km length and more than 200 m width.area for both pre- and post-storm conditions, systematic errors werecorrected in the raw LiDAR data (Mitasova et al., 2009). Water turbidity,bubbles, and white foam in the surf zone can cause refraction of the laserbeam that is emitted from survey equipment, so unreliable points in thisregion were removed from the dataset. The result point cloud covers100 to 250 m width of the island. Each dataset was interpolated withthe RST (Regularized Spline with Tension) method (Mitasova et al.,2005) into a 1 m raster. The bathymetry data and the LiDAR-basedDEM may not align vertically on the edges of dataset, and thus a 30m buffer zone was created to allow for a smooth linear transition be tween the LiDAR-based topography raster and the bathymetry DEM. TheLiDAR point cloud is much denser on the dunes. Therefore, a uniformresolution of 1 m was selected to ensure efficiency and completenessof the raster. The resulting pre- and post-storm DEMs represent theground surface elevations throughout the study area.3.2. Large-domain models for storm-driven waves and circulation3.2.1. Atmospheric forcingFor storm simulations on large domains, atmospheric pressure andwind velocities are used as surface forcings for waves and circulation.This study uses a re-analysis product from OceanWeather Inc. based onland-, sea-, air-, and satellite-based observations (Bunya et al., 2010).For Isabel, the wind fields consist of surface pressures and wind veloc ities on a nested set of regular grids. The larger grid spans over60 to 85 W longitude and 15 to 48 N latitude with a regular 0:125 resolution, and the nested sub-grid extends over 74 to 78 W longitudeand 36 to 40 N latitude with a regular 0:025 resolution. Surfacepressures and wind velocities are interpolated in time and space fromthese regular grids onto the unstructured mesh used by the hydrody namic models.3.2.2. ADCIRC þ SWANThe large-scale effects of Isabel on nearshore waves and circulationare predicted by using the tightly-coupled ADCIRC (Luettich et al., 1992;Westerink et al., 2008) and SWAN (Booij et al., 1999) models, which arewidely-used for storm surge and coastal flooding (Bunya et al., 2010;Hope et al., 2013; Cyriac et al., 2014). ADCIRC uses thecontinuous-Galerkin, finite-element method to solve modified forms ofthe shallow water equations on flexible, unstructured meshes. SWANsolves the wave action density equation for the evolution of wave en ergy, and it was extended to use unstructured meshes (Zijlema, 2010).When coupled tightly, the ADCIRC þ SWAN models can pass informa tion through local memory without the need for interpolation betweenmodels (Dietrich et al., 2011). The coupled models can provide pre dictions of water levels, depth-averaged currents, and wave parameters(significant height, peak period, etc.) throughout a large domain, butwith focused resolution in the coastal region of interest. ADCIRC þSWAN has been validated for coastal flooding applications along the U.S. Gulf (e.g. (Dietrich et al., Luettich),) and Atlantic (e.g. (Dresback3. Methods3.1. Digital elevation model for Hatteras IslandThe process-based, numerical models will require information aboutthe pre-storm ground surface elevations as initial conditions, and aboutthe post-storm ground elevations for validation. Thus, high-resolutiondigital elevation models (DEMs) were developed from existing sour ces. Bathymetric data were derived from a state-wide DEM with 10 mresolution that was developed for floodplain mapping studies (Blantonet al., 2008). This DEM was then supplemented with high-resolutionpre-storm and post-storm LiDAR data for Hatteras Island topography(Bonisteel et al., 2009). To obtain high-resolution DEMs for the study4
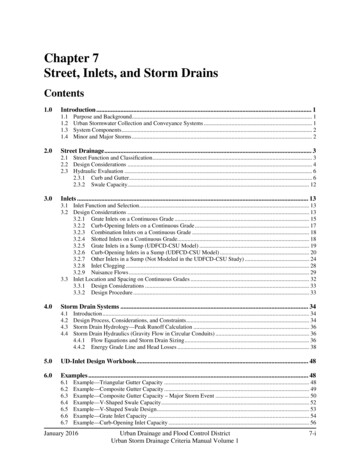
A. Gharagozlou et al.Coastal Engineering 158 (2020) 103674Fig. 4. Boundary conditions extracted from ADCIRCþ SWAN and used in XBeach. The water levels areinterpolated from ADCIRC to the four corners of theXBeach mesh; the left sub-figure shows the time seriesused for the 30-km XBeach mesh. During the peak ofthe storm, water levels are set to zero at the soundside boundary to maintain a positive water depth inXBeach. The wave parameters (significant height,peak period, mean direction) are interpolated fromSWAN at 15 points along the offshore boundary; theright sub-figure shows the time series for significantwave heights at three locations in the 30-km XBeachmesh.et al., 2011),) coasts.ADCIRC þ SWAN predictions were saved at specific locations nearHatteras Island, and then used as boundary conditions for XBeach. Timeseries of ADCIRC water levels were saved at two locations offshore andtwo locations in the sound, and then used as boundary conditions at thefour corners of the mesh used by the morphodynamic model (Fig. 4).Time series of SWAN wave parameters (significant height, peak period,and mean direction) were saved at 15 locations at the offshore boundaryin XBeach (Fig. 4), which then uses the parameters to generate aJONSWAP spectrum with γ ¼ 3:3 and directional spreading of 20, whichis consistent with similar studies on the U.S. Atlantic (Schambach et al.,2018) and Gulf coasts (Passeri et al., 2018). The morphodynamic modelinterpolates spatially and temporally the input boundary conditions togenerate values along its boundaries.Table 1Settings for XBeach input parameters in this study.3.2.3. Unstructured meshThis study uses an edited version of the high-resolution NC9 mesh(v9.98) (Blanton and Luettich, 2008), which has more than 90 percent ofits mesh resolution in the NC coastal region (Fig. 2). The resolutionvaries from 100 km in the Atlantic Ocean to 50 m in the nearshore ofNC. The mesh extends inland to the 15 m topographic contour to allowfor storm surge and flooding prediction. Ground elevations at the meshvertices were interpolated from several high-resolution DEMs to resolvebathymetric and topographic features such as inlets, dunes and rivers(Blanton and Luettich, 2008).The typical mesh resolution on Hatteras Island was about 100 m,and thus the beach and dune system was represented with only 1–2 el ements in the cross-shore direction. To improve the representation ofthis system, the maximum resolution was increased to about 20 m onthe Outer Banks between Cape Hatteras and Oregon Inlet. This resolu tion was selected partly due to concerns about model stability (i.e. tomaintain an efficient time step under the Courant-Friedrichs-Lewycondition), but it was also informed by the XBeach mesh sensitivityresults, as described in Section 4.3.Input ParameterTypical Value(s)ThisStudyMorphological accelerationfactor, fmor , morfac1 to 10 (McCall et al., 2010;Lindemer et al., 2010)10Maximum shields parameter,θmax , smax0:8 to 1:2 (McCall et al., 2010;Harter and Figlus, 2017)0.8Wave asymmetry and skewness,γua , facua0:1 to 0:3 (Nederhoff, 2014;Schambach et al., 2018)0.3Critical avalanching slope underwater, wetslp0:1 to 1:0 (McCall et al., 2010;Roelvink et al., 2010)0.2Threshold water depth to includeStokes drift, hmin0:001 to 1:0 (McCall et al., 2010;Roelvink et al., 2010)0.052010), while the difference in model results was less than 2 percent; thisstudy used fmor ¼ 10. The model was calibrated using two parameters.One parameter, γ ua , accounts for the effects of wave asymmetry andskewness, which can have a significant influence on the sedimenttransport rate during overwash in the surf zone (Nederhoff, 2014).Sensitivity tests have shown an optimal value of γ ua ¼ 0:3 (Schambachet al., 2018), which was used in this study. The other parameter, Smax , isthe Shields parameter and limits the returning flow speed during over wash. It has been shown that XBeach overestimates the erosion of thedunes during overwash, and this limiting parameter is needed to controlthe flow speed (McCall et al., 2010; Harter and Figlus, 2017). Similar toprevious studies, the best results were achieved by using Smax ¼ 0:8. Thewetslp parameter defines the threshold for the start of avalanching onwet nodes. The hmin parameter prevents very strong return flows in veryshallow water conditions. The values for these parameters were cali brated within their default ranges.3.3.2. Structured meshesXBeach is applied on a large domain with a total length of about32 km. A high-resolution mesh was generated to represent the ba thymetry and topography of the barrier island (Fig. 2). The model in corporates this curvilinear mesh with 2100 420 cells with coverage ofthe island between the towns of Avon to Rodanthe. To allow fordevelopment of waves at the boundary, the mesh extends 2 km offshoreand 1:8 km on the lagoon side. Mesh resolution varies locally in crossshore direction with minimum of 3 m cell spacing on the beach and onthe surf zone, and maximum of 30 m at the offshore boundary.Alongshore spacing of this mesh is about 15 m.In addition to the large-domain mesh, smaller meshes with varyingresolutions were generated to analyze the sensitivity of model accuracy.These smaller meshes cover a 4 km sub-region of the larger mesh,extend 2 km in offshore direction and 1:8km on the lagoon side (Fig. 2).The sub-region coincides with the largest dune erosion of 3 m duringIsabel. All XBeach parameters are consistent between region and subregion, and boundary conditions were implemented from ADCIRC þSWAN simulation results. In the sub-region, a ‘base’ mesh was3.3. Process-based model for morphodynamics3.3.1. XBeachXBeach (Roelvink et al., 2009), is a robust morphodynamic modelingtool for nearshore processes during extreme events. The model solvesthe time-varying, short-wave action balance equation andtwo-dimensional, depth-averaged shallow water equations of mo mentum and continuity and includes infragravity wave effect,avalanching, wave breaking, dissipation, etc.For this study, several XBeach settings were calibrated differentlyfrom their defaults, but consistently with other recent studies. Table 1describes these parameters and their associated values in this study. Thetime scale of bed level change is often much longer than for hydrody namic processes, so XBeach uses an acceleration scheme (Roelvink,2006) to speed up the morphological evolution by a factor fmor relative tothe hydrodynamic time scale. Sensitivity tests have shown animprovement in computation time for fmor up to 20 (Lindemer et al.,5
A. Gharagozlou et al.Coastal Engineering 158 (2020) 103674Table 2Locations near NC where observations were collected during the study period. Significant wave heights were observed at four buoys operated by the NOAA NationalData Buoy Center (NDBC) and at a directional waverider operated by the USACE Field Research Facility (FRF) in about 17 m depth offshore of Duck. Water levels wereobserved at four stations operated by the NOAA National Ocean Service 120865648386525878651370East of Cape HatterasSouth of Cape HatterasDiamond ShoalsFrying Pan ShoalsOffshore of DuckWilmingtonBeaufort, Duke Marine LabOregon Inlet 7075.54875.74734.625 N31.760 N35.005 N33.485 N36.168 N34.227 N34.720 N35.795 N36.183 NXXXXXconstructed to have a constant alongshore spacing of 15 m and mini mum cross-shore spacing of 3 m (Table 4). Then in sensitivity studies,the mesh spacing in alongshore direction is increased up to 200 m anddecreased down to 5 m, and the cross-shore mesh spacing is changedfrom 3 m to 30 m.PNSS ¼ 13.4. Model accuracyXBeach model predictions are compared to pre- and post-storm ob servations, and the model accuracy is calculated with several metrics.These calculations are performed only on the region that contains theLiDAR survey data. We use three metrics: the water overpassing areaWOA, the bias BMN , the skill score SS.Bias (BMN ) is the mean error between predictions and observations,and it is calculated as a point-to-point difference. A negative BMN willindicate an overestimation of erosion, while a positive BMN will indicatean underestimation in erosion. The BMN is computed as:N1 Xzp;iN i¼1zo;i Δzo;i Δzp;iPN2i¼1 ðΔzo;i Þ 2i¼1XXXX(2)where Δzo is the change in observed elevation (between pre- and poststorm conditions), and Δzp is the change in predicted elevation (again,between pre- and post-storm conditions).For both BMN and SS, we emphasize a difference between our methodand previous studies (McCall et al., 2010; Harter and Figlus, 2017),which calculated SS at the XBeach mesh resolution, i.e. by comparingerosion predictions only at the computational points. However, ouranalyses will show that SS is sensitive to the resolution over which thecalculation is performed. Therefore, we will compute BMN and SS withtwo methods. (1) Similar to the previous studies, pre and post-stormDEMs are interpolated onto the XBeach mesh, and then BMN1 and SS1are calculated over the XBeach mesh vertices. Thus, the number ofpoints (N) depends on the resolution of the mesh. (2) Model outputs arelinearly interpolated into a 1 m DEM, and then SS2 is calculated usingthis DEM and pre- and post-storm DEMs. In this method, the number ofraster cells is constant for all 4-km meshes regardless of their resolution.It is noted that, for the second method, the interpolation of XBeachresults onto the 1 m DEM can add error to the BMN2 and SS2 calcula tions. To quantify the contribution of this interpolation error, wecalculated an SS2 value by examining only the observed topographicchanges, without any XBeach simulation. The post-storm DEM wasinterpolated onto the base 4 km XBeach mesh and back onto the 1 mDEM, and then this double-interpolated DEM was used as the ‘predicted’post-storm condition in an SS2 calculation. If the interpolation did notintroduce any errors, then this SS2 value should be
Beach and dune erosion were modeled at cross-shore transects in the northern Outer Banks (Fauver, 2005; Gen-carelli et al., 2009), but the sediment transport was found to be domi-nant in the alongshore direction. These predictions were improved with newer models to include land cover effects on the dune erosion (Karanci et al., 2014).