Transcription
UNCTAD Research Paper No. 1UNCTAD/SER.RP/2017/1JULY 2017AlisaDiCaprio(Asian Development BankInstitute),Amelia U.SantosPaulinoRegional tradeagreements, integrationand development(UNCTAD)andMaria V.Sokolova(UNCTAD and GraduateInstitute Geneva)AbstractDeveloping countries have become more active participants inregional trade agreements, which raise questions about how thebenefits of integration are distributed. A key concern is whethercountries at the low end of the income spectrum are able to capturedevelopment gains from integration. Historically, such impacts havebeen difficult to identify with precision. This paper contributes to theunderstanding of such issues by analysing the impact of regionalintegration on growth and within country inequality. The investigationdevelops two measures of regional integration using trade agreementparticipation as a proxy for preferential trade access. The analysisshows that regional integration leads to higher economic growth andlower within-country inequality in member countries. The directdevelopment effects can be further enhanced by a secondtransmission channel whereby a country captures indirect benefitsfrom any agreements to which its trading partners are party. Theability to capture gains from integration varies across developingcountry regional groups with developing Asia benefiting on par withthe developed world.Key words: Free trade agreements, regional integration, panel data, low-incomecountries, least developed countries
2UNCTAD Research Paper No.1ContentsAcknowledgements .21. Introduction .32. Channels linking trade integration and development .52.1 Impacts and channels of regional trade agreements on trade .52.2 Estimating the effect of regional integration on development .72.3 Data definition and sources .83. Empirical results .83.1 Internal and external exposure to regionalization .83.2 Econometric results .103.3 Further discussion .144. Conclusion .17Annex Tables.18References .23AcknowledgementsThe authors are grateful to seminar participants in the Asian Development Bank Institute, Tokyo, in July2016, and Shanghai Forum 2017, China, for useful comments and suggestions on a previous version ofthe paper. Patrick Osakwe and an anonymous referee also reviewed and provided comments on thepaper. Any remaining errors are the authors’.
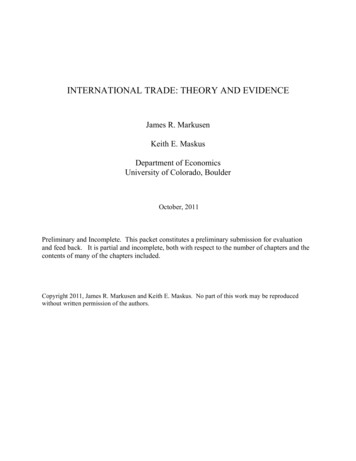
3UNCTAD Research Paper No.11. IntroductionRegional trade agreements (RTAs) can be a useful tool in promoting growth. 1 RTAs structure trade in a waythat can increase domestic productive capacity, promote upward harmonization of standards, improveinstitutions, introduce technical know-how into the domestic market and increase preferential access todesirable markets. These are outcomes that could benefit developing economies in general and particularlythe least developed countries (LDCs) and other low-income countries. However, most studies of regionalintegration agreements show that, on average, low-income countries benefit less (see for exampleAriyasajjakorn et al., 2009; Feenstra, 1996).Despite the relatively low benefits for LDCs, every country in the LDC category is a member of at least oneRTA. The agreements range from partial scope agreements to economic integration agreements targetingpolitical union. Most RTAs involving LDCs are South–South agreements (figure 1), which are generally poorlyimplemented and not known to be particularly beneficial for the industrialization of partner countries. There isalso an increasing, albeit small, number of agreements in which LDCs are part of North–South agreements(for example the European Union-Caribbean Forum (CARIFORUM) Economic Partnership Agreement). Theexpected impact of LDC participation in North–South agreements is larger, but few studies have sought toquantify the impact.Figure 1. Regional trade agreements by trading partner type (1990-2015)Source: Authors’ calculations based on IMF data and Bergstrand (2015).Note: SS represents South–South; SN, South–North; and NN, North–North RTA relationships.The paper’s motivation is rooted in the Sustainable Development Goals. The Goals clearly recognize the roleof trade as a potential development tool. In particular, they highlight the role inequality plays in holding States1Regional trade agreements are defined as any agreement involving tariffs lower than most-favoured nation rates.
4UNCTAD Research Paper No.1back (Goal 10 concerns reduced inequalities) and the potential role trade can play in addressing this (Goal 2targets zero hunger and Goal 8 targets decent work and growth). In 2016, RTAs were the de facto way toaccess the global trade regime. As a result, a clear understanding of whether RTAs promote developmentaloutcomes such as reducing inequality is paramount.This paper explores the question of how trade agreements affect inequality using two levels of analysis. Thefirst is at the national level. A sovereign State can join an existing RTA or create a new one with its tradingpartners. The introduction of new trade relationships will affect between-household inequality in memberStates mostly through the impacts on the labour markets and wage earnings, akin to the general linksbetween trade and poverty, although the direction is unclear.The second level is regional. Not all neighbouring States have RTA relationships. Yet where an RTA exists,even non-member States are impacted by changes in trade flows. That is, there are potential impacts for acountry that is not in a formal RTA but trades extensively with countries that are highly exposed to regionalagreement with other countries. This feature is incorporated into the analysis by estimating the effects ofRTAs enacted by trading partners of a country with third parties. To differentiate this from the direct benefitsof being a party to an RTA, this indirect measure is referred to as external exposure to regionalization.The literature on the impact of RTAs on non-member countries has focused largely on trade outcomes (seefor example Winters and Chang, 2002) and growth rates (Hur and Park, 2012). Trade, on average, improvesa country’s growth and such an impact is expected to be higher in less developed countries. However, tradehas multidirectional impacts on inequality and development.This level is particularly critical for LDCs, which would have the most to gain if RTAs narrowed regional gapsin inequality. Yet, while LDCs often receive the most preferential treatment, their vulnerability to shocksmakes the benefits from openness (both direct and indirect) less evident. While RTAs can lead toconvergence, some show that the poor countries in a region are more likely to diverge (see for exampleVenables, 1999).This paper attempts to capture both growth and development effects by considering whether lower levels ofwithin-country inequality can be attributed to RTAs, controlling for the impact on low-income countries andother regional groups.Two new measures of regional integration are introduced. The first measure is based on bilateral tradebetween RTA members and captures the ability of a country to have a self-determined regional trade policy.The second relates to the situation when a country is engaged in the regional networks of other countries.The results show that both a country’s own regionalization and its exposure to the regionalization of otherspositively contribute to economic growth globally. However, the results vary according to developing countryclusters, with some areas such as sub-Saharan Africa having experienced relatively lower growth as a resultof internal regionalization and exposure to regionalization.In addition, growth results in positive distributional outcomes in the developing country clusters that areinvolved in more regionalization, compared with the rest of the world. For example, in developing Asia, a 10per cent increase in internal regionalization resulted in a nearly 3 per cent reduction in income inequality.This suggests that location in a region that is characterized by noodle bowl regional trade policy activitiesobserves a lesser increase in inequality. 2 The paper also addresses the impact of various types ofregionalization on inequality through its impact on gender.Liberalization increases trade by lowering the tariffs that distort markets. Going one step further, trade hasbeen shown to increase growth (see for example Frankel and Romer, 1999). However, the evidence abouthow openness impacts development-relevant indicators is less conclusive. This has been recognized at themultilateral level, and policymakers have introduced policy guidelines aimed at making trade more inclusivefor all participants. One of the most prominent examples is the European Commission’s Sustainability ImpactAssessment that was first developed for the World Trade Organization (WTO) Doha Development Agenda2Baldwins (2006), referred to the well-known puzzle of overlapping RTAs described by Bhagwati (1991) as ‘spaghetti bowl’,’noodlebowl’, to describe the proliferation of trade agreements in Asia.
5UNCTAD Research Paper No.1negotiations. It promotes corporate social responsibility, which has been shown to translate into more sociallysustainable trade (Vidal-Leon, 2013).The literature shows a number of transmission channels for welfare gains from trade. The lessons from thetrade literature are great, especially the contribution of various elements to changes in income. However,Arokolakis, Costinot and Rodriguez-Clare (2013) suggest that the welfare gains from trade may vary by input,that is, imports of intermediate inputs and supply networks, yet overall can be estimated by looking atstandard trade statistics.The literature that explores the impact of liberalization on household inequality has tended to show mixedimpacts in developing countries. Over time, even as globalization has progressed, inequality has increased bymany measures (Harrison et al., 2010). Goldberg and Pavcnik (2007) show that inequality increases sincegains from trade are directed mainly to skilled workers. Both Chang et al. (2009) and Dollar and Kraay (2004)show that increasing openness leads to faster growth and less absolute poverty in poor countries, but withambiguous impacts on household inequality.Other studies focus on demand forces to explain cross-country differences in income or welfare as a result oftrade, showing a strong positive relationship between prices and the country’s income per capita (see forexample Feenstra and Romalis, 2014). Fajgelbaum et al. (2011) suggest that income inequality within acountry matters for trade patterns and the pricing of traded goods.Of course, RTAs are not purely about liberalization (see for example Grossman, 2016), and lower averagetariff rates are only one element. They are also characterized by limitations on policy space, preferentialmarket access to partner countries and behavioural changes to firms in impacted sectors. Thus, while thispaper is related to the literature on welfare impacts of liberalization, the effects shown are related but notparallel. The paper aims to contribute evidence on the potential of trade to benefit all populations, at a timewhen the gains from trade are being questioned on a global scale.Section 2 presents the empirical approach to measuring the impact of regional integration on developmentand describes the data. Section 3 presents the results of the empirical estimations. Section 4 concludes.2. Channels linking trade integration anddevelopment2.1 Impacts and channels of regional trade agreements on tradeRegional integration has long been a tool in trade promotion; increased trade flows and evolving commerciallinks within RTAs have been forged within and between regions in the last two decades. In developingcountries, trade agreements help determine national trade policy and thus potentially could amplify theimpact of trade on development. RTAs have the potential to promote higher standards in terms of labour,environment, transparency and other progressive reforms and non-economic policy objectives. Even if suchbenefits are realized, there are concerns about policy sovereignty and the balance between commitmentsand flexibility. 3There is a large body of literature on the impact of RTAs and preferential trade agreements, particularly ontrade patterns. However, the empirical evidence is not conclusive; see for example, Estevadeordal et al.(2008) for a related discussion. There are many micro-level characteristics that are simultaneously impactedunder the political and commercial effects of an RTA. Many of these are affected by the underlying reasonsfor the implementation of an RTA (for example commitment, foreign aid and integration) and are thereforeendogenous. However, the aggregate trade impact is generally independent of the motivation for an RTA.This paper does not distinguish between types of trade agreements. While there are different and distinctregional and income-based patterns of integration, the analysis explores impacts rather than drivers and,therefore, extrapolates from the typology. Some trade arrangements are non-reciprocal (for example,3See Bagwell and Staiger (2001) for a related discussion about national policies in the context of international economic institutions.
6UNCTAD Research Paper No.1Everything but Arms or the African Growth and Opportunities Act). These agreements most often function asa foreign aid tool and may not have strong trade impacts. There are also differences in the content ofagreements – RTAs in Asia tend to forego dispute settlement, while United States of America-basedagreements tend to include rules on intellectual property that go beyond what is required by WTO. The scopeof RTAs also differs. While RTAs notified under Article XXIV of WTO must ultimately cover substantially alltrade, partial scope and South–South agreements do not have this requirement and may cover only a verylimited selection of goods and services.From the earliest iterations of the RTA literature (Viner, 1956) it has been acknowledged that in addition todirect impacts on RTA members, RTAs also have impacts on countries that have existing tradingrelationships with new RTA members. This has developed into discussions on whether the proliferation ofRTAs promote freer global trade (see for example Summers, 1991; Maggi, 2014) or disrupt the naturalprocess of global liberalization (Bhagwati 1991; 1993; 1995).Thus, within-RTA and outside-RTA effects, referred to in this paper as internal regionalization and exposureto regionalization, must be differentiated. A key contribution of the paper is the construction of two indices ofregionalization, measuring trade between countries and trade with partners that are connected underdifferent agreements to other countries. Internal regionalization (Reg1) is determined within a country, as aresult of domestic policies. Exposure to regionalization (Reg2) gauges the weighted regionalization of thetrading partners, or the third market effect. Both measures are aggregates built on RTA activity either by themember country or by its trading partners. Aggregation of the information allows for the measurement of theeffect of general engagement in globalization policies, without concerns about the nature or involvement ofsuch engagement.2.1.1 Internal regionalizationRTAs drive international trade and promote stronger ties between countries. They do this through theelimination or reduction of barriers to trade such as import tariffs, export duties and quantitative restrictions.Trade liberalization benefits both members and non-members through preferential market access andinternal commitments to lower domestic barriers to trade. Thus, an RTA may amplify the development impactof trade by increasing trade flows and access to goods and services, improving institutional and policyenvironments and improving distributional outcomes.Regionalization refers to trade between several countries, connected under different agreements to othercountries. This bilateral trade linkage, internal regionalization (Reg1), is measured as follows:𝑅𝑅𝑅𝑅𝑅𝑅1𝑖𝑖 ��𝑖 𝑅𝑅𝑅𝑅𝑅𝑅𝑖𝑖𝑖𝑖 𝐽𝐽 ��𝑖(1.1)where the regionalization of a country i in relation to bilateral trade with partner country j (Reg1), ismeasured as trade covered under any type of RTA as a percentage of total trade, and RTA is a preferentialtrade agreement of any type. Reg1 is bounded (0 and 1). If a country does not participate in RTAs of anytype, the measure equals 0. The closer the value is to unity, the larger the share of a country’s total tradethat is conducted under various RTAs. The measure Reg1 is directly influenced by the number of members ofan RTA and the volume and value of trade among them. Thus, this is defined as an endogenous variable ingrowth regressions.2.1.2 External exposure to regionalizationThe previous studies have focused on direct impacts of regionalization through trade creation and diversion.However, from a development perspective, the potential for neighbourhood spillovers introduces an additionaldevelopment channel. This can be thought of as indirect RTA participation. That is, there are potentialbenefits from exposure to integrated markets, even if a country is excluded from a formal RTA.In this case, the development channel is the possibility of opening up a large export market for country k(alternative destinations), particularly in the presence of strong intermediate trade linkages through supplychains to the country j that signs an RTA. In addition to the prospects for market diversification, a measure ofindirect participation effect potentially captures the impact in regional and global markets of larger players,such as China. There are also potential costs arising from a country’s exposure to the regionalization of itstrading partners, particularly in terms of growth and distributional effects.
7UNCTAD Research Paper No.1The measure of indirect participation (Reg2) gauges the weighted regionalization of trading partners. That is,the focus of Reg2 is third-country effects, not the bilateral trade partner of country i but the trade partners ofcountry j. The index of exposure to regionalization (Reg2) is defined as ��𝑖𝑖𝑖𝑅𝑅𝑅𝑅𝑅𝑅2𝑖𝑖 𝐽𝐽( where𝐽𝐽 𝑖𝑖𝑖 𝐽𝐽 ��𝑖 𝑅𝑅𝑅𝑅𝑅𝑅1𝑗𝑗, 𝑖𝑖 )(1.2)is the share of trade ij in the total trade of country i; and 𝑅𝑅𝑅𝑅𝑅𝑅1𝑗𝑗, 𝑖𝑖 is the same asReg1 for country j, calculated without taking into account the trade between country pair ij.If the trade between country pair ij constitutes 50 per cent of the trade of i and 70 per cent of the trade of j isperformed under some form of regional trade agreements with countries other than i. then Reg2 for ij is 0.5 x0.7 0.35. Similar to Reg1, Reg2 is bounded between 0 and 1. If country i is isolated from secondaryregional integration, then Reg2 0. The more a country is connected to countries that are integratedregionally, the higher the value of the measure. Thus, this value is highest for countries located in bowls ofregionalization. It should be noted that Reg2 is not a measure of trade diversion of an RTA. In its calculation,the exposure to regionalization of country i's own RTA partners is not excluded - with the exception ofcountry i itself.Reg1 is a measure of domestic policy, as it is a decision made explicitly by each country involved. However,in the current economy, RTAs are rarely concluded between two countries that have no other RTAs. Reg2captures this effect. Reg2 is effectively an indicator of the development spillovers country i captures from itslocation in an area of higher intensity regionalization.2.2 Estimating the effect of regional integration on developmentThis paper seeks to empirically quantify the growth and distributional impacts of regional integration.Particularly, it examines whether growth and inequality fare differently in low-income countries and the leastdeveloped countries, as well as in other developing country clusters.The following growth equation is �𝑖𝑖 𝛽𝛽0 𝛽𝛽1 𝑅𝑅𝑅𝑅𝑅𝑅1𝑖𝑖𝑖𝑖 𝛽𝛽2 ��𝐴𝐴𝐴𝐴𝐴 𝑅𝑅𝑅𝑅𝑅𝑅1𝑖𝑖𝑖𝑖 𝛽𝛽3 ���𝑔𝑖𝑖𝑖𝑖 1 ) 𝛽𝛽5 ���𝑖𝑖𝑖 ) 𝛽𝛽5 �𝑖 ) 𝛽𝛽6 ��𝑙𝑙𝑙𝑖𝑖𝑖𝑖 𝛽𝛽7 ���𝐺𝐺𝐺𝑖𝑖𝑖𝑖 ) 𝛽𝛽8 𝑙𝑙𝑙𝑙(𝑀𝑀2𝑖𝑖𝑖𝑖 ) (2.1) 𝐹𝐹𝐹𝐹𝑖𝑖 𝐹𝐹𝐹𝐹𝑡𝑡 𝜀𝜀𝑖𝑖𝑖𝑖Following Iradian (2005), the specification on the inequality effects of growth and trade is augmented toanalyse the impact of ���𝐻𝐻𝐻𝐻𝐻𝐻𝐻𝑖𝑖𝑖𝑖 ) 𝛽𝛽1 𝑅𝑅𝑅𝑅𝑅𝑅1𝑖𝑖𝑖𝑖 𝛽𝛽2 ��𝐴𝐴𝐴𝐴𝐴 𝑅𝑅𝑅𝑅𝑅𝑅1𝑖𝑖𝑖𝑖 𝛽𝛽3 ���𝑔𝑖𝑖𝑖𝑖 ) 𝛽𝛽4 𝑙𝑙𝑙𝑙2 ���𝑖 ) 𝛽𝛽5 ���𝑖𝑖𝑖 ) 𝛽𝛽6 �𝑙𝑙𝑙𝑙𝑙𝑙𝑖𝑖𝑖𝑖 ) 𝛽𝛽7 ���𝐺𝐺𝐺𝑖𝑖𝑖𝑖 ) 𝛽𝛽8 ���𝐹𝐹𝐹𝐹𝐹𝑖𝑖𝑖𝑖 ) (2.2) 𝐹𝐹𝐹𝐹𝑖𝑖 𝐹𝐹𝐹𝐹𝑡𝑡 𝜀𝜀𝑖𝑖𝑖𝑖where ��𝐴𝐴𝐴𝐴𝐴 represents either a region or a set of regional dummies. If 𝛽𝛽1 0, it implies that theimpact of participation in RTAs or regionalization reduces growth or inequality, on average. If 𝛽𝛽2 0, then adeveloping country region is experiencing the inequality and/or growth decreasing impact of higherregionalization. An analogous regression is estimated for secondary exposure to regionalization (Reg2). Thestandard controls from the literature included in the analysis are as follows: level of human capital asmeasured by enrolment of school-age children, robust to Barro-Lee measure (Educ); governmentconsumption as share of Gross Domestic Product (GDP) (GovExp); financial openness (FinOpen); share ofinvestment in GDP (invest); M2 as a share of GDP (M2); inequality as measured by the Gini coefficient(HHineq); growth of GDP per capita (Growth); and GDP per capita of the previous period (LagGDPpc). Allmeasures are in logarithms (ln) to represent the elasticities between parameters.Development cluster dummies take several values, as LDC dummy, regional dummies (sub-Saharan Africa,dummy for Sub-Saharan Africa (SSA); developing for Asia (all non-high-income countries in the Asian region),dummy DevAs; for Latin America and the Caribbean, dummy LA) and income-related dummies according toWorld Bank classifications (low-income countries, dLIC; lower middle-income countries, dLMIC).
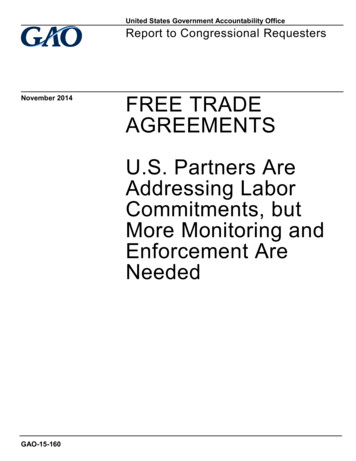
8UNCTAD Research Paper No.12.3 Data definition and sourcesThe sample covers over 100 countries (101–176, depending on specification and data availability) for theperiod 1990–2010 (5-year averages). RTA data is drawn from Bergstrand (2015), and the developingcountry clusters for the empirical analysis are sub-Saharan Africa, developing Asia, and Latin America andthe Caribbean. The analysis also controls for income levels, namely LDCs and low and middle-incomecountries. Bilateral trade flows are from the IMF Direction of Trade Statistics. Other control variablesdescribed above are from the World Bank Worldwide Development Indicators database (WDI). The financialopenness indicator is from the Chinn-Ito index (2014) 4 and income inequality is from WDI and the UnitedNations World Institute for Development Economics Research (UNU-WIDER)'s World Income Inequalitydatabase (WIID). Based on the availability of data, the sample of countries varies by estimation. Completedata descriptions and sources are provided in the annex.3. Empirical Results3.1 Internal and external exposure to regionalizationThe key premise of this paper is that, in the aggregate, participation in RTAs (Reg1) is associated with highereconomic growth and lower inequality (figures 2 and 3). The impact is strongest in developing Asia and alsoevident in Latin America.Figure 2. Regionalization 1 and Economic GrowthSource: Authors’ calculations based on WDI, IMF data. Central African Republic omitted as an outlier, three-year averages used dueto data availability.4See also Chinn and Ito (2006).
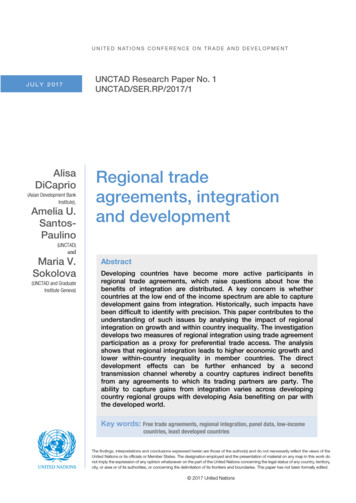
9UNCTAD Research Paper No.1Figure 3. Regionalization 1 and InequalitySource: Authors’ calculations based on WDI and UNU-WIDER data. Central African Republic omitted as an outlier, three-yearaverages used due to data availability.Figures 4 and 5 show the same correlations of integration, growth and distribution for the externalregionalization measure (Reg2). Regional statistics for the Reg1 and Reg2 are provided in the annex. 5Figure 4. Regionalization 2 and Economic Growth5Bilateral trade flows are from the IMF Direction of Trade Statistics.
10UNCTAD Research Paper No.1Source: Authors’ calculations based on WDI, IMF data. Central African Republic omitted as an outlier, three-year averages used dueto data availability.Figure 5. Regionalization 2 and InequalitySource: Authors’ calculations based on WDI and UNU-WIDER data. Central African Republic omitted as an outlier, three-yearaverages used due to data availability.3.2 Econometric resultsTables 1 and 2 show the estimation results of the growth of GDP per capita as a dependent variable andvarious specifications with the two measures of regionalism. The empirical estimations are based onstandard Ordinary Least Squares (OLS) and Generalised System of Moments (GMM) panel data techniques.The potential bias resulting from OLS estimations due to the endogeneity between regressors and the errorterm in the dynamic specification are well known. The system GMM is therefore applied (see Arellano andBover, 1995; Arellano and Bond, 1991; 1998).
11UNCTAD Research Paper No.1Table 1. Growth regression with Regionalization 1VariablesReg1Dependent variable: Growth in gross domestic product per sYesYes3170.373300.29**(0.15)LDC 0.38)DevAs Reg1LA Reg1SSA Reg1dLIC Reg1dLMIC Reg1ControlsYear Fixed EffectsCountry esYesObservationsR-squaredHansen testNumber of 010.41011010.11011010.44101Notes: Robust standard errors in parentheses; *** p 0.01, ** p 0.05, * p 0.1; full tables with all controls are in the annex; datais in five-year periods over 1990–2010; GMM is performed with Instruments (IV )on-year dummies and education levels; Gini istreated as fully endogenous since it is calculated through income.The econometric results illustrate that regional integration, in general, leads to increased GDP per capitagrowth, both through bilateral channels: 10 per cent higher internal regionalization results in a 2.9 per centhigher GDP per capita growth in full OLS specifications (table 1, column 2); and through third-party channels:10 per cent greater external regionalization leads to a 5.6 per cent higher GDP per capita growth in full OLSspecifications (table 2, column 2).
12UNCTAD Research Paper No.1Table 2. Growth regression with Regionalization 2VariablesDependent variable: Growth in gross domestic product per 66)(0.16)(0.34)(0.29)(0.44)DevAs Reg2-0.36(0.36)-0.51(0.54)LA Reg2-0.80**(0.39)-0.95*(0.48)SSA .56***(0.45)-0.69***LDC Reg2dLIC Reg2dLMIC r FECountry n testNumber of 271051050.44105Notes: Robust standard errors in parentheses; *** p 0.01, ** p 0.05, * p 0.1; full tables with all controls are in the annex; data isin five-year periods over 1990–2010; GMM is performed with IV on-year dummies and education levels; Gini is treated as fullyendogenous since it is calculated through income.The analysis controls for additional growth determinants, including investment, education and othermacroeconomic controls, where the coefficients are significant and with the expected signs. However, thepositive impact of education on economic growth cannot be empirically confirmed. The coefficient ofeducation, as a proxy for human capital, is negative and significant across the different specifications. Thismight reflect human capital levels and heterogeneous achievements across countries, as well as a possiblenegative effect from population growth, in tandem with decreasing education expenses (see for example,Belke and Wernet, 2015).The growth regression is ultimately a dynamic panel regression, thus the standard GMM approach may beused to test the hypothesis. As the specifications vary (area dummies include LDCs, regions and incomegroups), a common framework that fits best all specifications is selected. This includes treating the level ofeducation as an exogenous variable (as in Saidi and Aloui, 2010). In addition, consumption-based inequalitygenerally uses GDP (of which gross national product is a subset) and
RTA. The agreements range from partial scope agreements to economic integration agreements targeting political union. Most RTAs involving LDCs are South-South agreements (figure 1), which are generally poorly implemented and not known to be particularly beneficial for the industrialization of partner countries. There is