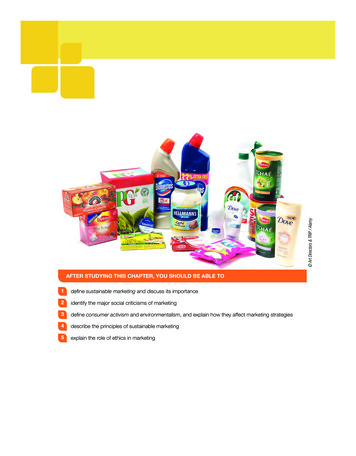
Transcription
Unilever Q4 2010 ResultsFebruary 3rd 2011Paul Polman, CEO. Jean-Marc Huët, CFO.James Allison, Head of IR and M&A.
Paul PolmanChief Executive Officer
Safe Harbour StatementThis announcement may contain forward-looking statements, including ‘forward-looking statements’ within the meaning ofthe United States Private Securities Litigation Reform Act of 1995. Words such as ‘expects’, ‘anticipates’, ‘intends’, ‘believes’ orthe negative of these terms and other similar expressions of future performance or results, and their negatives, are intended toidentify such forward-looking statements. These forward-looking statements are based upon current expectations andassumptions regarding anticipated developments and other factors affecting the Group. They are not historical facts, nor arethey guarantees of future performance. Because these forward-looking statements involve risks and uncertainties, there areimportant factors that could cause actual results to differ materially from those expressed or implied by these forward-lookingstatements, including, among others, competitive pricing and activities, economic slowdown, industry consolidation, access tocredit markets, recruitment levels, reputational risks, commodity prices, continued availability of raw materials, prioritisation ofprojects, consumption levels, costs, the ability to maintain and manage key customer relationships and supply chain sources,consumer demands, currency values, interest rates, the ability to integrate acquisitions and complete planned divestitures, theability to complete planned restructuring activities, physical risks, environmental risks, the ability to manage regulatory, tax andlegal matters and resolve pending matters within current estimates, legislative, fiscal and regulatory developments, political,economic and social conditions in the geographic markets where the Group operates and new or changed priorities of theBoards. Further details of potential risks and uncertainties affecting the Group are described in the Group’s filings with theLondon Stock Exchange, Euronext Amsterdam and the US Securities and Exchange Commission, including the 20-F Report andthe Annual Report and Accounts 2009. These forward-looking statements speak only as of the date of this document. Except asrequired by any applicable law or regulation, the Group expressly disclaims any obligation or undertaking to release publiclyany updates or revisions to any forward-looking statements contained herein to reflect any change in the Group’s expectationswith regard thereto or any change in events, conditions or circumstances on which any such statement is based.
Strong Volume Growth in Difficult Marketsunderlying volume growth highest in 30 yearsvolume share bps change moving average total5.8%3.0% 2.7%3.1%3.7%2.3%2.1%0.1%1980 1990 2000 2005 2007 2008 2009 2010Q4 08Q2 09Q4 09Q2 10Q3 10Q4 10 60% of our business is growing or holding value sharesource: AC Nielsen/IRI/CCR/Kantar/Intage/Aztec
Broad Based Volume Growthemerging marketsdeveloped markets11% 11%10%10%9%8%5%4%4%3%1%1%1%3%1%2%20092010-3%-1%Q1 093% 1%Q2 09Q3 09Q4 09Q1 10Q2 10Q3 10Q4 1020092010Q1 09 Q2 09 Q3 09 Q4 09 Q1 10 Q2 10 Q3 10 Q4 10all of our categories grew volume in 2010
We have Delivered Against our PrioritiesVolume GrowthacceleratedUnderlying Operating MarginincreasedFree Cash Flowdelivered 8Free Cash flow: net cash flow from operating activities – net interest - net capexFY09FY10FY 08FY 09FY 10
Bigger, Better, Faster InnovationInnovations now typically go to 30 markets in under 12 months
Jean-Marc HuëtChief Financial Officer
Q4 10: Strong Top Line GrowthUSG 5.1%8.0%5.1%-1.4%0.0% 10.8bn 12%growth 9.7bnTurnover Q4'09Vol/MixPriceCurrencyAcq/DispTurnover Q4'10
2010: Strong Underlying Sales GrowthUSG 4.1%-0.5%7.3% 44.3bn-1.6%5.8% 11%growth 39.8bnTurnover 2009Vol/MixPriceCurrencyAcq/DispTurnover 2010
Bigger, Better, Faster InnovationTurnover 50m during year 1Axe HairSignal White NowP.F. Chang’s
Bigger, Better, Faster InnovationClearAxe New VariantsAdeS
Q4 10: Personal Care InnovationsHair Bed HeadColour CombatAxe ExciteGlobal
Q4 10: Home Care InnovationsDiG re-launch– China, TurkeySunlight re-launch – AACEE
Q4 10: Food InnovationsCafé Zero – Western EuropeSeason & Shake – UK
Q4 10: Brands into New MarketsClear – ChileDove Hair - China
Q4 10: Brands into New MarketsKnorr Soups - BangladeshMagnum – United States and Indonesia
Q4 10: Positive in-quarter Price Growthunderlying price growth-0.2%-3.1%Q3 09Q4 09-1.2%0.0%Q3 10Q4 10-2.0%-3.3%Q1 10Q2 10
2010: Gross Margin Up 10bpsgross margin bps change by quarter290310240120-25-150-140Q3 10Q4 10-190Q1 09Q2 09Q3 09Q4 09Q1 10Q2 10
2010: Strong Savings Delivery at 1.4bnTotal Savings bn2010 Savings 0.3bn1.41.01.120072008 0.8bn1.4 0.4bn20092010Buying SavingsRestructuring SavingsRegional / Local Initiatives
Higher, Volatile Commodity CostsUnilever Commodity IndexCommodities inflation% increase vs. a year /0801/0901/1001/11Palm OilSunflower OilBrent Crude
2010: A&P Up 30bpsadvertising and promotions bps change by quarterA&P2010 5.6bn240(*)220140130 330m during 201050-60-110 370m during 2009Q1 09Constant currencyQ2 09Q3 09Q4 09Q1 10Q2 10Q3 10-170Q4 10
2010: Underlying Operating Margin up 20bps10bps-30bps40bps15.0%14.8%2009 20bpsGM %A&P %Indirects %2010
Q4 10: Underlying Operating Margin down 20bps-50bps-140bps170bps13.0%12.8%-20 bps2009GM %A&P %Indirects %2010
2010: Double Digit Diluted Earnings per Share Growth4%3%5%5% 1.467%One off Items 2010:10%M&A one-off items- 0.02Other one-off items- 0.04Disposals 0.167%Fully DilutedEPSGrowth25% 1.17EPS 2009Operational RestructuringPerformanceCurrencyPension/ Fin CostsDisposalsTax /OthersOne-off ItemsEPS 2010
2010: Cash Conversion Cycle down 17 days (MAT)Trading Working Capital % Turnover5%MAT 20100%-5%Q1 09Q2 09Q3 09Q4 09Q1 10Q2 10MAT Average TWC % T/overClosing TWC % T/overQ3 10Q4 10Cash Conversion Cycle3 daysStocks61 daysDebtors34 daysCreditors91 days
2010: Healthy Free Cash Flow bn0.21.71.30.16.33.4Operating profit beforedepreciation andamortisationWC ChangeCapexTaxOthersFCF 2010
Balance SheetNet Debt 6.7bn( 0.3bn increasefrom 2009)Pension Deficit 2.1bn(from 2.6bn atend 2009)Cash Contributionsto Pensions 0.7bnQuarterly Dividend 0.208 per NV share
Paul PolmanChief Executive Officer
The Environment in 2011 Difficult environment, particularly in the Developed world Emerging market growth continues Inflationary pressures and rapid rise in many key commodities Expecting a more rational approach in terms of pricing Unilever is stronger and better placed to tackle these issues
The Organisation now Aligned 80bn 44bn 40bnenvironmental impact
Sharpening the Portfolio through M&AHair TIGIHair T&GPersonal Care Sara LeeHair / Skin Alberto CulverIce Cream Greece / DenmarkFrozen Italy and TomatoesBrazil Disposal
A More Competitive Unilevervolume share uphighest ever innovation ratebps2010MAT '0933%30%MAT '10FY 2009FY 2010
Brands HealthierWorld Number 1World Number 2Local StrengthSavouryLaundryOral CareDressingsDaily Hair CareHousehold CleaningTeaIce CreamSpreadsDeodorantsMass SkinNumber 1 and 2 in more than 80% of the business
100 Brands into New Markets in 201020092010Series 1 1002x 50Category 1Category 2
Winning in the Market PlaceOral Care Market Development ModelFranceIndonesiaNigeria
Winning through Continuous ImprovementGlobal functions now in place Supply Chain Buying Enterprise SupportBetter equipped to manage volatile commoditiesWe are faster, more disciplined, with strong savings programmes and a leaner cost structure
Winning with PeopleConsumer and Customer FocusBias for ActionA New Unilever: Faster, More ConfidentPepsodent Philippines6 weeks from sign off to on-shelf availability
Unilever Long Term Focus1. To drive volume growth ahead of the markets2. Steady and sustainable underlying operating marginimprovement3. Strong cash flow
Questions
Bigger, Better, Faster Innovation Turnover 50m during year 1 . Unilever is stronger and better placed to tackle these issues. The Organisation now Aligned 40bn 80bn . We are faster, more disciplined, with strong savings programmes and a leaner cost structure. Winning with People Consumer and Customer Focus Bias for Action A New .