Transcription
Health, Wealth, and Housing: Promoting Cross- Sector Collaborationsfor Equity ConferenceFireside Chat:Looking at the Future of HealthEquity in Los Angeles CountyOctober 4, 2017Barbara Ferrer, PhD, MPH, MEdDirector, Los Angeles County Department of Public Health
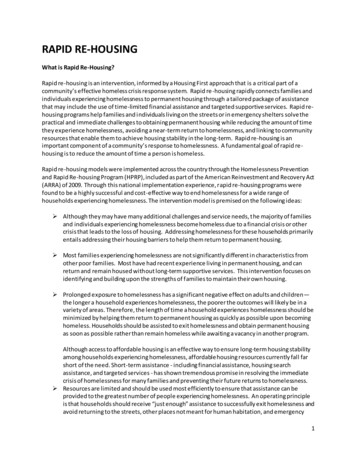
Slide 1Life Expectancy at Birth by Genderand Race/Ethnicity, LA County, 80.57579.172.47065AllWhiteLatinoAfrican AmericanAsian
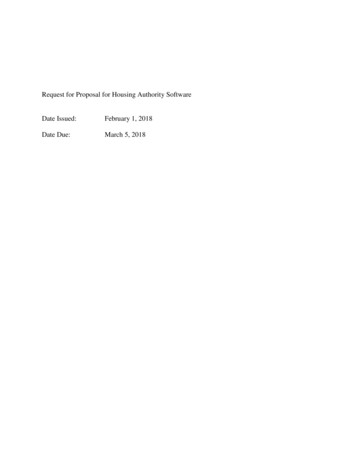
Slide 2Infant Mortality by Race/EthnicityLA County, 2014Infant Death Rate per 1,000 Live Births1099876654.34432.72.4210HP 2020LA CountyAsianLatinoTable does not include data for Native Hawaiian and other Pacific Islander or American Indian/Alaskan Native.Source: Los Angeles County Department of Public Health, Office of Health Assessment & Epidemiology, Mortality in Los Angeles County 2014BlackWhite
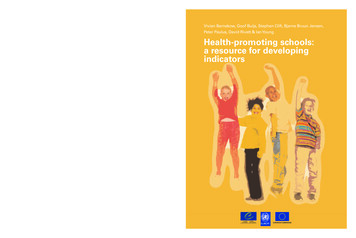
Slide 3HP2020L.A.CountyAsianLatinoBlackWhiteHealth Inequities by Race/Ethnicity,LA County-593405511854655Coronary heart disease death rate (age-adjusted per 100,000)103.4116.778.492.5177.1132.3Stroke death rate (age-adjusted per 2Lung cancer death rate (age-adjusted per 100,000)45.527.524.116.540.133.9Diabetes death rate (age-adjusted per 100,000)66.621.918.329.931.515.5HIV infection-related death rate (age-adjusted per 100,000)3.32.20.71.88.41.8Homicide death rate (age-adjusted per 100,000)-5.715.4262.1Infant death rate per 1,000 live births64.42.54.510.33MortalityDeath rate from all causes (age-adjusted per 100,000)Chronic obstructive pulmonary disease death rate (age-adjustedper 100,000)Table does not include data for Native Hawaiian and other Pacific Islander or American Indian/Alaskan Native.Sources: Los Angeles County Department of Public Health, Office of Health Assessment & Epidemiology, Mortality in Los Angeles County 2013 Leading cases of death and premature death with trends for 2004-2013,October 2016. Los Angeles County Department of Public Health, Office of Women’s Health, Health Indicators for Women in Los Angeles County: Highlighting Disparities by Ethnicity and Poverty Level, January 2017.
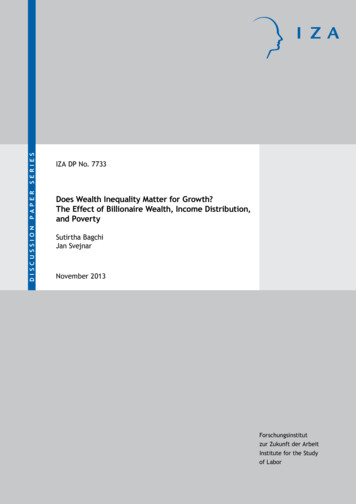
Slide 4Factors that impact health outcomesMortality (50%)Health OutcomesMorbidity (50%)Health behaviors(30%)Tobacco useDiet & exerciseAlcohol useUnsafe sexClinical care(20%)Access to careQuality of careSocial & economic factors(40%)EducationEmployment & IncomeRacismFamily & social supportCommunity safetyPhysical environment(10%)Environmental qualityBuilt environmentHealth FactorsPrograms andPoliciesSource: http://www.countyhealthrankings.org/our-approach
Slide 5Need for SafeSpaces to ExerciseBlack and Latina womenfare worse among: Percent of adults whobelieve their neighborhoodis safe from crimePercent of adults who reporttheir neighborhoods do nothave walking paths, parks,playgrounds, or sport fieldsHealth Indicators For Women In Los Angeles County: HighlightingDisparities by Ethnicity and Poverty althIndicators2.pdf
Slide 6Food Desert inLA County, USDA2015 Green low income andlow access areas at 1 and10 miles Orange low income andlow access at ½ and 10milesCourtesy Economic Research Service at USDA: -research-atlas/go-to-the-atlas/
Slide 7CalEnviroScreen 3.0 Results, 2017LA County communities disproportionately burdened by multiple sources of pollution andwith population characteristics that make them more sensitive to -data
Slide 8
Slide 9How DPH Reframes Using an Equity LensConventional QuestionHow can we promotehealthy behavior?Health Equity QuestionHow can we target dangerous conditions andreorganize land use and transportationpolicies to ensure healthy spaces and places?can we eliminateinequitiesin theHow can yourHowsectorreframeusingadistribution of resources and power thatshapehealth outcomes?healthequitylens?How can we reducedisparities in thedistribution of disease andillness?Loans? Investments? Access to capital? Policies?What social programs andservices are needed toaddress health disparities?What types of institutional and social changesare necessary to tackle health inequities?How can individuals protect What kinds of community organizing andthemselves against health alliance building are necessary to protectdisparities?communities?
Life Expectancy at Birth by Gender and Race/Ethnicity, LA County, 2013 Slide 1 79.5 79.0 . Los Angeles County Department of Public Health, Office of Health Assessment & Epidemiology, Mortality in Los Angeles County 2014. Slide 3 . Infant death rate per 1,000 live births 6 4.4 2.5 4.5 10.3 3 Health Inequities by Race/Ethnicity,