Transcription
849International Journal of Scientific & Engineering Research, Volume 5, Issue 5, May-2014ISSN 2229-5518Power System Security AnalysisB. Rajanarayan Prusty, Bhagabati Prasad Pattnaik, Prakash Kumar Pandey, A. Sai SantoshAbstract: In this paper real time security analysis is carried out. First contingency selection is performed by calculating two kinds ofperformance indices. They are active power index (PIP) and reactive power index (PI V). MATLAB programming code is written toobtain the solution of load flow equations using Newton Raphson (NR) iterative method algorithm. The iterative method uses theelements of the bus admittance matrix (YBUS). The MATLAB code for YBUS is written using the algorithm of singular transformationmethod. Finally the performance indices are calculated for contingency ranking. The effectiveness of the methods has been testedon an IEEE 25 Bus, 35 Line test system.Index Terms – Security analysis, performance index, contingency selection, contingency ——————1 INTRODUCTION2 CONTINGENCY ANALYSISPower system security is one of the challengingtasks for the power system engineers. This securityassessment is essential as it gives the knowledge ofthe system state in the event of contingency.Contingency analysis technique is being widelyused to predict the effect of outages like failure ofpower system components such as generator,transformer, transmission line etc, and to takenecessary action to keep the power system secureand reliable. Use of offline analysis to predict theeffect of individual contingency is a tedious task asa power system contains large number ofcomponents. Practically, only selected contingencieswill lead to severe conditions in power system. Theprocess of identifying severe contingencies isreferred as contingency selection and this can bedone by calculating performance indices for eachtype of contingency. In this paper contingenciessuch as single transmission line and doubletransmission line outages are considered.Contingency analysis avoids system troubles beforethey occur by studying the outage events andalerting the operators to any potential over loads orserious voltage violations. The major components ofcontingency analysis �——B. Rajanarayan Prusty is Assistant Professor, Department of Electrical andElectronics Engineering, National Institute of Science and Technology,Odisha, India, Ph-9861845744. E-mail: openeye.engg@gmail.comBhagabati Prasad Pattnaik is Assistant Professor, Department of Electricaland Electronics Engineering, National Institute of Science and Technology,Odisha, India, Ph-7377630437. E-mail: klikbp@gmail.comPrakash Kumar Pandey, Department of Electrical and ElectronicsEngineering, National Institute of Science and Technology, Odisha, India,Ph-9438487014. E-mail: prakashkumarp00@gmail.comA. Sai Santosh, Department of Electrical and Electronics Engineering,National Institute of Science and Technology, Odisha, India, Ph9040234311. E-mail: arjasantosh7@gmail.com2.1 Contingency DefinitionContingency definition involves preparing a list ofprobable contingencies.2.2 Contingency RankingContingency Ranking in descending order isobtained according to the value of a scalar index,normally called as severity index or performanceindex (PI). PI is calculated using the conventionalload flow algorithm for individual contingency inoff line mode. Based on the values obtainedcontingencies are ranked in a manner where highestvalue of PI is ranked first. There are basically twotypes of performance indices that are of great use.These are active power index PIP and reactive powerindex PIV. PIP indicates violation of line activepower flow whereas PIV indicates bus voltagemagnitude violation. PIP can be calculated using(1)where(2)where L Total number of transmission linespresent in the systemPi Active power flow in line iPimax maximum active power flow in line iIJSER 2014http://www.ijser.org
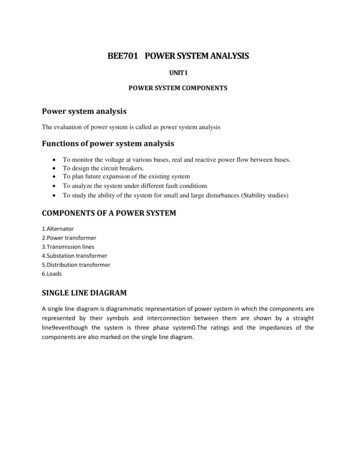
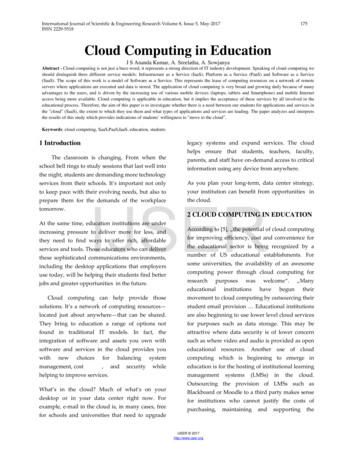
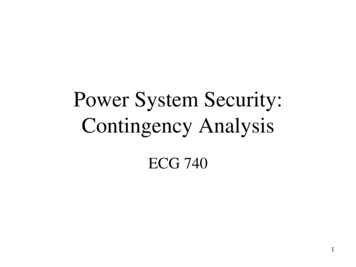
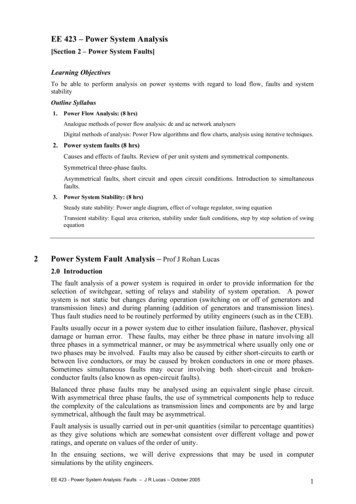
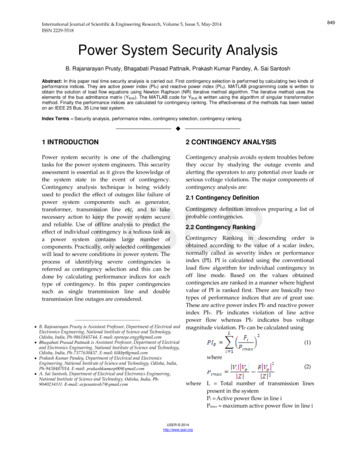
International Journal of Scientific & Engineering Research, Volume 5, Issue 5, May-2014ISSN 2229-5518Z Impedance of the line connecting busesi and pR Resistance of the line connecting buses iand pThe second performance index PIV can be calculatedusing(3)where n Total number of buses present in thesystemm Total number of PV buses present inthe systemn-m-1 Total number of load buses presentin the systemVi Voltage of bus i after load flowVinom Nominal voltage at bus-i. Generallyassumed as 1 puVimin Minimum voltage limit. Generallyassumed as 95% of Vinom.Vimax Maximum voltage limit. Generallyassumed as 105% of Vinom.Fig.1. Single line diagram of the system under study.The system as shown in Fig. 1 consists of a slack busnumbered 1, 4 PV buses numbered from busnumber 2 to 5 and remaining 20 are load buses. Thesystem has total number of 35 transmission linesconnected between various buses. Load flow iscarried out using NR iterative method which acts asthe steady state data. Load flow is again carried outafter each contingency case which is referred as thepost contingency data. Using equations (1) and (3)the performance indices are calculated. The graph ofthe system under study is as shown in Fig. 2 and itwill be useful while developing YBUS matrix usingsingular transformation method.IJSER2.3 Contingency SelectionContingency selection process consists of selectingthe set of most probable contingencies in; they needto be evaluated in terms of potential risk to thesystem.2.4 Contingency evaluationFinally, the selected contingencies are ranked inorder of their severity, till no violation of operatinglimits is observed.3 RESULT AND DISCUSSIONIn this paper the main focus is to performcontingency ranking by determining performanceindices i.e. PIP and PIV values. Severe contingency isthe case with highest value of performance index.Computation of these indices is done with help ofNR iterative method under MATLAB environment.Pre and post contingency voltages at various busesare determined. For the contingency analysis anIEEE 25 bus, 35 line system is considered whose busand line data are detailed in Appendix-A. Thesingle line diagram of the system is as shown in Fig.1.Fig. 2. Graph of the system under study.35 single line outage contingency cases areconsidered and first 10 severity cases are tabulatedboth for %PIP and %PIV in Table-1 and Table-2respectively.IJSER 2014http://www.ijser.org850
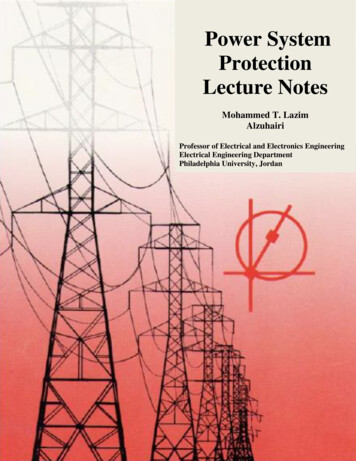
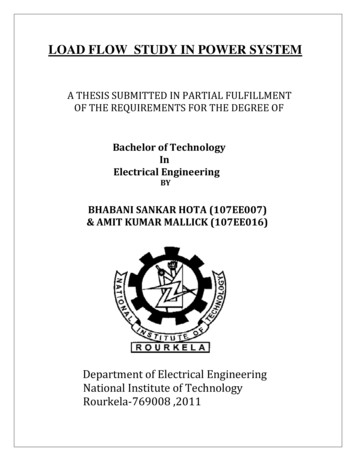
International Journal of Scientific & Engineering Research, Volume 5, Issue 5, May-2014ISSN 2229-5518TABLE 3DOUBLE LINE OUTAGE TABLE FOR %PIPTABLE 1SINGLE LINE OUTAGE TABLE FOR %PIPIn Table-1 and Table-2 contingency number 15 and6 respectively are the most severity cases. They areranked 1 in the tables and are highlighted.TABLE 4DOUBLE LINE OUTAGE TABLE FOR %PIVIJSERTABLE 2SINGLE LINE OUTAGE TABLE FOR %PIVSimilarly 595 double line outage contingency casesare considered and first 10 severity cases aretabulated both for %PIP and %PIV in Table-3 andTable-4 respectively.In Table-3 and Table-4 contingency number 222 and100 respectively are the most severity cases. Theyare ranked 1 in the tables and are highlighted.IJSER 2014http://www.ijser.org851
International Journal of Scientific & Engineering Research, Volume 5, Issue 5, May-2014ISSN 2229-55184 CONCLUSIONIn this paper contingency selection and contingencyranking are made by calculating two importantperformance indices such as active powerperformance index (PIP) and reactive powerperformance index (PIV). These two indices werecalculated for an IEEE 25 bus, 35 line test system.The severity of contingency cases such as single lineoutage and double line outage is accuratelyindicated by the numerical values of PIP and PIVrespectively. The indices are calculated in off linemanner for a single loading condition. From theresults obtained it can be concluded that thecalculation of performance indices gives a goodmeasure about the severity of all the possible linecontingencies occurring in the system. The indiceswith higher value reflect a severe case which has thehighest potential to make the system parameters togo beyond their permissible limits.REFERENCES[1][2][3][4][5][6]IJSERJohn J. Grainger, William D. Stevenson Jr., PowerSystem Analysis, McGraw-Hill, Inc., ISBN-0-07113338-0.Jena D, Prusty B.R, Power System Analysis:Operationand Control, I.K.InternationalPublishing House Pvt. Ltd., New Delhi, ISBN –9789382332497.Stott B, Alsac O and Monticelli A.J, “SecurityAnalysis and Optimization”, Proc. IEEE, vol.75, No.12, pp. 1623-1644, Dec 1987.Stott B and Alsac O, “Fast Decouple Load Flow”,IEEE Transactions on Power Apparatus andSystems, Vol. PAS-91, No.5, pp. 859-869, May 1974.Ejebe G. C and Wollenberg B.F, “AutomaticContingency Selection”, IEEE Transactions onPower Apparatus and Systems, Vol. PAS-91, N0.1,pp. 97-109, January 1979.Niebur D. And Germond A.J., “Power System StaticSecurity Assessment using the Kohenen NeuralNetwork Classifier”, IEEE Transactions on PowerSystems, Vol. 7, No. 2, pp. 865-872, May 1992.IJSER 2014http://www.ijser.org852
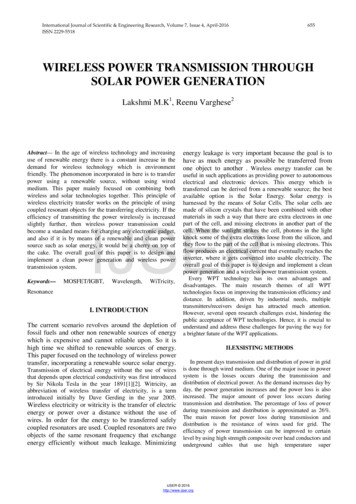
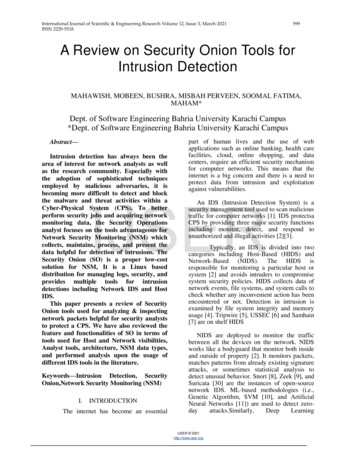
International Journal of Scientific & Engineering Research, Volume 5, Issue 5, May-2014ISSN 2229-5518APPENDIX – ATable A.1: Bus data of IEEE 25 bus, 35 line SystemTable A.2: Line data of IEEE 25 bus, 35 line systemIJSERIJSER 2014http://www.ijser.org853
International Journal of Scientific & Engineering Research, Volume 5, Issue 5, May-2014 ISSN 2229-5518 IJSER 2014 http://www.ijser.org Power System Security Analysis