Transcription
Lands and Lamoreaux Nutrition & Metabolism 2012, 9/1/46RESEARCHOpen AccessUsing 3–6 differences in essential fatty acidsrather than 3/6 ratios gives useful food balancescoresBill Lands1* and Etienne Lamoreaux2AbstractBackground: The vitamin-like omega-3 and omega-6 essential fatty acids are converted in the body to a largefamily of hormones which act at selective receptors that occur on nearly every cell and tissue. A relative omega-3deficit allows overabundant actions of omega-6 hormones to develop into health disorders. People need simple,explicit information on the balance of essential fatty acids in their foods to avoid accumulating unintendedimbalances in their tissue omega-3 and omega-6 fatty acids.Results: We developed an Omega 3–6 Balance Food Score that summarizes in a single value the balance amongeleven omega-3 and omega-6 essential fatty acids in a food. The value allows a quantitative estimate of the impactof each food item on the proportions of omega-3 and omega-6 that will accumulate in the 20- and 22-carbonhighly unsaturated fatty acids of blood, which is an important health risk assessment biomarker.Conclusions: The impact of an individual food item upon a useful health risk assessment biomarker is easilyevident in a simple, explicit value for the balance among eleven essential fatty acids nutrients. Foods with morepositive Omega 3–6 Balance Food Scores will increase the percent of omega-3 in the biomarker, whereas thosewith more negative Scores will increase the percent of omega-6 in the biomarker.Keywords: Arachidonic cascade, Calories, Cardiovascular, Essential fatty acids, Health risk assessment, Highlyunsaturated, Inflammatory, Omega-3, Omega-6, PolyunsaturatedBackgroundEighteen years after the initial discovery that omega-3 andomega-6 essential fatty acids form a large family of hormones, the 1982 Nobel Prize in Physiology or Medicinerecognized the importance of those hormones. The omega3 and omega-6 forms compete with each other during themetabolic steps by which they accumulate in our tissues.Once there, they act differently in selectively forminghormones that act selectively on receptors which arepresent on nearly every cell and tissue in the body [1]. Thepharmaceutical industry has invested billions of dollars todevelop and market treatment agents that suppress excessive formation and action of the hormones formed fromthe omega-6 arachidonic acid by the “arachidonate cascade”. Those omega-6 hormones mediate many signs and* Correspondence: wemlands@att.net1Retired, Fellow of ASN, 6100 Westchester Park Drive, Apt.1219, College Park,MD 20740, USAFull list of author information is available at the end of the articlesymptoms of diverse chronic diseases and disorders. Incontrast, essential omega-3 fatty acids may have beneficialactions in part by a preventive displacing competition withthe omega-6 compounds [2-4].Biomedical knowledge provides two major ways todecrease health-related problems from overabundantactions of the “arachidonate cascade”: (a) informed nutrition choices that prevent imbalances from developing intodisease and (b) pharmaceutical treatments that lower thedisease signs and symptoms caused by such nutrientimbalances. To help consumers make better nutritionalchoices, food marketers provide “Nutrient Facts” labels toinform the public of the kilocalories of metabolic energyin carbohydrate, protein and fat as well as the essentialnutrients and vitamins in a defined “serving” of the fooditem. In addition, people need explicit information toavoid accumulating unintended imbalances in their tissueomega-3 and omega-6 fatty acids. This report describes asimple new measure of nutrient balance that predicts a 2012 Lands and Lamoreaux; licensee BioMed Central Ltd. This is an Open Access article distributed under the terms of theCreative Commons Attribution License (http://creativecommons.org/licenses/by/2.0), which permits unrestricted use,distribution, and reproduction in any medium, provided the original work is properly cited.
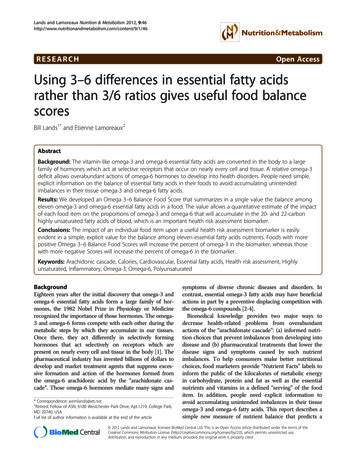
Lands and Lamoreaux Nutrition & Metabolism 2012, 9/1/46Page 2 of 7food’s ability to prevent omega-3 imbalances in our tissuesand allows informed personal food choices.Early diet-tissue quantitationDietary 18-carbon polyunsaturated fatty acids (PUFA)maintain the proportions of 20- and 22-carbon highlyunsaturated fatty acid (HUFA) hormone precursors thatare accumulated in tissues. Knowing this metabolic interaction gives insight for a preventive nutrition strategybased on the health risk assessment biomarker, the%n-6in tissue HUFA (Equation 1). The interactions of dietaryomega-3 (n-3) and omega-6 (n-3) PUFA first reported byMohrhauer and Holman [5,6].Equation 1. Describing the% n-6 in tissue HUFA.% n 6 in HUFA ¼100 ½n 6HUFA ½n 3HUFA þ n 6HUFA þ n 9HUFA ð1Þwere confirmed with a quantitative empirical relationship that fit competitive hyperbolic interactions whichmaintain the% n-6 in tissue HUFA of laboratory rats [7].The simple hyperbolic relationship for the interactionsof dietary PUFA was then extended to describe the combined impact of the daily percent of food energy (en%)in dietary PUFA and HUFA on the accumulated proportions of omega-3 and omega-6 in tissue HUFA of rats,mice and humans [8]; see Equation 4 in Methods.When more quantitative dietary data with humansbecame available, three of the eight constants were revisedslightly to give a better fit with all of the combined results[4,9]. The empirical equation and constants reliably usedaily nutrient intakes (as en%) to estimate quantitativelythe likely% n-6 in HUFA maintained in plasma, red cellsand whole blood [10-12]. A literature search and analysis[13] showed that Equation 4 estimates with a correlationcoefficient of 0.73 (P 0.0000) the observed tissue HUFAproportions maintained by daily en% intakes for 92 subjectgroups in 34 different published studies.During the past decade, Equation 4 was put into a smallspreadsheet [14] for planning and evaluating new dietaryinterventions. It was also put into an interactive personalizedmenu planning software, KIM-2 [15], to help individualsmake informed choices using the nutrient data for thousands of food items that are listed in the USDA NutrientDatabase [16]. The software manages eleven 18-, 20- and22-carbon omega-3 and omega-6 acids in four categories:omega-6 PUFA (“short 6”; 18:2 and 18:3), omega-3 PUFA(“short 3”; 18:3 and 18:4), omega-6 HUFA (“long 6”; 20:3,20:4, 22:4 and 22:5) and omega-3 HUFA (“long 3”: 20:5, 22:5and 22:6). As noted in the Methods section, the softwaresums the milligrams of these four categories of essential fattyacid in all food items for a selected daily menu plan andexpresses the daily intake of the categories as a percent ofoverall daily food energy (en%). It then combines daily en%values with Equation 4 to estimate a likely value for thehealth risk assessment marker, the% n-6 in blood HUFA.Although the estimates of daily food impacts are successful [13], people find it tiresome to calculate all of theen% values for a full day’s menu when they only want tolearn the impact of an individual food. As a result, wesought a new way to estimate a food’s impact by converting the balance among the milligrams per calorie of elevendietary 18-, 20-. and 22-carbon omega-3 and omega-6acids into a single value for each food item. This newapproach to balance uses arithmetic differences of (n-3) (n-6) rather than ratios of (n-3)/(n-6).ResultsDifferences between short- and long-chain acidsRecognizing that many researchers have found that dietaryHUFA affect tissue HUFA proportions more than dietaryPUFA do, we first sought an empirical scaling factor thatwould allow Equation 2 to give daily menu balance valuesover a range from approximately 10 to 10.Daily menu balance ¼ ðen% short3 en% short6Þþ ðfactorÞ ðen% long3 en% long6Þð2ÞUsing daily en% values from 48 very different dailymenu plans like those stored in the KIM-2 software [15],we found that a value of 7 fit that goal. With this factor,we saw daily menu balance values calculated from en%values in the diverse menu plans correlated well with thevalues for the blood biomarker,% n-6 in HUFA, estimated by the KIM-2 software (Figure 1). The 4.6 valueof the slope of the correlation indicates that each integermore positive in the average daily menu balance valuegives about a 5% higher proportion of omega-3 in bloodHUFA. In this context, the proportions of 30 to 40% n-6in HUFAassociated with eating traditional Japanesefoods (that have an average daily menu balance near 1)are lower than the 60% n-6 in HUFA associated with anaverage Mediterranean diet that has an average daily balance near 3 (Figure 2). The very wide range of ethnicfood habits worldwide maintains average daily menu balance values that range from 3 to 8. That diversity intypical daily foods causes the wide range of HUFA proportions (28% to 88% n-6 in HUFA) that has beenreported for different populations [3,13,17-19].Shifting from daily balance to a food item’s balanceTo generate an Omega 3–6 Balance Score for each individual food item, we replaced the dimension of the dailyen% [100 (total mg) (.009Cal/mg)/(total Cal)] used in
Lands and Lamoreaux Nutrition & Metabolism 2012, 9/1/46aPage 3 of 7b90% 6inH -4.57xBal 46802R 0.95 802R 0.95605040-66050403030202010-2 0-470%n-3 in HUFA%n-6 in HUFA70-10 -890% 3inH 4.57xBal 542468-10 -810daily menu balance-6-410-2 0246810daily menu balanceFigure 1 Relationship of daily menu balance to the software-estimated HUFA proportions. (a) %omega-3 in tissue HUFA 4.57 dailymenu balance 54; (b) %omega-6 in tissue HUFA 4.57 daily menu balance 46.almost all due to the impact of food oils that havebeen added to the fish or seafood items. The negativevalues for canned tuna in vegetable oil ( 9), tuna salad( 16) and fried breaded shrimp ( 11) are circled inFigure 3c. The overall average Omega 3–6 Balance Scorefor all 5,100 food items is about 5.A closer look at the frequency of 669 Food Scoresfor vegetables (Figure 3a) shows hundreds of vegetableitems have Scores near zero (e.g., cabbage, potatoes,onions). Again, the negative scores for cole slaw ( 13),potato salad ( 21) and sautéed onions ( 31) reflect theimpact of food oils that have been added to the vegetableitems. Calorie-weighted average scores are analogous toen% values in daily menu plans in the existing interactiveKIM-2 software [15]. When many different food items arecombined on a calorie-weighted basis to form an averagedaily menu balance from the diverse positive and negativeEquation 2 with the closely-related dimension of mg/Calfor each food item as shown in Equation 3.Omega 3 6 Balance Score¼ ðmg short3 mg short6Þ Cal þ 7 ðmg long3 mg long6Þ Calð3ÞThe resulting Score characterizes the balance of essential fatty acids in each food item independent ofany other foods that might be eaten during the day.Table 1 shows that the average Scores for the twentyfour different food groups used by the USDA Nutrient Database SR24 [16] ranged from 21 to 30.While the average Score for fruits and vegetables isnear zero, it is very negative for the fats and oilsgroup and very positive for the fish and seafoodgroup. In fact, negative Scores in the latter group areDiverse Food Habits and Tissue mproEui teodnmpalanalio nd itt raennpadMeJaJaeGrAverage daily menu balance 3 2 10-1-2-3-4-5-6-7-8Related %omega3 in HUFA72% 67% 62% 57% 52% 47% 42% 37% 32% 27% 22% 17% 12%Related %omega6 in HUFA28% 33% 38% 43% 48% 53% 58% 63% 68% 73% 78% 83% 88%Figure 2 Diversity in daily food habits causes diverse consequences for blood HUFA proportions.
Lands and Lamoreaux Nutrition & Metabolism 2012, 9/1/46Page 4 of 7Table 1 Average Omega 3–6 Balance Food Scores(overall avg. 5; n 5,108)USDA Food GroupOmega 3–6 Balance(n items in group)(average value)Cereals, Grains & Pasta (n 159)-3Breakfast Cereals (n 291)-3Baked Products (n 410)-6Vegetables (n 669)-2Fruits & Fruit Juices (n 286)-1Dairy & Egg Products (n 189)-2Poultry Products (n 204)- 11Pork Products (n 193)-7Beef Products (n 388)-3Lamb, Veal, & Game (n 196)-5Sausages & Lunch Meats (n 210)-7Legumes (n 192)-9Fish & Seafoods (n 151) 30Nuts & Seeds (n 133)- 18Fats & Oils (n 194)- 21Soups, Sauces, & Gravies (n 200)-5Snacks (n 126)- 12Fast Foods (n 261)-8Meals & Entrees (n 28)-5Restaurant Foods (n 52) 12Sweets (n 147)-3Beverages (n 99)-1Spices & Herbs (n 48)-2Baby Foods (n 324)-6Scores, the result is an average daily value between 10and 10. Calorie-weighted average scores are related toen% values in daily menu plans of the existing interactive KIM-2 software [15]. Typical current Americanfood choices have average values around 6 to 7.Inspection of the Scores in Figure 3 readily identifiesfoods that can combine to make a daily average morenegative or more positive.DiscussionThe wide impact on health of a relative omega-3 deficitreflects the multiple actions of selective hormone receptors which respond differently to n-3 and n-6 hormones[1]. As a result, unintended dietary imbalances that causeimbalance among tissue precursors of hormone actionshave selective effects on nearly every cell and tissue in thehuman body and influence many aspects of human physiology and pathology [18]. The list of health problemsrelated to omega-3 deficits with elevated proportions ofomega-6 in the hormone precursors has grown to includeatherosclerosis, thrombosis [19], arrhythmia, heart attacks,stroke, immune-inflammatory disorders, asthma, arthritis,cancer proliferation [18], obesity [20], psychiatric disorders, depression, suicide, homicide [21,22], oppositionalbehavior, unproductive workplace behaviors, length of stayin hospitals [23] and annual healthcare claim costs [24].Health risk assessment (HRA) with a simple low-costfinger-tip blood sample [10-12] informs individuals oftheir personal essential fatty acid status. Such test resultsrelate quantitatively to the risk for cardiovascular mortality (death 3 (%n-6 in HUFA) - 75; [17]). The biomarker value of the% n-6 in HUFA links the balance ofn-3 and n-6 acids in daily foods to the risk of manyaspects of immune-inflammatory and cardiovascular disease [17,18].The associated health claim costs for disorders linkedto omega-3 deficits [18-24] are predictably less as peoplevoluntarily choose foods that lower their HRA valuefrom its current USA average level near 80% n-6 inHUFA to a lower value near 60%. Figure 2 illustratesthat such a lowering represents changing the averagedaily Omega 3–6 Balance Food Score from 7 to 3.Figure 3A illustrates that a majority of vegetables haveScores more positive than the typical daily Americanaverage balance near 6 or 7.The Omega 3–6 Balance Scores rapidly and easily identify food items that can move a person’s daily averageFood Score from 7 to 3 or to an even more positivevalue. For example, combining a tablespoon of flaxmeal( 32) with a half cup of oatmeal ( 4) or adding flax oil( 46) to canola oil ( 11) helps maintain a more positiveoverall food balance. Similarly, peanut butter ( 24) withadded flax meal and oil has a more positive score. Consumers can readily see that eating farmed ( 28) or wild( 73) grilled salmon can do much to providing a morepositive overall daily food balance.The ease with which Omega 3–6 Scores help interpretthe impact of foods is illustrated with the top 100 foodsfrom a USDA Key Foods list [25] based on NHANES2007–08 intake data [26]. The un-weighted average Scoreof the 100 items is about 6, equivalent to an HRA valueof 78% n-6 in HUFA (commonly reported for Americans).None of the 100 items was a seafood. When the ten mostnegative food items are removed, the un-weighted averageScore of the remaining 90 items is about 3, equivalent toan HRA value of 60% n-6 in HUFA (commonly associatedwith a Mediterranean diet). Traditional Mediterraneanfoods do not include the ten items removed: soybean oil,-50; mayonnaise, -46; tub margarine, -39; microwave popcorn, -37; “Italian” salad dressing, -35; potato chips, -29;stick margarine, -28; vegetable shortening, -28; peanutbutter, -24; tortilla chip snacks, -24. However, they do include some seafood items that would move the daily overall average to values more positive than 3.
Lands and Lamoreaux Nutrition & Metabolism 2012, 9/1/46Page 5 of 7Figure 3 Diversity in Omega 3–6 Balance Food Scores. The ordinate axis notes the frequencies of occurrence for food items with variousOmega 3–6. Balance Food Score values indicated on the abscissa for vegetables (a), legumes (b), fish and seafood (c), fats and oils (d).
Lands and Lamoreaux Nutrition & Metabolism 2012, 9/1/46The rise in dietary omega-6 intake caused by added foodoils in USA food supplies during the 20th century [27] hasbeen associated with a rise in the prevalence of manychronic disorders. As a result, much discussion nowaddresses dietary approaches that can lower the preventablerisk for these serious health problems. Recent comments[28] have emphasized the need to account fully for all n-3and n-6 dietary intakes to avoid mis-interpreting the outcomes from large clinical trials.Until now, concerns over unwanted balances amongn-3 and n-6 essential fatty acids have often addressedthe concept of n-3/n-6 ratios without providing an explicit estimate of how such ratios of fatty acids in foodsquantitatively impact the balance of HUFA accumulatedin tissues. We believe that the new explicit Omega 3–6Balance Food Scores can help people easily identify andmake informed food choices that lower their personalhealth risk assessment biomarker value.Limitations of diet and risk assessmentAttempts to describe quantitative abundances of nutrientsin foods eaten are confounded by varietal and seasonal differences in nutrient composition, imprecise recall of quantities eaten and highly diverse intakes in meals from day-today and week-to-week. Nevertheless, estimates are usefulfor predicting how the amounts of vitamin-like n-3 and n-6nutrients in our food [16] affect average proportions of n-3and n-6 hormone precursors accumulated in our body [13].Quantitative descriptions of accumulated n-3 and n-6 hormone precursors are confounded by diverse modes ofrecording and reporting tissue composition [12]. Finally, relating relative tissue abundances to receptor-mediatedhealth outcomes is confounded by diverse biomarkers usedto characterize health risk. Biomarkers that are only predictive of harm and are not factors mediating harm havedistracted attention and resources away from decreasingpreventable mediators during primary prevention [24,29].The earlier developed interactive planning tool, KIM-2,successfully links key variables for a single day’s intake.However, some people want only to consider the impactof a single food in overall health conditions. Omega 3–6Balance Scores were developed as a tool for them to evaluate a single food independent of any other food that maybe eaten. Calorie-weighted average scores for a day’s combined food are analogous to en% values in daily menuplans of the existing interactive KIM-2 software. Figure 1shows how a day’s calorie-weighted average score predictsPredicted % n 6 in HUFA ¼Page 6 of 7the likely%n-6 in HUFA using 46–4.57 calorie-weightedaverage. Thus, the 3–6 differences among essential fattyacids (rather than 3/6 ratios) give a useful tool to use indiscussing a food’s contribution to health.ConclusionsA simple, explicit description of the different abundances of all n-3 and n-6 nutrients in a food makes theirimpact on an important health risk assessment biomarker easily evident. Eating foods with more positiveOmega 3–6 Balance Food Scores increases the estimatedpercent of omega-3 in tissue HUFA, whereas foods withmore negative Scores increase the omega-6 percent.MethodsDifferences for short- and long-chain acidsWe used the interactive menu planning software, KIM-2(which contains data from the USDA Nutrient DatabaseSR15) to design 48 very different individual daily menuplans that fit different lifestyles and daily energy requirements. The food choices in each plan were estimated togive health risk assessment biomarker values that rangedfrom 15%n-6 in HUFA to 89%n-6 in HUFA. The KIM-2software groups eleven 18-, 20- and 22-carbon omega-3and omega-6 acids into four categories: omega-6 PUFA(“short 6”; “P6”; 18:2 and 18:3), omega-3 PUFA (“short3”; “P3”; 18:3 and 18:4), omega-6 HUFA (“long 6”; “H6”;20:3, 20:4, 22:4 and 22:5) and omega-3 HUFA (“long 3”:“H3”; 20:5, 22:5 and 22:6). It sums the milligrams ofthese four categories of fatty acid for all food items ineach daily menu plan and expresses the sum as a percentof overall daily food energy (en%). It then uses the dailyen% values with Equation 4 [9] to estimate a likely valuefor the health risk assessment biomarker,% n-6 in bloodHUFA. The constants currently used with Equation 4are: HC3 3.0, HC6 0.70, PC3 0.0555, PC6 0.0441,HI3 0.005, CO 5.0, Ks 0.175.Equation 4 Estimating the%n-6 in HUFA predictedfrom en% of dietary n-3 and n-6 acids.The daily en% values for the four categories in the 48 different menu plans were alternatively combined inEquation 2 to allow trial-and-error tests that empiricallydetermined that a factor of 7 gives average daily menuscores that range approximately from 10 to 10. Figure 1shows the relationship between the average daily menuscore when en% values were used with 7 in Equation 2compared to the resultant health risk assessment1001 þ ðHC6 en%H6 Þð1 þ en%H3 HC3 Þþ1001 þ ðPC6 en%P6 Þð1 þ en%P3 PC3 þ en%H3 HI3 þ en%O Co þ en%P6 KsÞð4Þ
Lands and Lamoreaux Nutrition & Metabolism 2012, 9/1/46Page 7 of 7biomarker,% n-6 in blood HUFA, when en% values wereused in Equation 4 by the KIM-2 software.3.4.Calculating a food item’s omega 3–6 balance5.Data from the USDA Nutrient Database SR24 [16] wereentered into FileMaker Pro 11, and 5,100 food itemswere selected from the initial 13,200 items by deletingredundant servings and examples of brain tissue or rawmeats not likely to be widely eaten. Omega 3–6 BalanceScores were calculated using Equation 3. Some of themore recent data in the USDA Nutrient Database identify specific fatty acids rather than designating a peak as“undifferentiated”. Specific acid values were used whenavailable, otherwise the “undifferentiated” value wasused. The resulting 5,100 Omega 3–6 Balance FoodScores were grouped into the twenty four USDA-definedfood groups that had average Scores ranging from 21to 30, as shown in Table 1. Data sets of all the FoodScores supporting the results of this article are availableas searchable pdf files in a repository of Omega 3–6Balance Food Scores posted at http://www.fastlearner.org/Omega3-6Balance.htm. The Omega 3–6 BalanceScores can be downloaded as a free “app” for mobiledevices from http://www.fastlearner.org/Omega3-6BalanceApp.htm to help guide personal food choices whenshopping or preparing meals.AbbreviationsHRA: Health risk assessment; HUFA: Highly unsaturated fatty acid;n-3: Omega-3; n-6: Omega-6; PUFA: Polyunsaturated fatty acid.Competing interestsThe authors declare that they have no competing interests.Authors’ contributionsBL developed the text and equations, and EL developed the software forKIM-2 and the calculations described in this manuscript. Both authors readand approved the final manuscript.AcknowledgementThe authors thank Joanne Holden and David Haytowitz for providing a list ofthe top 100 foods from the Key Foods list based on NHANES 2007–08 intakedata and Joseph Hibbeln for interpreting information on the many disordersrelated to omega-3 deficits.Author details1Retired, Fellow of ASN, 6100 Westchester Park Drive, Apt.1219, College Park,MD 20740, USA. 2Computer Specialist, NIAAA, NIH, 5635 Fishers Lane,Bethesda, MD 20892-8304, USA.Received: 18 March 2012 Accepted: 9 May 2012Published: 24 May 2012References1. Wada M, DeLong CJ, Hong YH, Rieke CJ, Song I, Sidhu RS, Yuan C, WarnockM, Schmaier AH, Yokoyama C, Smyth EM, Wilson SJ, FitzGerald GA, GaravitoRM, Sui DX, Regan JW, Smith WL: Enzymes and receptors of prostaglandinpathways with arachidonic acid-derived versus eicosapentaenoic acidderived substrates and products. J Biol Chem 2007, 282(31):22254–22266.2. Culp BR, Lands WEM, Lucchesi BR, Pitt B, Romson J: The effect of dietarysupplementation of fish oil on experimental myocardial infarction.Prostaglandins 1980, 19.20.21.22.23.24.25.26.27.28.29.Lands WEM: Biosynthesis of Prostaglandins. Ann Rev Nutr 1991, 11:41–60.Lands WEM: Functional foods in primary prevention or nutraceuticals insecondary prevention? Current Topics in Nutraceutical Research 2003, 1(2):113–120.Mohrhauer H, Holman RT: The effect of dose level of essential fatty acidsupon fatty acid composition of the rat liver. J Lipid Res 1963, 4:151–159.Mohrhauer H, Holman RT: Effect of linolenic acid upon the metabolism oflinoleic acid. J Nutr 1963, 81:67–74.Lands WEM, Morris AJ, Libelt B: Quantitative effects of dietarypolyunsaturated fats on the composition of fatty acids in rat tissues.Lipids 1990, 25:505–516.Lands WEM, Libelt B, Morris A, Kramer NC, Prewitt TE, Bowen P, SchmeisserD, Davidson MH, Burns JH: Maintenance of lower proportions of n-6eicosanoid precursors in phospholipids of human plasma in response toadded dietary n-3 fatty acids. Biochem Biophys Acta 1992, 1180:147–162.Empirical relationship: rk KD: The percentage of n-3 highly unsaturated fatty acids in total HUFAas a biomarker for omega-3 fatty acid status in tissues. Lipids 2008, 43:45–53.Metherel AH, Armstrong JM, Patterson AC, Stark KD: Assessment of bloodmeasures of n-3 polyunsaturated fatty acids with acute fish oilsupplementation and washout in men and women. Prostaglandins LeukotEssent Fatty Acids 2009, 81(1):23–29.Lands B: Measuring blood fatty acids as a surrogate indicator forcoronary heart disease risk in population studies. World Rev Nutr Diet2009, 100:22–34.Strandjord SE, Lands B, Hibbeln JR: Validation of an equation predictinghighly unsaturated fatty acid compositions of human blood fractionsfrom dietary intake. Submitted to Nutrition and Metabolism.Small spreadsheet calculator: Download site for KIM-2: [http://efaeducation.nih.gov/sig/kim.html]USDA Nutrient Database: ds WEM: Diets could prevent many diseases. Lipids 2003, 38(4):317–321.Lands WEM: Fish, Omega-3 and Human Health. 2nd edition. AOCS Press:Champaign; 2005.Lands B: A critique of paradoxes in current advice on dietary lipids. ProgLipid Res 2008, 47(2):77–106.Alvheim AR, Malde MK, Osei-Hyiaman D, Hong Lin Y, Pawlosky RJ, Madsen L,Kristiansen K, Frøyland L, Hibbeln JR: Dietary Linoleic Acid Elevates Endogenous2-AG and Anandamide and Induces Obesity. Obesity (Silver Spring) 2012,doi:10.1038/oby.2012.38. [Epub ahead of print] PubMed PMID: 22334255.Hibbeln JR, Nieminen LR, Blasbalg TL, Riggs JA, Lands WE: Healthy intakesof n-3 and n-6 fatty acids: estimations considering worldwide diversity.Am J Clin Nutr 2006, 83(6 Suppl):1483S–1493S.Freeman MP, Hibbeln JR, Wisner KL, Davis JM, Mischoulon D, Peet M, KeckPE Jr, Marangell LB, Richardson AJ, Lake J, Stoll AL: Omega-3 fatty acids:evidence basis for treatment and future research in psychiatry. J ClinPsychiatry 2006, 67(12):1954–1967.Wei C, Hua J, Bin C, Klassen K: Impact of lipid emulsion containing fish oilon outcomes of surgical patients: systematic review of randomizedcontrolled trials from Europe and Asia. Nutrition 2010, 26(5):474–81.Lands B: Prevent the cause, not just the symptoms. Prostaglandins OtherLipid Mediat 2011, 96:90–93.Haytowitz DB: List of Key Foods Based on NHANES 2007–08. 2012 500/Data/KeyFoods/Keyfoods 0708.xlsx]]NHANES 2007–2008: anes07 08.htm]Blasbalg TL, Hibbeln JR, Ramsden CE, Majchrzak SF, Rawlings RR: Changesin consumption of omega-3 and omega-6 fatty acids in the UnitedStates during the 20th century. Am J Clin Nutr 2011, 93(5):950–962.Ramsden CE, Hibbeln JR, Majchrzak SF, Davis JM: n-6 fatty acid-specific andmixed polyunsaturate dietary interventions have different effects onCHD risk: a meta-analysis of randomised controlled trials. Br J Nutr 2010,104(11):1586–1600.Lands B: Planning primary prevention of coronary disease. Curr AtherosclerRep 2009, 11(4):272–280.doi:10.1186/1743-7075-9-46Cite this article as: Lands and Lamoreaux: Using 3–6 differences inessential fatty acids rather than 3/6 ratios gives useful food balancescores. Nutrition & Metabolism 2012 9:46.
Using 3-6 differences in essential fatty acids rather than 3/6 ratios gives useful food balance scores Bill Lands1* and Etienne Lamoreaux2 Abstract Background: The vitamin-like omega-3 and omega-6 essential fatty acids are converted in the body to a large family of hormones which act at selective receptors that occur on nearly every cell and .