Transcription
Welcome
#TC18How to Lie With StatisticsDavid SigersonSolutions ConsultantTableau
Key TakeawayUnderstand how statistics affect our decision makingEngage with the numbers all around us
Who Am I?
Why Am I Here?
Who Are You?andWhy Are You Here?
This Talk Inspired By
AgendaWhat’s the problem? Is there a problem?How can we “lie” with stats?VisualisationsPsychologyCalculationsData collectionWhere do we go from here?Summary
AgendaWhat’s the problem? Is there a problem?How can we “lie” with stats?VisualisationsPsychologyCalculationsData collectionWhere do we go from here?Summary
Truth isn’t truthRudy Giuliani
Voted #1presentation!
80% wouldwatch again!
4 out of 5 women wouldrecommend to a friend
Chair of the UK Statistics Authority,Sir David NorgroveBig Red busThis confuses gross and net contributions.It is a clear misuse of official statistics
Often, We Don’t Notice Being Lied To
AgendaWhat’s the problem? Is there a problem?How can we “lie” with stats?VisualisationsPsychologyCalculationsData collectionWhere do we go from here?Summary
Pre-Attentive Visual Attributes
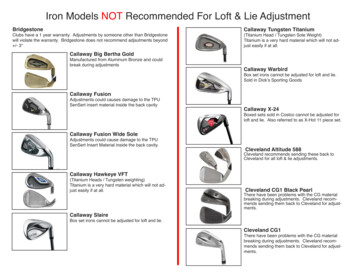
The 3D Pie
Verna 56,486http://chandoo.org/wp/2013/04/12/why-3d-pie/
es-and-the-ipad/
The Picture Always Wins
AgendaWhat’s the problem? Is there a problem?How can we “lie” with stats?VisualisationsPsychologyCalculationsData collectionWhere do we go from here?Summary
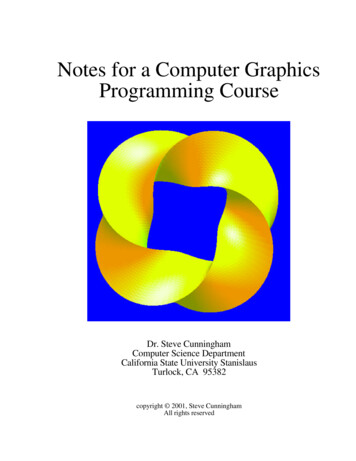
What’s More Likely?Linda is 31 years old, single,outspoken, and very bright. Shemajored in philosophy. As a student,she was deeply concerned with issuesof discrimination and social justice,and also participated in anti-nucleardemonstrations. Which is moreprobable?Linda is a bank teller.Linda is a bank teller and is activein the feminist movement.
Bias: Anchoring
Anchoring Is All Around Us
Bias: Framing
FramingPositive FrameThe product has been proveneffective in 80% cases75% lean meat9/10 customers fully satisfied 10 discount on a new phoneGym membership 1.37 per dayNegative FrameThe product has failed to work on2 out of every 10 cases25% fat meat10% of our customer not fullysatisfiedAvoid 10 surcharge on newphoneGym membership 500 per year
AgendaWhat’s the problem? Is there a problem?How can we “lie” with stats?VisualisationsPsychologyCalculationsData collectionWhere do we go from here?Summary
Mean, Median and ModeMeanSum([Sales]) / Number of RecordsMedianMid value of your ranked data
Mean, Median and ModeMedian–great for hiding inequalitiesMean–great for making things seem better or worse if you haveinequality in the data
SalariesWhat’s the average increase of salary over two periods of 100% and -50%?50% 25% 0%
Percentages & The Credit CardYou’ve got 10000 on a credit card with 20% APR, how much before itdoubles? (assuming you don’t pay anything back?)How long before it quadruples?
Pig In A /
AgendaWhat’s the problem? Is there a problem?How can we “lie” with stats?VisualisationsPsychologyCalculationsData collectionWhere do we go from here?Summary
Data Collection: Surveys
What should mynext play be?
Questionnaires – Measurement Error“Is Nick Foles too short to play quarterback?”(leading, anchoring)“Did Nick Foles miss too many chances to be mainquarterback” (Leading)“Where does Nick Foles enjoy drinking beer?”(loaded question)“Do you believe Nick Foles always give 110%?”(jargon / lacking clarity)
Data Collection:Confidence in the Data?
Always Think About Data You Don’t Have Extrapolation / Interpolation / Over-fitting
Data Collection: CorrelationsHappen All The Time
Data Collection: MachineLearning & AI
Data Bias And Selection IssuesImpacts AI/ML as much as human analysts, surveys etc.
AgendaWhat’s the problem? Is there a problem?How can we “lie” with stats?VisualisationsPsychologyCalculationsData collectionWhere do we go from here?Summary
Statistics in the Media(and even in most supposedly “data driven” orgs)NarrativeAssemble yourdata
Statistics in “Data Science” And Big Data WorldAssembleyour dataNarrative
Chocolate & The Misleading MediaJournalist – John Bohannon (Ph.D inmolecular biology of bacteria)Gunter Frank – GP (added“authority”)5 men, 11 women – aged19-67Recruited people via Facebook for150 EurosLooked for correlations in the datasetThe International Archives ofMedicine – pub BioMedCentralInstitute of Diet and HealthThe networks pick it up
Where Statistics Really Add ValueHypothesis/ Ideas /BeliefsAssembleyour dataThe Tableau impactTest thehell out ofit / PeerreviewNarrative
Sharing And Collaboration
Eyeballing The Data
Auto Recommendations“Wisdom of the crowds”
Trusting Experts, References
Empowering People To Question Things
Community Feedback
AgendaWhat’s the problem? Is there a problem?How can we “lie” with stats?VisualisationsPsychologyCalculationsData collectionWhere do we go from here?Summary
We Are The Problem, Not The MathTake responsibilityAcknowledge caveman but move beyondAlways add context to your numbersDemocratise the process for fact checking – let others help you!
If You Want To Use Statistics To Lie Show things too-good-to-betrue, people want to believe!Don’t back up your claimswith referencesBad visualsConfuse with percentagesExtrapolate!Use small inappropriate samplesSlanted questions/bad data collectionCorrelate! Correlate! Correlate!Dress up in a doctors coat
Understand how statisticsaffect our decision makingEngage with the numbers allaround us
Coda:Stay Alert For Manipulation
100,000’s of CustomersLove Tableau
Please complete thesession survey from the Session Details screenin your TC18 appMost people score the session “5”But if they could, they’d score it 1000 .Did you “consciously” read this slide?
#TC18Thank you!dsigerson@tableau.comDavid Sigerson, Tableau UK
If You Want To Use Statistics To Lie Show things too-good-to-be true, people want to believe! Don't back up your claims with references Bad visuals Confuse with percentages Extrapolate! Use small inappropriate samples Slanted questions/bad data collection Correlate! Correlate! Correlate! Dress up in a doctors coat