Transcription
South AfricaCountry Operational Plan 2017 (COP17)Strategic Direction Summary (SDS)Final Approved COP17 draft 18 May 2017
Contents1.Goal Statement . 42.Epidemic, Response, and Program Context . 52.1 Summary Statistics, Disease Burden, and Country Profile.52.2 Investment Profile .152.3 National Sustainability Profile Update .212.4 Alignment of PEPFAR Investments Geographically to Disease Burden .222.5 Stakeholder Engagement.243.Geographic and Population Prioritization . 244.Program Activities for Epidemic Control in Scale-up Locations and Populations . 284.1 Targets for Priority Locations and Populations .284.2 Priority Population Prevention and KP Prevention .434.3 VMMC .444.4 PMTCT .464.5 HTS .484.6 Facility-and community-based care and support .504.7 Family Planning/HIV Integration .514.8 TB/HIV .524.9 Adult Treatment .544.10 Pediatric Treatment .564.11 OVC .584.12 Addressing COP17 Technical Considerations.594.13 Commodities .624.14 Collaboration, Integration and Monitoring .625. Program Activities in Sustained Support Locations and Populations . 636. Program Support Necessary to Achieve Sustained Epidemic Control . 646.1 Critical Systems Investments for Achieving Key Programmatic Gaps .646.2 Critical Systems Investments for Achieving Priority Policies .667. Staffing Plan . 67APPENDIX A . 68A.1 and A.2 Sub National Unit (SNU) Prioritization .68APPENDIX B . 72B.1 COP17 Planned Spending in 2017 .72APPENDIX C . 74Section 6.0 Tables: Program Support Necessary to Achieve Sustained Epidemic Control .742 Page
3 Page
1. Goal StatementIn support of the new 2017-2022 South Africa National Strategic Plan for HIV, Tuberculosis (TB),and Sexually Transmitted Infections (STIs) 1 (NSP), the United States (U.S.) through thePresident’s Emergency Plan for AIDS Relief (PEPFAR) Country Operational Plan 2017 (COP17) willimplement a strategic portfolio of programs aimed at epidemic control. During COP17, PEPFAR2will prioritize South Africa’s (SA’s) 27 highest HIV burden districts—accounting for 82% of SA’sestimated people living with HIV (PLHIV). PEPFAR support to the national HIV program iscoordinated under the SA and U.S. governments’ Partnership Framework Implementation Plan(PFIP). In partnership with the government of South Africa (GoSA) and development partners,PEPFAR will disrupt HIV transmission by prioritizing HIV prevention, orphans and vulnerablechildren (OVC), services for adolescent girls and young women (AGYW), scaling-up saturation ofvoluntary medical male circumcision (VMMC) for men (15-39 years), and reaching the JointUnited Nations Program on HIV/AIDS (UNAIDS) 90-90-90 targets and beyond, especially inpriority sex/age bands (women 15-25; men 20-30). In COP17, PEPFAR will work to achieve fullattainment3 in six of the 27 focus districts and saturation4 of 90-90-90 in the remaining 21 districtsby September 20185. Through its TB/HIV interventions, PEPFAR will also support SA’s nationalTB program.PEPFAR supports the national rollout of Universal Test and Treat (UTT) and same-day initiation,6and new and efficient service delivery models aligned with the National Department of Health(NDoH) HIV Testing Services (HTS) and Adherence Policy and Guidelines. In order to achieveCOP17’s ambitious targets, PEPFAR will scale-up direct service delivery support to sites andaccelerate health systems strengthening initiatives, including those focused-on health financing,Human Resources for Health (HRH), information systems, laboratory services, quality of servicedelivery, and supply chain. The GoSA and PEPFAR will continue to innovatively use and sharedata to adaptively manage the HIV response, in collaboration with civil society, faith-basedorganizations (FBO) and implementing partners.In COP17 PEPFAR SA inputs will focus on:1The NSP was developed through a robust consultative and data-driven approach.PEPFAR is implemented in South Africa by several U.S. government agencies: Department of State,Agency for International Development (USAID); HHS/Centers for Disease Control (CDC); HHS/Health andHuman Services Administration (HRSA); Peace Corps; and Department of Defence.3Attainment is defined as sub national units (districts) that have achieved / 81% Antiretroviral Treatment(ART) coverage among both males, and females in the following age bands: (1) 15 years, (2) 15-24 years, and(3) 25 years.4Saturation is defined as sub-national units (districts) that have achieved the / 81% ART coverage for thePLHIV population overall.5COP17 implementation will begin October 2017 and end in September 2018.6UTT and same-day initiation policy launched in September 2016.24 Page
Dramatically improving linkage to treatment and retention in care to above 90%;Reaching more than 2 million people with new and efficient service delivery models (e.g.,Adherence Clubs, Centralized Chronic Medicine Dispensing and Distribution);Layering and integrating combination prevention interventions to protect AGYW andmarginalized populations in the highest-burden districts, including greater integration ofinterventions implemented under DREAMS;7 andAccelerating testing, VMMC, and HIV treatment for men.2. Epidemic, Response, and Program Context2.1 Summary Statistics, Disease Burden, and Country ProfileSA is an upper-middle income country with significant influence in the sub-Saharan Africanregion. SA’s economy is one of the largest in sub-Saharan Africa, and its pluralistic makeup whichencompasses a wide variety of cultures, languages, races, and religions, largely shaping its healthprofile. The population is estimated at 55.91 million, with approximately 51% (28.53 million) beingfemale. Life expectancy at birth is estimated to be 62.4 years (65.1 years for females; 59.7 years formales) while the infant mortality rate is 33.7 per 1,000 live births. 8In 2016, the HIV disease burden is estimated to have increased, with an estimated 7,104,706PLHIV.9 The majority (55-60%) of HIV-infected adults are women. Black women aged 25-34 yearshave the highest prevalence at 31.6%, and highest incidence, at 4.54 percent.10South Africa’s HIV epidemic is largely driven by heterosexual transmission, with underlyingbehavioral, socio-cultural, economic, and structural factors influencing HIV transmission risk.These factors include population mobility and migration; economic and educational status;alcohol and drug use; early sexual debut; sexual and gender-based violence (GBV); low prevalenceof male circumcision; lack of knowledge of HIV status; intergenerational sex; multiple andconcurrent sexual partners; discrimination and stigmatization; inconsistent condom use,especially in longer-term relationships and during pregnancy/post-partum; and gender dynamics,including unequal power relations between men and women.7DREAMS is the Determined, Resilient, Empowered, AIDS-free, Mentored and Safe Initiative for HIVPrevention among AGYW launched by GoSA and PEPFAR in 2015, with full implementation begun in April2016.8Statistics South Africa [StatsSA], Mid-year population estimates, 2016. Statistical Release P0302, Statistics,South Africa: Pretoria.9Comprising: 351,025 children less than 15 years; 5,758,182 adults between 15-49 years; and, 995,589 adults50 years and older. Source: Johnson LF, et al. (2016) Prospects for HIV control in South Africa: a modelbased analysis. Global Health, Action. 9: 30314.10Shisana, O, Rehle, T, Simbayi LC, Zuma, K, Jooste, S, Zungu N, Labadarios, D, Onoya, D et al. (2014) SouthAfrican National HIV Prevalence, Incidence and Behaviour Survey, 2012. Cape Town, HSRC Press.5 Page
The GoSA-led current progress towards epidemic control includes a targeted HTS program, whichhas resulted in 3.8 million people on antiretroviral treatment (ART), including 171,536 children( 15 years) and 3,636,076 adults (1,206,080 males and 2,429,996 females, 15 years).11 South Africaaccounts for the largest national treatment program in the world, although with the recentlyadopted universal ART eligibility, overall treatment coverage is only 53.6% (48.9% for children;47.5% for adult males; and 57.7% for adult females).12 With respect to VMMC, it is estimated that47.5% of males aged 15 years will be circumcised in 2016.13 In 2016, progress was made with theadoption of UTT, same-day initiation, differentiated service delivery, including the establishmentof centralized chronic medicines dispensing and distribution (CCMDD) models as vehiclestowards universal access to ART and multi-month Antiretroviral (ARV) supply, and pre-exposureprophylaxis (PrEP) targeted at key population groups. Additionally, in June 2016, the GoSAlaunched She Conquers, a national campaign and strategy for AGYW focusing on five crucialobjectives: (1) reducing HIV incidence; (2) decreasing teenage pregnancy; (3) decreasing GBV; (4)keeping girls in school; and (5) increasing economic empowerment opportunities for girls andyoung women.Major programmatic and system gaps or barriers to achieving epidemic control remain. Thenumber of new HIV infections remains high, with an estimated 266,618 new HIV infections in2016, with these new infections disproportionately higher among AGYW.14 The nexus with the TBepidemic continues to drive high morbidity and mortality, with the legacy of apartheid andsignificant income inequality posing additional challenges to the TB and HIV response.Gross National Income (GNI) per capita is estimated at USD 6,80015. Total health expenditure isestimated to be about 8.93% of the gross domestic product (GDP) with health spending expectedto reach R178 billion (approximately USD 13.7 billion) in 2017/1816. There is clear commitment bythe GoSA to continuously increase budgetary support towards the HIV response. In the 2017budget, an additional R885 million (approximately USD 68 million) was added to support theimplementation of UTT.17HIV prevalence and incidence vary significantly across geographic areas (54% of PLHIV areconcentrated in the Gauteng and KwaZulu-Natal provinces). Tables 2.1.1 and 2.1.2 belowsummarize the key HIV epidemiological data and provide a national view of the 90-90-90cascade.11Johnson LF, et al. (2016) Prospects for HIV control in South Africa: a model-based analysis. Global HealthAction. 9: 30314. The estimation of 3.8 million on ART includes estimations of private health providers ARTclients.12In the work cited (Op. cit.) 1013Op. cit. 714Op. cit. 1015World Bank: World Development Indicators. Online: http://data.worldbank.org/indicator/16Op. cit. 1217National Treasury, 2017 Budget Speech. Online: http://www.treasury.gov.za6 Page
Table 2.1.1 Host Country Government Results 15 yearsTotalNTotalPopulation55,908,900HIVPrevalence (%)AIDSDeaths(per ,491,4532.2%N/AAIDSdeathsin male&femalechildren 15 14,08215-24 yearsFemale%15.2%N5,076,2212.2%N/AN/A%9.1% 25 nfemaleadults 15 JohnsonLF, et al.(2016).Prospectsfor HIVcontrol inSouthAfrica: amodelbasedanalysis.GlobalHealthAction. 9:30314.JohnsonLF, et al.(2016).Prospectsfor HIVcontrol inSouthAfrica: amodel-
15 71,668# PLHIVIncidence Rate(Yr.)8 Page7,104,796N/A1.07%#PLHIVChildren ( 15) 351,0250.49%N/A#PLHIVAdults(15-49) 5,758,182N/AN/A#PLHIVAdults( 50) 995,5892.54%N/Abasedanalysis.GlobalHealthAction. 9:30314.N/A0.55%N/A1.62%1.29%JohnsonLF, et al.(2016).Prospectsfor HIVcontrol inSouthAfrica: amodelbasedanalysis.GlobalHealthAction. 9:30314.Shisana etal. (2014),SouthAfricanNationalHIVPrevalence, IncidenceandBehaviourSurvey,2012
NewInfections (Yr.)266,618AnnualBirths1,198,861100%% ofPregnantWomenwith atleast oneANC visitN/A97%PregnantWomenneedingARVsN/AN/A9 PageN/AN/AN/AN/AN/AN/AJohnsonLF, et al.(2016).Prospectsfor HIVcontrol inSouthAfrica: amodelbasedanalysis.GlobalHealthAction. EmergencyFund(UNICEF),2008
;2,530,000Paternal;820,000DoubleNotifiedTB Cases(Yr.)294,603% of TBcasesthat areHIVinfected157,505% ofMalesCircumcised10 P a g on (WHO)(2016).GlobalTuberculosis Report,2015WHO(2016).GlobalTuberculosis Report,2015Shisana, etal. (2014),SouthAfricanNationalHIVPrevalence, IncidenceandBehaviourSurvey,2012
EstimatedPopulation Size ofMen whohave sexwith men(MSM)*MSM HIVPrevalenceEstimatedPopulation Size ofFemaleSexworkers(FSW)FSW HIVPrevalenceEstimatedPopulation Size ofPeoplewhoinjectdrugs(PWID)11 P a g 57 /ASANAC,2015SANAC,2015
PWIDHIVPrevalence10,598*14.0%Estimated Size ofPriorityPopulations:Military73,104100%Estimated Size sEstimated Size ofPriorityPopulations:BlackAfrican12 P a g e7,530,3198,038,652Scheibe, etal, 2014*Numbercalculatedusingprevalencerate ofScheibe etal appliedto SANACestimatedpopulationsize onestimates,2016
Males 2549 yearsReferencesJohnson LF, et al. (2016) Prospects for HIV control in South Africa: a model-based analysis. Global Health Action. 9: 30314National Treasury, 2017 Budget Speech. Online: www.treasury.gov.zaSANAC Programmatic Mapping and Size Estimation Study of Key Populations in South Africa, 2015 Final Report, October 2015Scheibe, A, Brown, B, dos Santos, M, Rapid assessment of HIV prevalence and HIV-related risks among people who inject drugs in five SouthAfrican cities, draft study report v2, 2014Shisana, O, Rehle, T, Simbayi, LC, Zuma, K, Jooste, S, Zungu, N, Labadarios, D, Onoya, D et al. (2014). South African National HIV Prevalence,Incidence and Behaviour Survey, 2012. Cape Town, HSRC PressSouth African National Defense Force, 2015Statistics South Africa [StatsSA], Mid-year population estimates, 2016. Statistical Release P0302, Statistics South Africa: PretoriaUNAIDS Spectrum Estimates for South Africa 2015. Version 5.4 EPP/Spectrum. ools/spectrumepp; Accessed 01 Mar, 2017UNICEF Antenatal Care Coverage DataWorld Bank: World Development Indicators. Online:http://data.worldbank.org/indicator/World Health Organisation [WHO] (2016). Global Tuberculosis Report, 201513 P a g e
Table 2.1.2 90-90-90 Cascade: HIV Diagnosis, Treatment and Viral Suppression (12 months)TotalpopulationPopulationless than 15yearsPregnantWomenMSMTotalPopulation FSW1.2million –1.425million26153,00028%(rangeof 22%48%)56.0%(rangeof 025HIV Treatment and ViralSuppressionOnRetainViralARTed onSuppress18ART 12ion(#)Month12sMonths(%)(%)213,43774%79%,467HIV Testing and Linkage toARTTestedDiagno Initiatfor HIV sed HIV ed 6%range(19%27.8%)N/A17,881N/AN/AN/A23.6%(range /AN/AN/AN/AN/AN/AN/A247DHIS. Nov 2016 (public sector data)Stats SA, 2016.Shisana, O et al. (2014). South African National HIV Prevalence, Incidence and Behaviour Survey, 2012. Cape Town, HSRC PressAs reported in DATIM222324Figure is for clients aged 15-49 and excludes ANCUNICEF Antenatal Care Coverage DataAs reported in DATIMUSCF. MSM in South Africa: Data Triangulation Project. 201426The South African National Sex Workers HIV Plan 2016-2019. SANAC, 201627IBBS & Konstant 2013 and Stakeholder consensus (Feb 2017) for data for 12 districts (City of Johannesburg Metropolitan Municipality,eThekwini Metropolitan Municipality, City of Cape Town Metropolitan Municipality, City of Tshwane Metropolitan Municipality,Nelson Mandela Bay Municipality, Ehlanzeni District Municipality, Mangaung Metropolitan Municipality, Gert Sibande DistrictMunicipality, uMgungundlovu District Municipality, Capricorn District Municipality, Ngaka Modiri Molema District Municipality,Pixley ka Seme District Municipality)28Petersen, Z et al. Availability of HIV prevention and treatment services for people who inject drugs: findings from 21 countries. HarmReduction Journal 10(1), 2013.29Department of Correctional Services (DCS). Annual Report, 2014. Note: The DCS can house 159,331 inmates at any given time, butdue to overcrowding and rapid turnover of inmates, the annual inmate population is estimated at 322,000.25
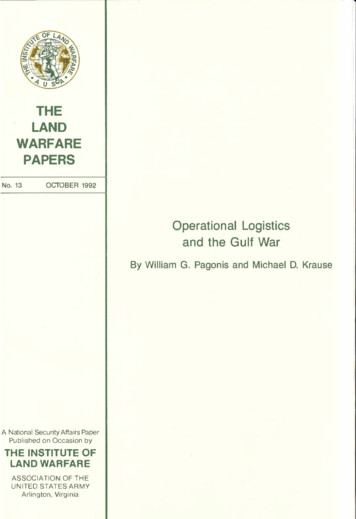
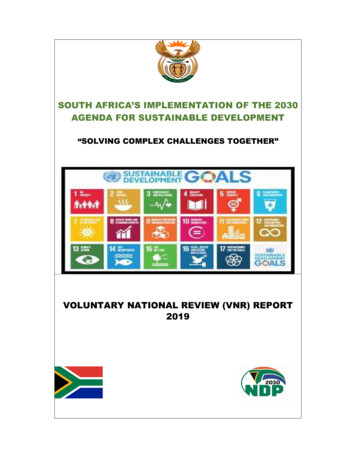
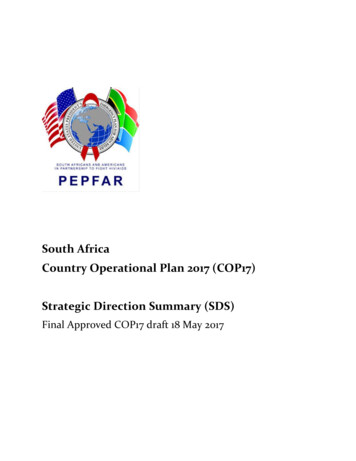
Figure 2.1.3. National and PEPFAR SA Trend for Individuals Currently on .000.002001 2002 2003 2004 2005 2006 2007 2008 2009 2010 2011 2012 2013 2014 2015 2016# People on ART Supported-NDOH# People on ART-NDoH with PEPFAR Support2.2 Investment ProfileThe HIV response in SA is funded through public revenue, external development partners(donors) and the private sector.In 2016/17, the SA HIV response was funded primarily through the GoSA at R17.32 billion (USD 1.31 billion30). PEPFAR was the second largest source of funds, and contributed R5.88 billion(USD 399.75 million XRT31 14.7132). The Global Fund to Fight AIDS, TB and Malaria (The GlobalFund) was the next-largest funding source, and will contribute USD 311.8 million over three yearsin its current funding cycle, 2016-19. The 2013 National AIDS Spending Assessment reported otherexternal sources (bilaterals, multilaterals, and foundations) accounting for about 3% of HIVresponse funding. Private companies and insurance contributed around 8 percent.Within the GoSA response, the NDoH is the largest spender on HIV services, primarily via theconditional grant (R20.5 billion in 2018/19), followed by Department of Social Development (DSD)(R1.8 billion for 2018/19). An additional R1.9 billion is being allocated in 2017/18 and 2018/19 tosupport implementation of the HIV and TB Investment Cases and the new NSP including thecontinued expansion of providing ART to PLHIV. PEPFAR’s anticipated FY2018 HIV funding inSA is R6.28 billion33.Due to the high HIV burden in SA, and the already large number of patients on treatment, HIVcosts are expected to increase over the next decade, primarily driven by ART costs. Modeling30Based on department budgets; 13.2 Exchange RateXRT exchange rate32PEPFAR FY 2016 Expenditure Analysis; 14.71 Exchange Rate33COP 2017; 13 Exchange Rate (USD 483million); USD 51.5 million for VMMC is additive this amount.3115 P a g e
undertaken as part of the SA HIV and TB Investment Case found that maximizing preventionefforts (specifically condom provision, VMMC and social and behavior change communication)were more cost-effective than treatment, and that an approach that combines treatment andprevention is necessary to achieve the 90-90-90 targets. This strategy requires a steadilyincreasing investment in HIV programs to reach 90-90-90. Given SA’s constrained economy, theGoSA has leveled funding for many services, and future rising HIV and TB treatment costs areprojected to consume an increasing share of the health budget.16 P a g e
Table 2.2.1 Investment Profile by Program AreaProgram AreaTotal Expenditure % PEPFAR % GF% Host Country% OtherClinical care, treatment and support 900,111,34414.41%4.10%81.49%N/ACommunity-based care, treatment, and support 122,378,62518.96%2.98%78.06%N/APMTCT 44,320,99043.27%0.00%56.73%N/AHTC 128,789,79551.00%0.00%49.00%N/AVMMC 77,678,18566.37%0.00%33.63%N/AGeneral & Priority population prevention (including condoms) 175,626,41411.24%19.07%69.70%N/AKey population prevention 27,690,18524.57%37.54%37.89%N/AOVC* 71,381,05460.45%0.00%39.55%N/ALaboratory 147,847,2774.88%0.34%94.78%N/ASI, Surveys and Surveillance** 33,139,94769.72%23.52%6.76%N/AHSS** 12,898,07381.16%18.84%0.00%N/AOther: Program Management*** 64,161,1430.00%17.64%82.36%N/AOther: Training/Capacity Building*** 12,504,1350.00%0.00%100.00%N/ATotal 1,818,527,16721.98%5.86%72.16%N/AThere is no information on the Government of South Africa’s Communications, M&E, Other Prevention, Policy and Systems Development spending17 P a g e
and budget allocations because data were unavailable and/or not disaggregated in the Basic Accounting System (BAS); this does not mean that theGoSA is not spending anything on these activities.*The GoSA does not track OVC investments in their basic accounting system. OVC investments in this table include DSD HIV/AIDS investments andDBE life skills education grant. This does not mean the GoSA is not investing in OVC programming in their other departments.**SI and HSS in the PEPFAR expenditure are included across all program areas. The SI and HSS expenditures are not directly allocated to programareas. GoSA HSS funding amount and portion is not available from the (GoSA) Budget Accounting System.***PEPFAR's program management costs and training costs are built into the program areas, whereas associated costs for the GoSA are separated out.Training and capacity building for the GoSA are from the HIV CG for Regional Training Centers.The GoSA figures are based on their departmental budget allocations for FY2016/17 (XRT: 13.2). PEPFAR data are based on FY2016 expenditures. TheGlobal Fund figures come from the final approved PR budgets.The investment profile table is a broad profile of expenditures and budgets for HIV spending in SA, and is not meant to be comprehensive of all HIVexpenditures in SA.18 P a g e
Table 2.2.2 Annual Procurement Profile for Key CommoditiesCommodity CategoryARVsRapid test kitsOther drugsLab reagentsCondomsViral Load commoditiesVMMC kitsOther commoditiesTotal34TotalExpenditure(USD ) 339,524,206 9,669,786 35,036,771 7,008,116 39,595,579 280,655 12,360,457 184,112,247 627,587,81734% PEPFAR% GF% HostCountry% ble 2.2.2 notes: Rapid test kits XRT 13; budget estimate FY2017/18, VMMC kits, Condoms XRT 13.2; FY2016/17, Other drugs & commodities are from FY2014/15.19 P a g e
Table 2.2.3 Annual USG Non-PEPFAR Funded Investments and IntegrationFunding SourceUSAID MCHUSAID TBUSAID MalariaFamily PlanningNIHCDC (Global HealthSecurity)Peace CorpsDoD EbolaMCCTotal20 P a g eTotal USGovernment(USG)Non-PEPFARResourcesN/A 15,000,000Non-PEPFARResources CoFunding PEPFARIMs# CoFundedIMsPEPFAR COP To provide Technical Assistance to theGoSA on TB. USAID received anadditional (one-time) USD 3 million inFY16 to respond to the White HouseNational Action Plan for CombatingMultidrug Resistant TBN/AN/AN/AN/A 2,300,000N/AN/A /AN/AN/A
Table 2.2.4 Annual PEPFAR Non-COP Resources, Central Initiatives, PPP,Operation Plan (HOP)FundingTotalTotal NonTotal# Co- PEPFAR MsDREAMS 6,791,971N/AN/AN/AN/AInnovationVMMC – 51,503,884N/AN/AN/AN/ACentral FundsLCIN/AN/AN/AN/AN/AOther PEPFAR 1,753,327N/AN/AN/AN/ACentralInitiativesOther PublicPrivatePartnership(PPP) 2,500,000Total tivesN/AN/AN/AImplementationScience; SICountry Model;PopARTVMMC and UTTDemand Creationvia AirtimeVoucherMessaging; HCT inPrivate SectorPharmacies;ImprovingManagement andLeadership for theHIV response2.3 National Sustainability Profile UpdateThe GoSA, UNAIDS and the PEPFAR team worked together during COP16 planning to develop adraft 2016 Sustainability Index and Dashboard (SID). The SID was approved by the SA leadership,and has been shared and presented in various stakeholders’ meetings through the PFIP and otherfora including the Health (Development) Partners Forum and SA National AIDS Council(SANAC)’s Civil Society Forum.The SA SID shows sustainable and approaching sustainability elements in each of its fourdomains.35 In COP17, programs will continue that address issues identified in the SID, includingservice delivery; HRH; commodity security and supply chain; quality management; laboratory;epidemiological and health data; policies and governance; and civil society and private sectorengagement.35The four domains of the SID include: Governance, Leadership and Accountability; National HealthSystems and Service Delivery; Strategic Investments, Efficiency and Sustainable Financing; and StrategicInformation.21 P a g e
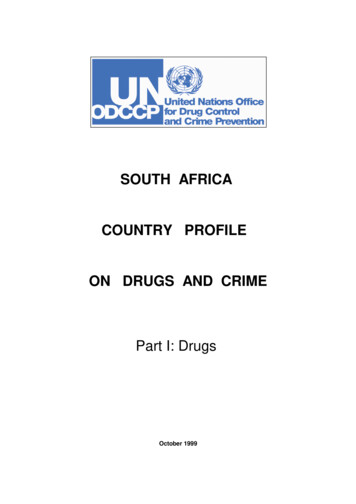
Through increased regular outreach and meetings with stakeholders PEPFAR SA is working withthe GoSA departments and other funders to complement the ongoing, routine sharing ofinformation regarding the various initiatives that support SA’s health and HIV/AIDS programs.362.4 Alignment of PEPFAR Investments Geographically to Disease BurdenFigure 2.4.1 compares PEPFAR expenditure to burden of disease by district (as measured by thenumber of PLHIV). In 2016, the PEPFAR program spent an average expenditure of USD 42.54 perPLHIV. In general, relatively more funds were expended in the urban areas (e.g., Johannesburgand eThekwini) compared with non-urban areas, which may be reflective of the underlyingpopulation size associated with urban-based programs and DREAMS. The GoSA is responsible forthe majority of HIV programs expenditures. Among the 27 focus districts the FY16 expenditureper PLHIV ranged from US 17-US 83. The PEPFAR program has reviewed its availableepidemiological and expenditure data in an effort to focus on programs and locations forincreased impact and
voluntary medical male circumcision (VMMC) for men (15-39 years), and reaching the Joint . 2.1 Summary Statistics, Disease Burden, and Country Profile SA is an upper-middle income country with significant influence in the sub-Saharan African region. SA's economy is one of the largest in sub-Saharan Africa, and its pluralistic makeup which .