Transcription
1RUNNING HEAD: NEURAL CORRELATES OF ENGAGEMENTEEG Correlates of Engagement During AssessmentLaura K. Halderman1, Bridgid Finn1, Nicole M. Long2, J.R. Lockwood1 & Michael J. Kahana21 Educational2 UniversityTesting Serviceof Pennsylvania
NEURAL CORRELATES OF ENGAGEMENT2AbstractIn educational assessment, low engagement is problematic when tests are low-stakes forstudents but have significant consequences for teachers or schools. The current study sought toestablish the electroencephalographic (EEG) correlates of engagement. Forty university studentscompleted a simulated Graduate Record Exam (GRE) session while EEG was recorded from 128channels. Participants completed two verbal and two quantitative GRE test blocks for a total of80 items and rated their engagement or mental effort after each item. High frequency spectralactivity (90-150 Hz) over left temporal cortex during item completion predicted subsequentengagement ratings while controlling for reaction time and accuracy. However, reaction timewas the sole significant predictor for effort ratings. These results suggest high gamma may be acorrelate of engagement during complex cognitive tasks, but not effort. These findings could beused in future studies to measure levels of engagement across different assessment designs.
NEURAL CORRELATES OF ENGAGEMENT3IntroductionStudent Engagement During AssessmentThe impact of student motivation and engagement on academic outcomes has been clearto educational stakeholders for decades (e.g. Meece, Blumenfeld, Hoyle, 1988). Engagement, acomponent of motivation (Skinner & Pitzer, 2012), is a multidimensional construct with variouscharacterizations in the achievement motivation literature (Christenson, Reschly & Wylie, 2012).Engagement can reference a student’s academic engagement over an entire school year or on aparticular academic task. The current study focused on the narrower construct of taskengagement, a person’s active involvement in a task or activity, or in this case, an academicassessment (Reeve, Jang, Carrell, Jeon, & Barch, 2004). Our primary goal was to establishpreliminary evidence that real-time measures of neural activity measured through EEG canprovide a valid indicator of engagement in an academic assessment context.Assessment related activities are integral to instruction and learning, and there are criticalreasons why a more extensive understanding of engagement during assessment is needed.Consider an assessment that has low stakes for students but significant consequences for teachersor schools. Low engagement leads to scores that underestimate the student’s actual abilities,which jeopardizes test validity and can leave academic institutions drawing questionableconclusions about the efficacy of their programs and teaching staff (Brown & Finney, 2011).To date, the two most commonly used indicators of test-taking motivation andengagement are self-report measures and test-timing data (Sundre & Moore, 2002; Wise &DeMars, 2005; Wise, Wise & Bhola, 2006). In general, self-report instruments ask students toindicate their self-perceived level of motivation and engagement for a specific test as a whole
NEURAL CORRELATES OF ENGAGEMENT4and their academic motivation more generally. Test-timing data include the time to complete aquestion or to finish a test, with atypically low values potentially indicating lower studentengagement, effort and motivation. These measures have been the focus of research effortsaimed at identifying methods of minimizing the error introduced by unengaged test takers andimproving the validity of scores.These indirect measures are low cost and easy to collect, but have a number of identifiedlimitations. Self-report methods typically measure engagement retrospectively and at a globaltask level rather than measuring it throughout a task. Some researchers have argued that global,retrospective evaluations can be insensitive to the fluctuations in engagement that occur during atask (Christenson et al., 2012) and amplify particular phases of the experience, such as thebeginning or end (Kahneman, Diener & Schwarz, 1999; Finn, 2010; Finn & Miele, 2015).Furthermore, research has found that global engagement ratings can be subject to response biasesfor instance, providing higher ratings to avoid an anticipated academic penalty (Wise & Kong,2005). Timing information can provide a more fine-grained view of engagement throughout atest, however, timing data alone is not complete enough to draw firm conclusions about astudent’s engagement. For example, rapid responses which are sometimes used as a marker oflow engagement, could indicate a range of states: the student truly was not engaged, they werehurrying to finish given time constraints or they knew they did not know the answer (Metcalfe &Finn, 2008; Schnipke, 1995; Wise & Kong, 2005). To address these limitations, the currentstudy used an item-level self-report method to capture fluctuations in engagement, throughout atesting session. Test-timing data was also collected to provide additional information aboutparticipants’ experiences with items.
NEURAL CORRELATES OF ENGAGEMENT5Combining common engagement indicators with physiological data such as EEG couldprovide a more comprehensive view of test-taker experience. EEG is a useful tool in this contextbecause it is measured passively during a task and provides extremely fine-grained measurement(Luck, 2014). An EEG measure of engagement during the test affords opportunities to explorehow cognitive states change over time, at a fine grain size, and without drawing the participant’sawareness away from the primary task. Moment-by-moment engagement measures might bettercapture the item and overall assessment design features that promote or discourage engagement,which may be increasingly important as assessments move toward using more complex tasks(e.g., simulation and scenario-based tasks) that may invoke a wider variety of cognitive statesduring administration. Academic assessments built upon such designs could provide results thatare more valid for supporting inferences about both individual skills and institutionaleffectiveness. Toward this end, our primary goal was to establish a neural correlate of selfreported engagement at an item level under conditions relevant for academic testing situations.Use of EEG to Measure EngagementThere is only a modest literature on the use of EEG to measure engagement (e.g. Berka etal., 2007; Pope, Bogart & Bartolome, 1995; Freeman, Mikulka, Prinzel & Screbo, 1999;Chaouachi & Frasson, 2010). The majority of the work can be found in the applied, HumanComputer Interaction and attention/vigilance literatures. Engagement measures in these domainstypically involve online cognitive state classification and/or identifying a person’s level ofengagement during a task. Characteristic tasks include visual search paradigms in whichparticipants search for a specific symbol in an array of visual stimuli or maintain vigilance on acentral fixation point. Most of the engagement measures in these domains have typically focused
NEURAL CORRELATES OF ENGAGEMENT6on lower frequencies (i.e. alpha, theta and beta) (Chaouachi & Frasson, 2010, Freeman et al.,1999; Pope, et al., 1995).The nature of engagement measured in attention/vigilance paradigms may be too narrowto capture the kind of engagement that is required when reasoning through complex verbal andquantitative items like those used to assess academic achievement and thus, may not be useful toinform a priori hypotheses about which frequencies might best index engagement in anassessment context. Evidence from cognitive neuroscience has established gamma ( 30 Hz) as acritical frequency band for a variety of cognitive processes including attention (Jensen, Kaiser &Lachaux, 2007), word recognition (Jerbi et al., 2009), auditory processing (Crone, Boatman,Gordon & Hao, 2001), and motor movement (Miller, Shenoy, Miller, Rao & Ojemann, 2007).Most notably, gamma increases are indicative of learning mechanisms, as established throughboth intracranial and scalp EEG (Sederberg, Kahana, Howard, Donner & Madsen, 2003; Gruber,Tsivilis, Montaldi & Müller, 2004; Sederberg et al., 2006; Long, Burke & Kahana, 2014 and seealso Fitzgibbon, Pope, Mackenzie, Clark & Willoughby, 2004). For example, Long et al. (2014)examined the neural correlates of successful memory encoding using intracranial EEGrecordings in neurosurgical patients and scalp EEG recordings in healthy controls. In addition tosignificant theta (3-8 Hz) power modulations, an increase in high gamma power (44 - 100 Hz)was a predictor of successful learning in both participant samples. The researchers concludedthat scalp EEG was capable of resolving high frequency gamma activity that was indicative ofsubsequent memory effects. Thus, gamma may be a useful index of engagement in a taskcontext, which involves higher-level cognitive processes such as problem solving (Blumenfeld,Kempler & Kraicik, 2006).Current Study
NEURAL CORRELATES OF ENGAGEMENT7In the current study, EEG was measured as students completed a simulated session of theGraduate Record Exam (GRE). An engagement rating or mental effort rating was taken aftereach item. Item-level self-report ratings were used in this study as the initial correlate with EEG.A central question was whether changes in particular frequencies during item completion areindicative of whether a person subsequently reports being meaningfully engaged with the task.Mental effort ratings were solicited to evaluate whether the EEG patterns associated with highand low engagement could be distinguished from those associated with high and low effort, astate that has sometimes been conflated with engagement in the literature but many argue is aseparable aspect of test-taking motivation (Chapman, 2003; Skinner & Belmont, 1993).To establish a possible EEG correlate of engagement, we conducted a series of behavioraland EEG analyses. First, we tested the validity of the item level self-report scales. A critical firststep was to demonstrate that the two scales were used distinctly by the participants, which weestablish by verifying that the two scales were differentially related to important test-takingmetrics such as accuracy and response time. This evidence supported the use of the item-levelscales as the foundation for the EEG analyses. Second, we tested whether we could findevidence for an EEG correlate of engagement and effort. Separate correlational analyses wereconducted for each rating type to evaluate the relationship between the ratings and EEG power.Third, we conducted a more stringent test of EEG as a measure of engagement, focusing on highgamma, which demonstrated the strongest correlation with engagement ratings. Mixed effectsordinal modeling was used to evaluate whether EEG provided a meaningful predictor of selfreported engagement while controlling for important behavioral metrics of test-takerengagement.
NEURAL CORRELATES OF ENGAGEMENT8MethodParticipantsForty students (22 female; average age 22.1 years (SD 3.5 years)) at the University ofPennsylvania participated in a 2.5-hour experimental session. Participants were recruited from apool of students who had previously completed experimental sessions in the lab. Participantswere included in the study if they had never practiced or taken the GRE, or took it before 2011when the current, adaptive GRE was introduced. Participants were paid 75 for theirparticipation.Design and MaterialsParticipants completed a simulated GRE session while EEG was recorded.Participants completed two verbal and two quantitative GRE test blocks with 20 items in eachblock. The domain of the first test block was counterbalanced across participants. Materials weretaken from a practice GRE test, which contained a routing block and three second-stage blocks(easy, medium and hard). Performance on the routing block determined a participant’s secondstage block assignment. Table 1 depicts the number of items correct in the routing blockrequired for each second-stage block assignment. Quantitative item types included constructedresponses (numerical solution), standard items with only one correct answer and multipleresponse items, with multiple correct answers. Verbal item types included items with subquestions where each sub-question required an answer, standard items and multiple responseitems.
NEURAL CORRELATES OF ENGAGEMENT9Table 1The Number of Items Correct in the Routing Block Required for Each Second-Stage BlockAssignment.DomainQuantitativeVerbalNumber of Correct ItemsSecond Block Assignment6 or lessEasy7 – 11Medium12 or moreHard6 or lessEasy7 – 12Medium13 or moreHardParticipants rated either their mental effort or engagement after each item on a scale of 1(Low) – 6 (High). Table 2 shows distributions of each rating type. For mental effort, participantswere asked to consider, “How much mental activity was required (e.g. thinking, deciding,calculating, remembering, searching, etc.)? How hard did you have to work to accomplish yourlevel of performance?” For engagement, participants were asked to consider, “How absorbedwere you while you were answering the item? How attentive and involved were you?”
NEURAL CORRELATES OF ENGAGEMENTTable 2Distribution of the number of participant responses for Effort (EFF) and Engagement 8516422169613512951285TotalProcedureThe session began with a brief tutorial with six practice items representing the differentitem types. Each participant completed a total of four blocks of items consisting of a verbalrouting block, a verbal second-stage block, a quantitative routing block, and a quantitativesecond-stage block. Block order was randomly assigned, however, the first verbal orquantitative block was always a routing block because the second-stage block assignmentdepended on the routing block performance. Within each block, items of the same type werepresented together but the different item types appeared in a random order across participants.After each item, an effort or engagement prompt was randomly but equally presented so thatacross a testing session, a participant received an equal number of effort and engagementprompts. This procedure was adopted to reduce fatigue effects and predictability which might10
NEURAL CORRELATES OF ENGAGEMENT11have occurred if participants were asked to rate both effort and engagement after every item.Participants could return to previously answered items and change their answers, however, onlythe first encounter with an item was analyzed. A 10-minute break was given between the secondand third blocks.EEG Data CollectionEEG was recorded using a Geodesic Sensor Net (GSN; Netstation 4.3 acquisitionenvironment, from Electrical Geodesics, Inc.). The GSN provided 129 standardized electrodeplacements across participants. All channels were digitized at a sampling rate of 500 Hz, and thesignal from the caps was amplified via either the Net Amps 200 or 300 amplifier. Recordingswere initially referenced to Cz and later converted to a bipolar reference.EEG Data ProcessingTo control for the variability in response times across quantitative and verbal items andparticipants, all EEG measurements were response-locked to the participant’s first response onan item and included the 20 seconds prior to the response. 19.4% of the total items were omittedfrom the analyses because the response time was less than 20 seconds. Though feelings ofengagement and effort likely vary throughout the course of an item, this approach allowed us tokeep all trials an equal length (20 s) across items and participants.To minimize confounds resulting from volume conduction and saccades, we analyzed thescalp EEG with bipolar referencing (Nunez & Srinivasan, 2006; Kovach et al., 2011) tominimize contribution of eye blinks to the EEG signal, a method used previously to resolve highgamma signals in scalp EEG (Long et al., 2014). We defined the bipolar montage in our datasetbased on the geometry of the scalp EEG electrode arrangements. For each participant andelectrode, we isolated pairs of immediately adjacent electrodes and found the difference in
NEURAL CORRELATES OF ENGAGEMENT12voltage between them (Long et al., 2014). The resulting bipolar signals were treated as newvirtual electrodes and are referred to as such in the remainder of the text.We applied the Morlet wavelet transform (wave number 6) to all bipolar electrode EEGsignals during 20 seconds response-locked epochs, across 52 logarithmically spaced frequencies(2-165 Hz). We included a 1000 ms buffer on both sides of the data to minimize edge effects.After log transforming the power, we down-sampled the data by taking a moving average across100 ms time windows from stimulus onset and sliding the window every 50 ms, resulting in 399total time windows with 200 non-overlapping time windows. Log-transformed power valueswere then Z-transformed to normalize power within participants. Power values were Ztransformed by subtracting the mean and dividing by the standard deviation power which werecalculated across all events and time points for each frequency. We split the Z-transformedpower into seven distinct frequency bands (delta, 2-4 Hz; theta, 4-8 Hz; alpha, 8-12 Hz; beta, 1228 Hz; low gamma, 28-44 Hz; medium gamma, 44-90 Hz; and high gamma, 90-150 Hz; Long etal., 2014), by taking the mean of the Z-transformed power in each frequency band.Using regions defined in previous scalp EEG studies of human memory (Long et al.,2014; Long & Kahana, 2017; Weidemann, Mollison & Kahana, 2009), we focused on six a prioriregions of interest (ROIs). These particular ROIs encompass most of the scalp while reducingthe space to the essential "dimensions", namely left/right, anterior/posterior, superior/inferior.Moreover, by using a priori ROIs that were not defined specifically for this study, we can beconfident that our ROI selection is unbiased. Z-power in each frequency band was averagedacross our six ROIs: left hemisphere (LH) and right hemisphere (RH) frontal, temporal andparietal (Figure 1). This was done for each GRE item. Items with response times less than 20s onthe first encounter were excluded from the analyses. All other items were included.
NEURAL CORRELATES OF ENGAGEMENT13ResultsAn average of 14.7 (SD 3.5) out of 20 questions were answered correctly on thequantitative routing block and 11.0 (SD 3.2) out of 20 questions were answered correctly onthe verbal routing block. Table 3 shows the number of participants routed to the easy, mediumand hard second-stage blocks for each domain. Participants completed each quantitative item inan average of 73.2s (SD 45.9) and each verbal item in 58.2s (SD 40.9).Table 3Number of Participants in Each Second-stage Block AssignmentSecond-Stage 523Distinguishing Engagement from EffortWhile effort (as measured through response time; Wise & DeMars, 2005) is sometimesused as a proxy for engagement, some researchers have argued that engagement and effort aredistinct constructs (e.g. Bloom & Turner, 2001). If they are distinct, and our prompts measurethese constructs accurately, then we expect that participants would differentiate their responsesto the two types of prompts. This should result in the Effort ratings having different properties(e.g., relationships with other variables) than the Engagement ratings. Several analyses wereconducted to probe for such differences. Note that although each participant responded to only
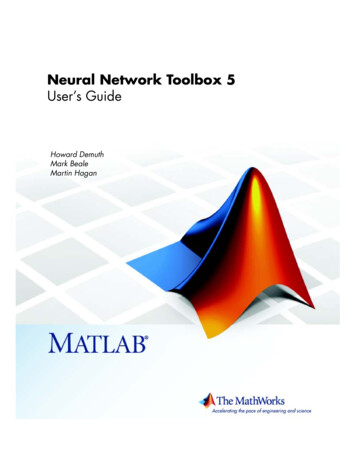
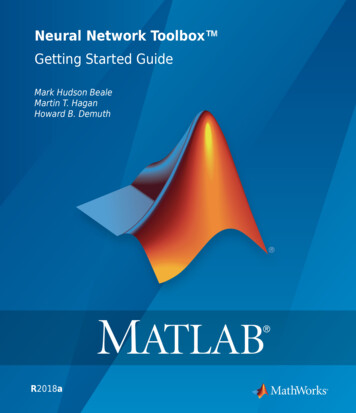
NEURAL CORRELATES OF ENGAGEMENT14one type of prompt for each item, the randomization of the prompt presesentation describedpreviously ensures that neither item nor participant effects confound any observed relationships.First, a linear model for the ratings was fit with three categorical predictors: the ratingtype (2 levels, Effort vs Engagement), participant (40 levels, one per participant) and item. Themodel was then augmented with the interaction of rating type and participant. The modelincluding the interaction was preferred (F 3.48, p .001) suggesting participants weredifferentiating their responses to the two types of prompts.The two types of ratings also related differently to performance. Figure 1 plots percentcorrect as a function of the rating value for each type of rating. Across the rating range, therelationship between Effort ratings and percent correct was effectively flat. Conversely, therewas a strong positive relationship between Engagement ratings and percent correct. Whenparticipants reported having been highly engaged while responding to an item, they were muchmore likely to have answered that item correctly.
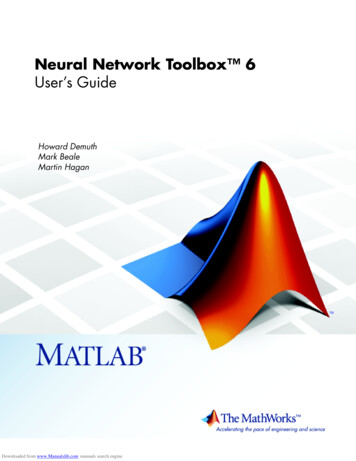
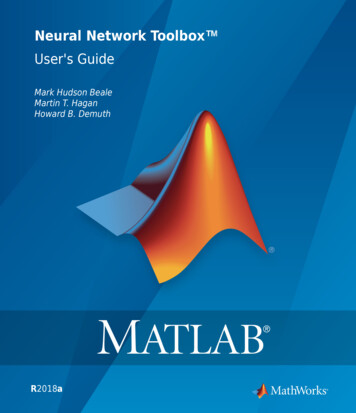
NEURAL CORRELATES OF ENGAGEMENT15Fig. 1.Percentage correct by rating level, for Effort and Engagement ratings.Finally, the two types of ratings also related differently to response time. Figure 2provides boxplots of the natural log of the response time by each rating and rating type. Bothrating types were positively related to response time, but the relationship between Effort ratingsand response time was stronger. One explanation is that response time was a more salient cue forevaluating effort than engagement.
NEURAL CORRELATES OF ENGAGEMENT16Fig. 2.Boxplots of log response time by rating level and rating type.The results collectively support the conclusion that when participants made Engagementand Effort ratings, they were drawing upon different sources of information from theirexperiences with items to make their ratings.Relating Ratings to EEG MeasurementsWe next sought to determine the neural correlates of engagement and effort and to testwhether the two cognitive states showed distinct patterns using neural data. To establish an EEGcorrelate of engagement, we ran correlations between engagement ratings and bipolar Z-
NEURAL CORRELATES OF ENGAGEMENT17transformed log power in seven frequency bands in six scalp ROIs for each participant. Weanalyzed a wide range of frequencies so that the results were not pre-emptively constrained.Once these correlations were computed for each participant, one-tailed t-tests were conducted onthe entire sample to determine whether the average correlations were significantly different fromzero (see Table 4). Bonferroni corrections were used to correct for multiple comparisons. Thecorrelational analyses showed that greater power for low, medium and high gamma frequenciesin the left temporal (LT) and right parietal (RP) electrodes was associated with higherengagement ratings. LT and RP electrodes also had significant positive correlations betweenpower in the beta frequency band and engagement ratings, however, these correlations wereslightly weaker than those observed in the gamma frequency bands.Table 4Average Correlations Between Engagement Ratings and Bipolar Referenced Power in the SevenFrequency Bands in Each of the Six Scalp ROIsLeft HemisphereFrequency BandRight .029.150*.009.009-.009.140*Low Gamma-.009.191*.090.118.017.166*Medium Gamma-.003.192*.087.123.013.169*High Gamma-.008.194*.080.086.019.161*Note. Significant correlations were significant after a Bonferroni correction for 42 comparisons
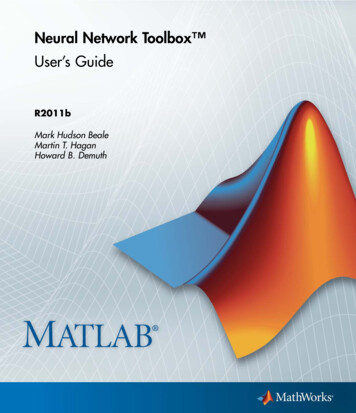
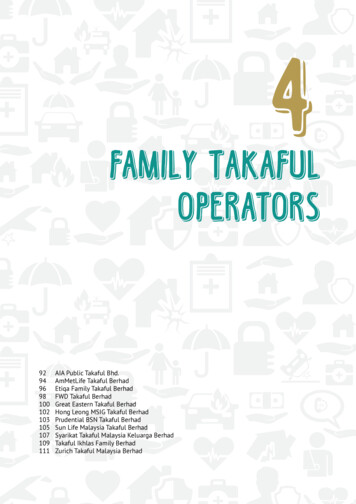
NEURAL CORRELATES OF ENGAGEMENT18* p .0012A 2 (Engagement: High, Low) x 6 (ROI: LH frontal, temporal, parietal; RH frontal,temporal, parietal) x 7 (frequency: delta, theta, alpha, beta, low gamma, medium gamma, highgamma) repeated measures ANOVA was conducted to confirm the pattern established in thecorrelational analysis. Engagement ratings were combined into two categories, high (ratings of 46) and low (ratings of 1-3). The Engagement x ROI x frequency interaction was significant(F(4.26, 166.11) 5.05, MSE .10, p(GG) .001, η2 .12 Greenhouse-Geisser correctionapplied) indicating that both ROI and frequency modulated the engagement effect. Figure 3shows the power for each level of engagement at each ROI location and for each frequency. Inaddition, visual inspection of the confidence intervals for high and low engagement show asimilar pattern to the correlational analysis: greater power differences for high compared to lowengaging items in the LT and RP ROIs for the gamma frequency bands. Power in the betafrequency band was also greater for high compared to low engaging items in the LT and RPROIs.
NEURAL CORRELATES OF ENGAGEMENT19Fig. 3.Means and 95% confidence intervals for high and low engaging items for each ROI and for eachfrequency band.In contrast to engagement ratings, we found no significant correlations between effortratings and power in any of the frequency bands in any of the specified ROIs (see Table 5). Asno significant correlations were observed, the corresponding ANOVA was not computed.Results across analyses provide confirmation that engagement but not effort ratings were relatedto increased power in gamma frequency bands and provide strong support for further explorationof factors that modulate these differences.
NEURAL CORRELATES OF ENGAGEMENT20Table 5Average Correlations Between Effort Ratings and Bipolar Referenced Power in the SevenFrequency Bands in Each of the Six Scalp ROIsLeft HemisphereFrequency BandRight Beta-.012.069.024.026.004.085Low Gamma-.027.072.062.054.001.091Medium Gamma.001.085.096.080.015.098High Gamma.001.073.068.056.009.091Note. No significant correlations remained after a Bonferroni correction for 42 comparisonsOur next goal was to establish a link between EEG signals and self-report measures ofengagement and effort when accounting for behavioral measures typically used to measure thesecognitive states. We focused exclusively on high gamma (90-150 Hz) because it had thestrongest correlation with engagement ratings and the most robust mean differences in theANOVA analysis. We used a mixed effects ordinal model to test whether high gamma activityreliably predicted engagement or effort ratings after controlling for reaction time and accuracy.Modeling engagement and effort ratings. Our model for the ordered categoricalEngagement ratings was a function of: 1) response accuracy; 2) log response time (meancentered across all observations with Engagement ratings); 3) high-gamma activity from the six
NEURAL CORRELATES OF ENGAGEMENT21ROIs entered as six individual variables; 4) random effects for participants; and 5) randomeffects for items. Response accuracy and log response time were included in the model becausethese are traditional proxies for effort and engagement and we were interested in understandingwhat unique contributions the EEG measurements may have for explaining engagement ratings.The random effects were included to account for unobserved participant and item attributes thatare related to the Engagement ratings. We conducted the modeling using the cumulative linkedmixed models routine in the ordinal package (Christensen, 2015) for the R environment as thisroutine can fit cumulative logit models (Agresti, 1990) with cross-classified random effects(Goldstein, 1994; Raudenbush & Bryk, 2002).The results are summarized in Table 6. The relationship for each predictor is presented interms of an odds ratio, and the model was parameterized such that odds ratios greater than 1indicate increased probability of the participant reporting a higher engagement rating on the 1-6ordered rating scale. The odds ratio for item accuracy refers to a question being answeredcorrectly vs incorrectly. The odds ratio for log response time refers to a one unit change in thelog of the response time. The odds ratios for the EEG measurements refer to a one standarddeviation unit change in the scale of the EEG measurement.
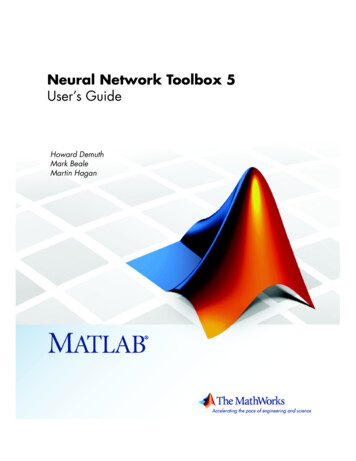
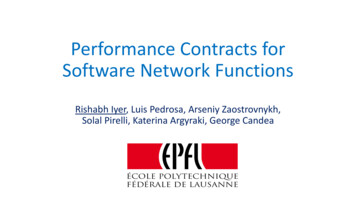
NEURAL CORRELATES OF ENGAGEMENT22Table 6Estimated Odds Ratio from Cumulative Logit Model of Engagement RatingsRegressorOdds Ratio95% C.I.p-valueItem Accuracy1.71(1.35, 2.16)7.19e-06 ***Log Response Time2.32(1.90, 2.83) 2e-16 ***LF High Gamma0.85(0.69, 1.05)0.121RF High Gamma0.92(0.73, 1.18)0.519LT High Gamma1.44(1.17, 1.77)0.00059 ***RT High Gamma1.01(0.83, 1.24)0.896LP High Gamma0.97(0.77, 1.23)0.800RP High Gamma1.02(0.83, 1.26)0.843Note. *** indicates significant p-values.The odds ratio for response accuracy and the log response time indicated that each waspositively associated with higher engagement ratings, consistent with previous results. Theresults further demonstrated that high gamma in LT showed a significant positive relationshipwith the likelihood of reporting higher engagement. Figure 4 provides boxplots of LT highgamma separately for each level of the Engagement rating. The distributions shift upward as therating increased, consistent with the model results. Finally, the finding of a statisticallysignificant positive association between LT high gamma and the engagement rating was robustto several sensitivity analyses, itemized in the supplementary online materials. It is also worthnoting that the model reported in Table 6 was preferred over a simpler alternative that excludedall six high gamma activity terms (LR statistic 28.4 on 6 df, p 8e-5), providing further
NEURAL CORRELATES OF ENGAGEMENT23evidence that high gamma activity provides information about engagement above and beyond thetraditional proxies.Fig. 4.Boxplots of the LT high gamma measurements separately for each level of the Engagement(ENG) rating.We followed a parallel process for the analysis of the Effort ratings to further confirmthat these two states can be differentiated in this dataset. As can be seen in Table 7, responseaccuracy was not a significant predictor of the Effort ratings, whereas the association betweenthe log response time and the Effort ratin
Graduate Record Exam (GRE). An engagement rating or mental effort rating was taken after each item. Item-level self-report ratings were used in this study as the initial correlate with EEG. A central question was whether changes in particular frequencies during item completion are