Transcription
2020Final Report“CCBA made mite count awareness and proficiency a#1 priority in our club. Even new apprentices andmentees received thorough instruction on thedevastation of hives due to Varroa mites. We wantedto contribute to this citizen science project and are soglad that our members participated in this tri-nationaleffort.”- Lauren SmithChester County Beekeepers Association
2020 Mite-A-Thon AnalysisIntroductionFollowing the fourth annual Mite-A-Thon, this document is a report on both the May and August resultsof the Mite-A-Thon 2020, with some brief comparison to previous years. This report attempts to answerthe questions:1) What does the data show us concerning mite levels and participation across North America?2) Did the promotion of two data collection periods lead to increased monitoring over the summermonths?3) Is this a useful project for beekeepers and leadership team partners?4) Is there anything more that should be added to this project in future years?The project was led by the Pollinator Partnership and the North American Pollinator ProtectionCampaign (NAPPC), and funded by following sponsors and leadership team as of September 2020: Almond Board of CaliforniaAmerican Beekeeping FederationAmerican Honey Producers AssociationBee Friendly FarmingBee Informed PartnershipCanadian Honey CouncilDadant*Honey Bee Health CoalitionManitoba Ministry of Agriculture and Resource Development*Michigan State UniversityNAPPCNewfoundland and Labrador Beekeeping Association*Pollinator PartnershipProject Apis m.Saskatchewan Ministry of Agriculture*University of MarylandUniversity of Minnesota Bee Lab and Bee SquadUSDA*New partners in 2021Page 1 of 242020 Mite-A-Thon Analysis as of October 2020 – Pollinator Partnership415.362.1137
BackgroundThe varroa mite, Varroa destructor, is a leading cause of colony mortality in North American honey beecolonies. Honey bees face multiple stressors (pests, pathogens, pesticides, poor nutrition, and weatherextremes). The combined effects might be more damaging than the individual effects of each stressor.Among all those stressors, varroa is arguably the single most important driver of colony mortality. It isboth extremely damaging to the bees and widely spread, detected in over 90% of the colonies sampledby the APHIS National Honey Bee Disease Survey in the US. Varroa is an ectoparasite of the honey beethat was inadvertently introduced into North America 30 years ago from Asia. In addition to the directdamage inflicted from the parasite, mites serve as a vector for a series of viruses. They also cause beesto have a higher risk of infection by compromising their immune systems. There are significant datashowing that low rates of varroa mite infestation make overwintering success more probable. Themanagement of varroa mites implies both the monitoring of load levels in colonies and the use ofcontrol techniques (both prophylactic and therapeutic). However, even the first step, monitoring ofvarroa mite prevalence and load, can be rare in the beekeeping community, resulting in a large portionof beekeepers unaware of the level of infestation present in their colonies.ApproachPollinator Partnership and NAPPC organized the Mite-A-Thon, a citizen science initiative, to promote thepractice of monitoring varroa levels and to gather data on varroa mite infestations across North Americafor all types of beekeepers. The Mite-A-Thon is an intensive outreach effort, this year adding a springeffort to the fall sampling period. Two weeks in early May and two weeks in late August were chosenbecause they represent critical periods for monitoring varroa mites in North America, early in the seasonand just before the start of the overwintering period. Initial iterations only focused on the period beforeoverwintering, while this year’s approach emphasized learning monitoring techniques early andmonitoring throughout the summer. The first Mite-A-Thon took place in 2017 (September 9 to 16), andwas repeated in 2018 (September 8 to 22) with the addition of a second week so that beekeepersaffected hurricanes along the Atlantic coast could participate. Previously, in 2019 (September 7-21), asecond week had been added so that beekeepers attending Apimondia could participate. In addition tothe intensive outreach during the Mite-A-Thon, an online tool allowing the entry of varroa monitoringresults (www.mitecheck.com) is available year-round. The website also allows the public to view adynamic, county level map displaying the highest mite counts reported.In both periods of 2020 (spring and fall), Participants were encouraged to test the level of mites in theircolonies via standardized protocol utilizing two common methods of assessment (alcohol wash orpowdered sugar roll) and then to upload their data (www.mitecheck.com). Uploads included data onlocation, total number of colonies, number of colonies tested, management methods that have beenused and that are being considered, and number of varroa mites counted from each colony.Page 2 of 242020 Mite-A-Thon Analysis as of October 2020 – Pollinator Partnership415.362.1137
Commercial, sideliner, and hobbyist beekeepers were all encouraged to participate in order to create arich distribution of sampling sites in Canada, Mexico, and the United States. To this end, all partnerorganizations participated in outreach across North America. The following partner outreach initiativeswere conducted in 2020 (partial list):PartnersAlmond Board of CaliforniaAmerican Beekeeping FederationAmerican Honey ProducersAssociationBee Culture MagazineBee Friendly FarmingBee Informed PartnershipCanadian Honey CouncilHoney Bee Health CoalitionMichigan State UniversityPollinator PartnershipProject Apis m.University of MarylandUniversity of Minnesota Bee Lab andBee SquadOutreach InitiativesPublicized in weekly newsletterEmailed reminder to members, newsletter articlesPromoted in 2 of their bi-monthly member emailsFeatured on Beekeeping Today podcastPublicized in monthly newsletterPromoted on BIP website, MiteCheck website, MiteCheckapp, and social media postsPromoted to membersPublicized in special edition newslettersPromoted in talks to local beekeeping clubs, promoted onsocial media, publicized in Michigan beekeeper newsletterFeatured on website homepage, promoted Mite Mondays onsocial media, publicized in monthly newsletters, semiannualnewsletter and Mite Monday Mailchimp emails to MATaudience, emailed all beekeepers and beekeepingorganization contacts, created Spanish outreach materialsand reached out to Mexican contacts. Made French outreachmaterials available on website. Gave talks to beekeepingorganizations.Featured in a special eNews bulletin that was picked up bythe American Bee Journal and sent to their mailing list aswell, Promoted in social media postsPromoted in social media postsPromoted in social media postsIn addition to general outreach, 2020 was the second year of the Mite-A-Thon Giveaway. An additionalsurvey was open during each two-week period for officers of beekeeping organizations to submitadditional data on their club’s participation and educational efforts surrounding the event. Two of theseentries were chosen to win 100 Dadant gift certificates to thank them for their participation and toencourage others to strive for greater participation in the future.Page 3 of 242020 Mite-A-Thon Analysis as of October 2020 – Pollinator Partnership415.362.1137
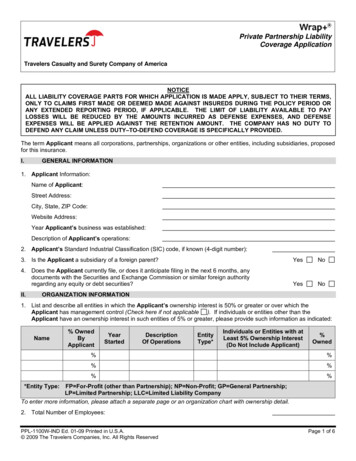
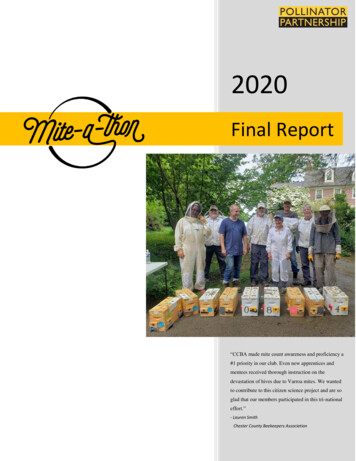
ObjectivesThe primary objectives for this annual project are 1) to teach effective varroa mite monitoring methodsand encourage testing and 2) to make management strategies available for discussion within beeorganizations utilizing Mite-A-Thon partner-developed information and outreach materials.Giveaway ResultsThe second year of the giveaway was a success, with Chester County Beekeepers Association (CCBA) inPennsylvania and Long Beach Beekeepers in California selected as winners.CCBA focused on providing thorough monitoring instruction for all club members, including expertlectures during their virtual zoom meetings. They also provided testing kits to all of their members, andencouraged enough monitoring to boost Pennsylvania into being the state with the most participation.Lauren Helfgott, CCBA Education Committee Lead, added:CCBA made mite count awareness and proficiency a #1 priority in our club. Even newapprentices and mentees received thorough instruction on the devastation of hives due toVarroa mites. We wanted to contribute to this citizen science project and are so glad that ourmembers participated in this tri-national effort.Photos from Chester County Beekeepers AssociationPage 4 of 242020 Mite-A-Thon Analysis as of October 2020 – Pollinator Partnership415.362.1137
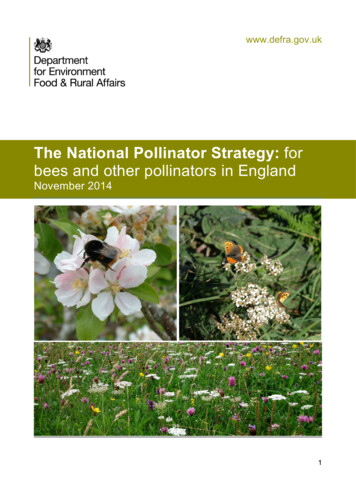
Photos from Chester County Beekeepers AssociationPage 5 of 242020 Mite-A-Thon Analysis as of October 2020 – Pollinator Partnership415.362.1137
Long Beach Beekeepers also saw increased participation this year due to their promotions and trainings.They routinely reminded their members to test for varroa on social media and through their emailnewsletters. In addition, they held 2 live testing demonstrations at their meetings.To view the recording of Long Beach Beekeepers’ August meeting led by President Jennifer Duke,including a presentation by Pollinator Partnership’s President and CEO, Laurie Davies Adams, and thetesting demonstration, click here.Page 6 of 242020 Mite-A-Thon Analysis as of October 2020 – Pollinator Partnership415.362.1137
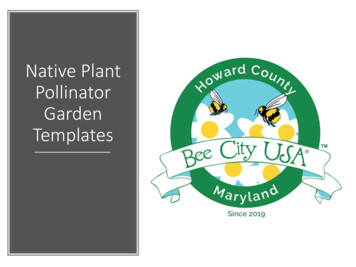
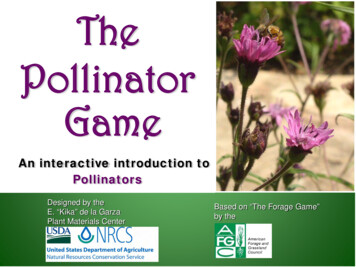
Survey Results1 . Number of mites - May.The result of the combined partner outreach initiatives was participation from 147 beekeepers acrossthe continent who tested 391 colonies for mites. Of the nearly 400 results submitted in May, 58.57%detected varroa, and 14.83% were found above the 3 mites per 100 bees (sample) action threshold.Table 1. Number of May samples having each number of varroa mites.Number of Number ofMitesSamples0162197237337417576874859110511 11TotalColonies391Percentage of Colonies Sampled at Different Mite Counts - May4-55.71%6-105.71%11 2.74%043.61%1-342.24%Figure 1. Percentage of May samples recorded at each of 5 levels of varroa mite infestation.Page 7 of 242020 Mite-A-Thon Analysis as of October 2020 – Pollinator Partnership415.362.1137
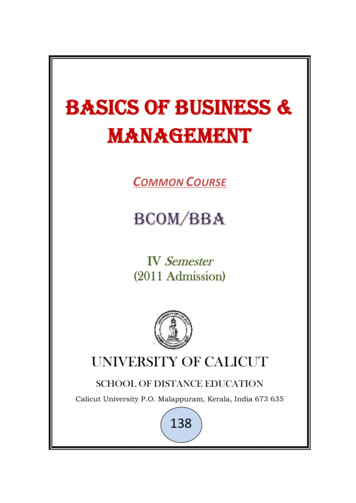
1. Number of mites – August.In August 2020, 357 beekeepers across the continent who tested 1311 colonies for mites. Of theseresults, 74.83% detected varroa, and 23.19% were found above the sample action threshold.Table 2. Number of August samples having each number of varroa mites.Number of Number 1911 66TotalColonies1311Percentage of Colonies Sampled at Different Mite Counts August6-108.97%11 4.94%024.95%4-58.45%1-352.70%Figure 2. Percentage of August samples recorded at each of 5 levels of varroa mite infestation.Page 8 of 242020 Mite-A-Thon Analysis as of October 2020 – Pollinator Partnership415.362.1137
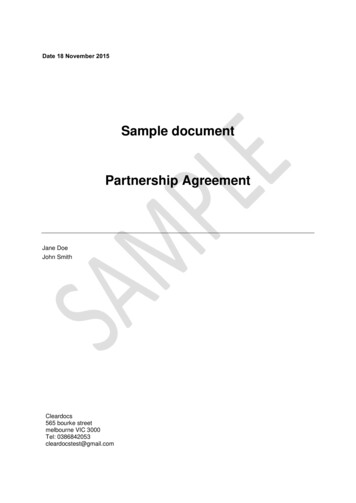
2. Number of reports at each level of mite infestation – May.76.19% of May participants submitted at least one positive sample, and 17.69% had an average varroacount above the 3 mites per sample action threshold.Table 3. Number of May participants at each varroa mite count level.Number of Number ofMitesParticipants03514321731948526772839010211 9TotalBeekeepers147Percentage of Beekeepers at Each Varroa Level - May6-106.75% 113.07%4-57.36%041.72%1-341.10%Figure 3. Percentage of May Mite-A-Thon participants with average varroa levels at each of 5 infestationlevels.Page 9 of 242020 Mite-A-Thon Analysis as of October 2020 – Pollinator Partnership415.362.1137
2. Number of reports at each level of mite infestation – August.90.48% of August participants submitted at least one positive sample, and 26.33% had an averagevarroa count above the 3 mites per sample action threshold.Table 4. Number of August participants at each varroa mite count level.Number of Number 11 48TotalBeekeepers357Percentage of Beekeepers at Each Average Varroa Level - August6-109.76% 115.61%028.54%4-511.46%1-344.63%Figure 4. Percentage of August Mite-A-Thon participants with average varroa levels at each of 5infestation levels.Page 10 of 242020 Mite-A-Thon Analysis as of October 2020 – Pollinator Partnership415.362.1137
3. Individual comparisons – May and August.Fifteen beekeepers participated in both the May and August events (4.2%). Of these beekeepers,average mite counts found in May were 1.10 mites per sample. August saw average mite counts of 2.78mites per sample among the same beekeepers.Individual Averages per Participant in May and August10864201234567May Averages89101112131415August AveragesFigure 5. Individual mite averages per participant in both May and August.Page 11 of 242020 Mite-A-Thon Analysis as of October 2020 – Pollinator Partnership415.362.1137
4. Hive movement – May.The survey asked the following question: “Have you moved the majority of these colonies in the last 2months?” In May, 79 beekeepers answered the question on hive movement, with 6% having movedtheir hives in the last 2 months. Of this 6%, average varroa counts were 1.80 mites per sample. Theaverage count of those who did not move their hives was between 2 and 3 mites per sample, just belowthe action threshold. Approximately 46% of beekeepers chose not to answer this question.Table 5. Number of yes, no, don’t know, and no answer responses to the question, “Have you moved themajority of these colonies in the last 2 months?” and average mite counts for each May response.Hives Moved in theLast 2 MonthsYesNoDon’t KnowNo AnswerNumber ofResponsesAverage MiteCounts9682681.802.271.172.39Percentage of Beekeepers Reporting Colony Movement - MayYes6%No Answer45%No48%Don't Know1%Figure 5. Percentage of May responses recorded for yes, no, and no answer in answer to the question,“Have you moved the majority of these colonies in the last 2 months?”Page 12 of 242020 Mite-A-Thon Analysis as of October 2020 – Pollinator Partnership415.362.1137
4. Hive movement – August.The survey asked the following question: “Have you moved the majority of these colonies in the last 2months?” In August, 233 beekeepers answered the question on hive movement, with 2% having movedtheir hives in the last 2 months. Of this 2%, the average varroa count was above the sample actionthreshold of 3.38 mites per sample. The average count of those who did not move their hives wasbetween 2 and 3 mites per sample, just below the action threshold. Approximately 35% of beekeeperschose not to answer this question.Table 6. Number of yes, no, don’t know, and no answer responses to the question, “Have you moved themajority of these colonies in the last 2 months?” and average mite counts for each August response.Hives Moved in theLast 2 MonthsYesNoNo AnswerNumber ofResponsesAverage MiteCounts62271243.382.616.25Percentage of Beekeepers Reporting Colony Movement - AugustYes2%No Answer35%No63%Figure 6. Percentage of August responses recorded for yes, no, and no answer in answer to the question,“Have you moved the majority of these colonies in the last 2 months?”Page 13 of 242020 Mite-A-Thon Analysis as of October 2020 – Pollinator Partnership415.362.1137
5. Management methods used and intended to use – May.In May, 78 beekeepers provided answers to the management questions associated with the samplingevent. The most popular management method reported was Drone Comb Removal, followed by BreakBrood Cycle and Oxalic Acid.With respect to future management practices, 31.86% of beekeepers who answered said they woulduse Formic Pro in the weeks following their monitoring. The next highest method considered for futureuse was Oxalic Acid, reported by 27.43% of beekeepers. Interestingly, 68 beekeepers declined to answerthe management methods-used question; however, only 34 declined when asked which methods theywere considering.Table 7. Number of beekeepers who used each varroa management method over the past 2 months andnumber of beekeepers considering each management method for the next 2 months.ManagementMethodsDrone Comb RemovalBreak Brood CycleOxalic AcidFormic ProApivarOtherMite Away QuickStripsHop GuardPowdered SugarApiguardFormic AcidApiLifeVarCheckMite ApistanNo AnswerNumber UsedNumberin the Past 2Considering for theMonthsNext 2 34Page 14 of 242020 Mite-A-Thon Analysis as of October 2020 – Pollinator Partnership415.362.1137
Prefered Management Methods - May90Number of Responses80706050403020100Management Methods Used in the Past 2 MonthsManagement Methods Considered for the Next 2 MonthsFigure 7. Number of beekeepers who used each varroa management method over the past 2 monthsand number of beekeepers considering each management method for the next 2 months.Page 15 of 242020 Mite-A-Thon Analysis as of October 2020 – Pollinator Partnership415.362.1137
5. Management methods used and intended to use – August.In August, 344 beekeepers provided answers to the management questions associated with thesampling event. The option for No Treatment was added for this sampling event. The most popularmanagement method reported was No Treatment, followed by Break Brood Cycle and Oxalic Acid.With respect to future management practices, 43.97% of beekeepers who answered said they woulduse Oxalic Acid in the weeks following their monitoring. The next highest method considered for futureuse was Formic Pro, reported by 25.86% of beekeepers. Interestingly, when the No Treatment optionwas added, only 13 beekeepers declined to answer the management methods-used question, and only 9declined when asked which methods they were considering.Table 8. Number of beekeepers who used each varroa management method over the past 2 months andnumber of beekeepers considering each management method for the next 2 months.ManagementMethodsNo TreatmentBreak Brood CycleOxalic AcidDrone Comb RemovalFormic ProApivarApiguardMite Away QuickStripsHop GuardPowdered SugarOtherFormic AcidApiLifeVarCheckMite ApistanNo AnswerNumber UsedNumberin the Past 2Considering for theMonthsNext 2 310126146339Page 16 of 242020 Mite-A-Thon Analysis as of October 2020 – Pollinator Partnership415.362.1137
Prefered Management Methods - August180Number of Responses160140120100806040200Management Methods Used in the Past 2 MonthsManagement Methods Considered for the Next 2 MonthsFigure 8. Number of beekeepers who used each varroa management method over the past 2 monthsand number of beekeepers considering each management method for the next 2 months.Page 17 of 242020 Mite-A-Thon Analysis as of October 2020 – Pollinator Partnership415.362.1137
6. Density of varroa within sample areas.A density map was created, showing the average varroa mite load per square kilometer in NorthAmerica during the event’s timeframe. This shows a snapshot of the reporting regions, and while itillustrates the variability in mite pressure observed throughout the continent, it also must be recognizedthat higher mite densities may simply be reflecting the amount of responses received from thosegeographic areas. Likewise, areas with lower density could be the result of low response rates fromthose areas. The interpretation of these maps should be considered in the context of the program’sstated objectives – to increase knowledge and use of testing protocols and to secure data fromindividual beekeepers about their colonies.2020 Average Mite Density per Square KilometerAverage Density of MitesReported (sq 0.0031-0.0039Figure 9. Average density of mites reported per square kilometer in North America.Page 18 of 242020 Mite-A-Thon Analysis as of October 2020 – Pollinator Partnership415.362.1137
7. Location of participants.This year, as in previous years, the majority of participants came from the United States. Pennsylvaniahad the most participation thanks in part to Chester County Beekeepers Association, followed byMichigan and California (Table 9). This is a difference from 2019, for which the top regions forparticipation were North Carolina, Michigan, and Virginia (Table 10). Additionally, 15 beekeepersparticipated in both the May and August events.Table 9. Top 10 participating states and provincesfor 2020 with number of participants.State 4138272321191716Table 10. Top 10 participating states and provincesfor 2019 with number of participants.State 41292827262518152020 Mite-A-Thon State and Province ParticipationNumber of Mite-A-ThonParticipants 145-141-50-1Figure 10. Distribution of Mite-A-Thon Participants across North America aggregated by state or province.Page 19 of 242020 Mite-A-Thon Analysis as of October 2020 – Pollinator Partnership415.362.1137
8. Number of hives managed by participants.Of May participants, 87% had 10 hives or fewer. 86% of August participants had 10 hives or fewer.Table 11. Number of hives owned by Mite-A-Thon participants.Numberof Hives1-33-1010-100100 MayAugustParticipants Participants7516253144154942Percentage of Participants Owning Each Number of Hives - May10-10012%100 2%1-349%3-1037%Figure 11. Percentage of May Mite-A-Thon participants who own each number of hives.Percentage of Participants Owning Each Number of Hives August10-10014%100 1%1-345%3-1040%Figure 12. Percentage of May Mite-A-Thon participants who own each number of hives.Page 20 of 242020 Mite-A-Thon Analysis as of October 2020 – Pollinator Partnership415.362.1137
9. Number of new and returning participants.Interestingly, 74.52% of 2020 participants were new to the Mite-A-Thon, meaning over 310 beekeepersparticipated for the first time (Figure 13). Because recurring participation was determined by calculatingduplicated email addresses from 2017-2019, it does not take into account the 88 participants who wereunwilling to share their contact information or those who may have changed email addresses.2020 Percentage of New and Returning Participants from 20172019Returning25.48%New74.52%Figure 13. Number and percentage of new Mite-A-Thon participants in 2020 and returning participantsfrom 2017-2019.Compared to 2019, 2020 had 41 fewer participants and 140 fewer colonies tested. Estimating using the74.52% new participation rate for 2020 and the rates of 80.05% and 85.77% for 2019 and 2018respectively, the Mite-A-Thon has seen about 2,300 different participants over 4 years and 8,876colonies have been sampled. The 2020 results showed no substantial differences from 2019 in thenumbers of mites found in each sample, average varroa counts for each beekeeper, or the highest mitecounts reported by each beekeeper.Table 12. Yearly participation comparison with projected new participants for each year.Year2020201920182017TotalParticipants ColoniesProjected 869043010904263688762299Page 21 of 242020 Mite-A-Thon Analysis as of October 2020 – Pollinator Partnership415.362.1137
10. Outreach penetration.The Pollinator Partnership social media outreach initiative “Mite-A-Thon Mondays” had a total reach of119,891 from Facebook, Instagram, Twitter, and Mailchimp, averaging a reach of 8,946 per post. Thisincluded 14 posts on both Facebook and Instagram and 12 posts on Twitter and Mailchimp emails. Thecombined reach for the posts across the 4 platforms was 10.81% of the total potential reach, 1,108,712.Table 13. Reach of the 14 Mite-A-Thon Monday posts from Facebook, Instagram, and 12 Twitter impTotal Reach (TwitterAverageTotalPotentialImpressions andReach perPotentialReach perMailchimp 2864427,9962,333119,8918,9461,108,71280,68611. Social media pageviews.It should be noted that reach includes unique views of each post or email opens, not unique individuals,because it includes double counting of individuals who viewed more than 1 of the 14 posts. Of eachoutreach platform, Mailchimp was the most successful at engaging viewers, with 12.34% engagement.Total engagement for this initiative was 4.34%. Engagement includes likes, shares, comments, andopens. During 2020 promotional periods, 4,113 unique pageviews were recorded onhttps://www.pollinator.org/miteathon, of which 13.76% viewed the giveaway, signup, or resources page(Table 15, Figure 16). Pageviews peaked the first weekend of the event, with additional peaks for eachMite-A-Thon Monday outreach surrounding the events.Table 14. Total engagement compared to reach of each outreach lchimpCombinedTotal Reach (Twitter TotalAverageImpressions andEngagement EngagementMailchimp Opens)per 80119,8915,208388Page 22 of 242020 Mite-A-Thon Analysis as of October 2020 – Pollinator Partnership415.362.1137
Table 15. Total unique website pageviews of pollinator.org/miteathon web pages from 2020promotional periods.WebsiteTrafficMain ources5.15%Signup2.04%Main Page Only86.24%Figure 15. Percentage of Pollinator Partnership Mite-A-Thon pageviews for each webpage.Figure 16. Pageviews per day on https://www.pollinator.org/miteathon during the 2-week period of theMite-A-Thon.Page 23 of 242020 Mite-A-Thon Analysis as of October 2020 – Pollinator Partnership415.362.1137
The Bee Informed Partnership reached over 11,000 social media followers with their posts. Additionally,they saw 209 users access the MiteCheck app during the May event and 288 users access the app duringthe August event. MiteCheck.com also had a total of 566 unique pageviews during the events.Discussion and Next StepsIn 2020, nearly 75% of participation was from new individuals who had not participated in previousyears. This is encouraging, because it shows that many new individuals are being reached and educatedon varroa management and that past participants may now be trained and familiar with testing,lessening their desire to contribute data. This number has been falling by roughly 5% each of the pastthree years, indicating that there is also a growing number of beekeepers who remain engaged andreport data even after being trained.Another encouraging result was the 90% decrease (August 2020 compared to 2019) in declined answersto the management methods question when asked which methods were used in past months and the80% decrease in declined answers to the management method question when asked which methodswould be considered for the coming months. Instead, the number of “No Treatment” responses for2020 was similar to the non-answers from 2019. This likely indicates that the addition of the NoTreatment response for 2020 was appropriate and that many of the declined answers in previous yearswere due to not treating. There was also a 63% decrease in “No Treatment” responses when askedwhich methods would be considered for the coming months. This could indicate that the Mite-A-Thon issuccessfully making beekeepers, many of which were first time participants, aware of availablemanagement methods.With the additions of the Manitoba and Saskatchewan ministries of agriculture and the Newfoundlandand Labrador Beekeepering Association to the Mite-A-Thon leadership team and adjusting datacollection dates to better accommodate Canadian beekeepers, Canadian participation rebounded in2020; however, it is still less than half of what it was in 2018 and 2017. It is possible that covid-19complications were responsible for a general decrease in participation this year.Additionally, Mexico had its first participant this year, but future Mite-A-Thons should consider thatbeekeepers in Mexico may need earlier and more frequent engagement to continue. A Mexican additionto the leadership team as well as a Spanish Mitecheck survey and Mexico Mitecheck map will likely helpwith this. Mexican beekeepers may also benefit from a later sampling date than the US and Canada.With a better idea of the gaps in currently available data, Pollinator Partnership is seeking to increaseeffectiveness of the Mite-A-Thon in 2021. Increased participation is one indicator of the success of thisproject, but other criteria need to be established. The timely dissemination of this report to allparticipants and other beekeepers will be a large impetus for increased effectiveness of the program.Although not the primary priority of the project, collecting a more robust data set in future years may bepossible by continuing to reengage those who have already been trained. The timely reporting of resultsafter each year’s event to document the year’s efforts will help retain and recruit participants.Page 24 of 242020 Mite-A-Thon Analysis as of October 2020 – Pollinator Partnership415.362.1137
The second year of the giveaway was a success, with Chester County Beekeepers Association (CCBA) in Pennsylvania and Long Beach Beekeepers in California selected as winners. CCBA focused on providing thorough monitoring instruction for all club members, including expert lectures during their virtual zoom meetings.