Transcription
APRIL 2013 VOLUME 7An analysis of issues shaping Africa’s economic futureuuuSub-Saharan Africancountries maintain growthmomentum, as well asprogress toward the MDGsGrowth has reducedpoverty, but not by enoughBetter governance ofmineral revenues, highagricultural prices, thedemographic dividendand rapid urbanizationrepresent opportunitiesfor making growth morepoverty reducingAFRICA’S PULSE TEAM:Punam Chuhan-Pole (Team Leader)Luc Christiaensen, Manka Angwafo,Mapi Buitano, Allen Dennis, VijdanKorman, Aly Sanoh and Xiao YeWith contributions fromShanta Devarajan, Jos Verbeekand Eugenia MoranThis document was produced bythe Office of the Chief Economistfor the Africa region
Summaryu The global economic recovery remains tepid, but it is expected to gradually strengthen going forward.u Sub-Saharan African countries continue to grow at a strong pace, spurred by domestic demand and still highcommodity prices. Economic prospects are tilted to the upside.u Good progress has been made on a few MDGs, even though the region lags in achieving the development goals.u More than a decade of strong growth has reduced poverty in Sub-Saharan Africa, but high inequality andresource dependence have dampened the poverty-reducing effect of income growth.u Several opportunities—mineral wealth, elevated food prices, rapid urbanization and a demographicdividend—hold the promise of accelerating the income growth of the poorest groups, but appropriate policiesare required to unleash this potential.Section I: Recent Trends and ProspectsuFiscal consolidation and weak consumer and business sentiment in high-income countries continue to weighdown global growth, which is projected to tick up to 2.4 percent in 2013.uEconomic output in Sub-Saharan Africa expanded at nearly twice the global rate. With some of the fastest growingeconomies in the world, African growth is expected to accelerate to over 5 percent in 2013-15.A. RECENT DEVELOPMENTS IN THE GLOBAL ECONOMYMore than four years after the financial crisis hit, the global economic recovery remains tepid, weighed down by weakactivity in high-income countries, particularly in the Euro Area. The recession in the Euro Area likely continued throughQ1 2013. Euro Area industrial production data in January point to a broad-based contraction in activity (-5.2%, 3m/3msaar), even if the pace of decline has slowed. Recent market sentiment indicators signal the persistence of weak economicactivity in the region. Although financial markets’ response to the Cyprus crisis has thus far been muted, it is still tooearly to assess the real-side impacts, if any, of this crisis on the wider Euro Area. It is unlikely to be favorable for the fragilerecovery that is underway in the currency union. Nonetheless, acceleration in developing-country import demand and, toa lesser extent, in US imports is helping to mitigate some of the weakness in the Euro Area.Activity has firmed up in the US and stabilized in Japan. Despite the drag coming from higher payroll taxes and thesequester, industrial production in the United States expanded at an annualized pace of 5.2 percent during the threemonths ending February 2013, supported by a recovering housing market and an increase in payroll jobs. The recentstrengthening of economic indicators in the US—import demand, durable goods order, business sentiment indicators—signal that economic activity in Q1 2013 will pick up from the flat output observed in Q4 2012. In Japan, Januaryindustrial production data show that the 8-month contraction in activity came to an end in January (0.2% 3m/3m saar).This suggests that monetary and fiscal stimulus measures are boosting current quarter growth. However, if supply-sideconditions do not improve this uptick may come at the expense of growth towards the end of the year and into 2014.2 A F R I C A’ S P U L S E
Led by China, the recovery in developing country activity remains strong. Industrial production in developing countriesexpanded at a robust 8.8 percent annualized pace in January (4.3%, 6m/6m saar), driven in part by a strong 11.6percent expansion in China; excluding China, industrial production for developing countries grew at 3.8 percent inJanuary. With China being an important trading partner for many developing countries, the robust growth there andsubsequent strong import demand (23.2%, 3m/3m saar in January) is supporting the expansion in industrial productionin other developing (and high-income) countries. Strengthening activity in the United States should also bode well fordeveloping country exports.Baseline projections are for a modest acceleration of growth between 2013 and 2015. Overall, global GDP is projected toexpand by 2.4 percent in 2013 and gradually strengthen to about 3 and 3.3 percent in 2014 and 2015. For high-incomecountries, fiscal consolidation, high unemployment and still weak consumer and business confidence will continue toweigh on activity in 2013, with growth coming in at 1.2 percent. But growth should firm to about 2 and 2.3 percent in2014 and 2015, respectively. Improved financial conditions, a relaxation of monetary policy, and somewhat strongerhigh-income country growth should prompt a gradual acceleration of developing country growth to about 5.4 percentthis year, and to 5.7 and 5.8 percent in 2014 and 2015 respectively—roughly in line with underlying potential. But futuregrowth is not guaranteed. So far, developing countries have weathered the great recession relatively well as developingcountry growth has declined by only 1 percentagepoint over the 2000-07 average. Regaining, orsurpassing, those growth rates will require sustainedprogress in raising supply potential by maintainingmacroeconomic sustainability, improvingFIGURE 1: Real GDP growth and prospectsrobust at5.8 percenthealth and education.3(excluding SouthAfrica) in 20121-120012003Despite the global economic slowdown in 2012,supported by resilient domestic demand andAfrica remains75growth in Sub-Saharan Africa remained robustSub-Saharan(real GDP growth, % ch)governance, and investing in infrastructure,B. RECENT DEVELOPMENTS INSUB-SAHARAN AFRICAGrowth in2005Developing(ex. China)20072009Sub-Saharan Africa201120132015Sub-Saharan Africa(ex. South Africa)Source: Development Prospects Group.still high commodity prices. In 2012, the region’sgrowth was estimated at 4.7 percent. ExcludingSouth Africa, the region’s largest economy,FIGURE 2: Fastest growing Sub-Saharan African countriesin 2012Sierra Leonepercent—higher than the developing countryNigerof countries in the region grew at 7 percent orbetter, and several African countries are among thefastest growing in the world (Figure 2). Mediumterm growth prospects remain strong and shouldbe supported by a pick-up in the global economy,high commodity prices, and investment in theproductive capacity of the region’s economies.Overall, the region is forecast to grow at more than5 percent on average over the 2013-15 period: 4.9are among thefastestthe remaining economies grew at a robust 5.8average of 4.9 percent (Figure1). About a quarterAfrican countriesgrowingcountries in theCote d'IvoireworldLiberiaEthiopiaBurkina 8Source: Development Prospects Group.A F R I C A’ S P U L S E 3
percent in 2013, gradually strengthening to 5.2HigherinvestmentFIGURE 3: Investment and growth in Sub-SaharanAfrica, 1992-2011percent by 2015.is supportingGDP growth (%)876543210-1 15-2economicgrowthIncreased investment flows are supporting theregion’s growth performance, with investmentto-GDP ratios increasing by an average of 0.5percentage points per annum over the past decade(Figure 3). In 2012, for instance, net private capitalflows to the region increased by 3.3 percent to a1719212325decline in capital flows to developing countries.Investment-to-GDP (%)Foreign direct investment flows tend to dominateSource: Development Prospects Group.FDI flows torecord 54.5 billion, notwithstanding the 8.8 percentcapital inflows to the region, thanks to a wealth ofFIGURE 4: Foreign direct investment flowsextractive resources, but also because other formsSub-SaharanAfrica held(Net inflows, billions)of capital flows such as portfolio and bank lendingup in 2012,454035302520151050to the region are limited by less developed capitaldespite aweaker globaleconomicenvironmentmarkets and a banking sector that is less integratedwith global financial markets (South Africa andMauritius are exceptions). Foreign direct investment(FDI) to the region increased by 5.5 percent in 2012to 37.7 billion, although for developing countries asan aggregate these flows fell by 6.6 percent (Figure20082009Source: Development Prospects Group.201020112012e4). The resilience of FDI flows to the region in 2012reflects, inter alia, still high commodity prices (eventhough prices softened during the year). In 2012,several mines were expanded or new ones constructed; prospecting yielded major gas discoveries along the east coast ofAfrica; new, commercially viable oil wells were drilled in West Africa and East Africa; and a number of countries discoverednew mineral deposits.While both foreign and domestic-originating private and public investments (mainly infrastructure-related) haveincreased, the investment-to-GDP ratio of about 22 percent in Sub-Saharan Africa is the lowest among developingregions. The region’s investment-to-GDP ratios are at levels observed in China in the early 1960’s and India in the early1980’s—both prior to their economic boom, suggesting increased scope for further expansion in productivity-enhancinginvestment in the region.While the extractive industry sector dominates in terms of the value of overall FDI flows, investment in the servicessector, notably among infrastructure-related projects in construction, transportation, electricity, telecommunicationand water, has been expanding. In addition, some of the larger economies with a growing middle-class such as Nigeria,South Africa, Kenya and Ghana, are increasingly attracting investment flows to their rapidly expanding consumer sector:i.e. retail and consumer banking. The contribution of the service sector to economic growth is large in both resourcerich and resource-poor countries (Figure 14). Africa is an attractive investment destination: The United Nations WorldInvestment Report, 2012 reports that data on the profitability of United States FDI—FDI income as a share of FDI stock—shows a 20 percent return in Africa in 2010, compared with 14 percent in Latin America and the Caribbean and 15percent in Asia.4 A F R I C A’ S P U L S E
Notwithstanding the positive developments at theregional level, investment flows were held back dueIn 2012, Zambia issued a maiden 10-year 750 billion Euro bondBOX 1:to political instability and regulatory uncertainty inat a 5.625 percent yield—lower than yields in some high-spreadA growinga number of countries (e.g. Guinea).Euro Area economies at the time--that was oversubscribed. OthernumberAfrican countries that accessed global bond markets for the firstof AfricancountriesBesides increased private investment, governmentstime in recent years were Ghana, Namibia, Nigeria and Senegal.in the region are focusing their attention onAlso in 2012, the domestic bonds of the two largest economiestackling the infrastructural weaknesses that arein the region were added to the emerging market bond indicesinternationalinhibiting the region’s competitiveness and growth.of major global banks: South Africa to the Citi World GovernmentsourcesFor example, the spike in capital expenditure inBond Index (WGBI) and Nigeria to the JP Morgan EmergingNiger since 2010 is linked to the construction of theMarket Global Bond Index. This March, a Nigerian domesticKandadji Dam, which will increase the provision ofbond was included in the Barclays Index. Further, in a bid toelectricity and irrigation services. In Cote d’Ivoire,deepen capital markets in the region, the International Financea country-wide infrastructure rehabilitation andCorporation is planning to issue domestic currency-denominatedrenewal program has boosted capital spending.bonds in selected countries. Indeed, in January 2013 it becameCapital projects in the region have been fundedwith higher government revenues (generated fromfaster growing economies and higher commodityprices) as well as from improving access tointernational capital markets and new sources ofbilateral official financing, notably from China (Box1). Continued investment in key infrastructure willbe critical to maintaining and strengthening growthare raisingcapital fromthe first non-resident entity to issue a Naira-bond, which wasoversubscribed by some 50 percent and raised 75 million.Nonetheless, for the more fragile economies in the region,public capital investments will continue to rely heavily on officialdevelopment assistance. While gaining access to more diversifiedsources of capital to fund critically needed infrastructure shouldhelp improve competitiveness, the increased exposure to privatecapital flows calls for keeping fiscal balances and debt-to-GDPratios at prudent levels.over the medium term.Nonetheless, care must be exercised to ensurethe long-term sustainability of public investment programs. For example, where high commodity prices have boostedgovernment revenues, spending needs to be sufficiently flexible so as to be able to absorb what could be a significantrevenue loss if commodity prices were to fall. World Bank simulations suggest that a 20 percent fall in industrialcommodity prices would lead to a 1.6 percentage points of GDP decline in government balances over a three year period.Hence, countries will need to carefully balance a ramping up of priority investment spending with safeguarding fiscalflexibility should commodity prices and government revenues decline.Overall, the region’s general government balance as a share of GDP deteriorated in 2012, with some 40 percent of countriesseeing their fiscal balance worsen by 1 percent or more of GDP. Resource-rich countries generally saw a decline in theirfiscal positions, with stagnant oil prices and growing nonoil deficits pulling down fiscal balances in several oil-exportingcountries. A few countries—Chad, Ghana, Malawi and Sudan—saw a sharp widening of their fiscal deficit by more than 4percent of GDP. Public debt-to-GDP ratios in the region are relatively low in historical terms or in comparison with highincome countries. Yet, this ratio has increased from 31 percent in 2008 to 38 percent in 2012. Ghana, Niger, Senegal andUganda are among countries that have seen a rapid increase in their debt levels over the past four years. Overall, theregion’s oil importers have a relatively higher debt of 43 percent of GDP compared to 34 percent for oil exportersConsumer spending held up in 2012. Supported by solid real income growth—averaging 2.3 percent per capita growth perannum—consumer demand has grown relatively rapidly in recent years. Consumer spending accounts for over 60 percentof GDP. Overall, the contribution of domestic demand to growth was a robust 5.6 percentage points (net exports subtracted0.9 percentage points) reflecting the importance of domestic demand—investment, consumption and governmentA F R I C A’ S P U L S E 5
spending—to the region’s resilient growthdemandFIGURE 5: Contribution of domestic demand and netDomesticdemandremains a (percentagerobust pillar of growthin SSAexportsto growthcontribution)performance (Figure 5).remains a10Factors shoring up consumer spending include8declining inflation, which fell from 9.5 percent in6January 2012 to 7.6 percent in December 2012 (in4Ethiopia, Kenya, Tanzania and Uganda inflation rates2fell by over 8 percentage points in 2012); improvedDomesticrobust pillarof growth -4Domestic demandNet exportsReal GDP growthSource: Development Prospects Group.access to credit, for example in Angola, Ghana,Mozambique, South Africa, and Zambia; lowerinterest rates—for every interest rate hike there werethree cuts; a rebound in agricultural sector incomes,thanks to more favorable weather conditions incountries such as Guinea, Mauritania and Niger,which all experienced better rains compared with the 2010/2011 crop year; and steady remittance inflows, which wereestimated at 31 billion in 2012 and 2011.Export performance differed across the various exporter groups in the region. Among oil exporters, export volumes for thefirst ten-months of the year were some 3.8 percent higher than for the same period a year ago, mostly due to an increase inexports from Angola. Export volumes expanded by 7.8 percent among the predominantly metal exporters, notwithstandingsubdued demand in the global economy and a 15 percent decline in the World Bank metal prices index. The increasedexport volumes reflect investments in mines in earlier years: for example, Mozambique, Niger, Sierra Leone and Zambia.Export volumes of agricultural exporters expanded the most in the region (13.7 percent in the first ten months). This wasin part due to improved rains in east Africa compared to a year earlier and the lower cyclical sensitivity of agriculturalcommodities to global business cycles.Trade performance in the region as a whole, however, was not immune to developments in the global economy.For the first two quarters of 2012, export growth in the region was at a robust annualized pace of 20.5 percent and52 percent respectively. Following the slump in global economic activity in the third quarter, export growth in SubSaharan Africa contracted at a 33.8 percent annualized pace (Figure 6). With the pick-up in global industrial productionin recent quarters, it is expected that expansion in the region’s export volumes would have resumed by the first quarterof 2013. Available data for South Africa show thatexport growth expanded by 19 percent (3m/3meconomicFIGUREGrowthSub-SaharanAfrican exportersGrowthin Sub edominantexportgroup adjusted and annualized 3m/3m growth)developments(volumes, seasonally adjusted and annualized 3m/3m growth)contraction in activity in the third quarter (-12.9 %,influenced the100806040200-20-40-603m/3m saar).Globalmonthly tradeperformance ofServices trade, particularly tourism, is an importantdriver of growth in several countries, includingtraditional destinations such as Cape Verde, Kenya,Mauritius and Seychelles and newer g-12Sep-12Oct-12major exportssaar) in the fourth quarter although there was aSource: Development Prospects Group.such as Rwanda. Data from the UN World TourismOrganization show that the growth in touristarrivals was 5 percent (y/y) in 2012, compared witha global average of 3.8 percent (Figure 7). Countriesrecording a strong growth in tourist arrivals6 A F R I C A’ S P U L S E
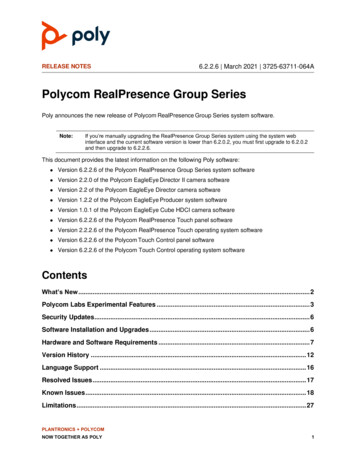
included Cape Verde, Madagascar, Sierra Leoneand South Africa.FIGURE 7: Annual growth in tourist arrivalsThe growth in tourist arrivals is encouraging andPercent12indicative of a diversification of source countries.10Growth intourist arrivalsin Sub-SaharanAfrica has beenabove average8For instance, in Mauritius, arrivals from Europein recent years,6(largest source market) fell by 7.7 percent for thealbeit from a4January – September period, but arrivals from Chinalow base2rose 38 percent, and those from Russia 91 percent.0Tourist arrivals to the country were also up from-2elsewhere in Africa (13.2 percent), Australia (13.5-4-6percent), Canada (18 percent) and South America(55.3 percent). Other countries fared less well: theWorld2009High-income2010DevelopingSub-Saharan Africa20112012Source: UN World Tourism Organization.cancellation of major charter flights to MombasaRobust export growth has underpinned Sub-Saharan Africa’s economic expansion. However, much of the region’s export growthBOX 2:has been driven by natural resources. Between 2000 and 2011, total Sub-Saharan exports increased from 100 billion to 420 billion,Africa hasdiversifiedits exportmarkets, butthe compositionof exports isunchangedwith the resource sector, including petroleum, ores, base metals and gold, accounting for three quarters of exports.Among manufacturing exporters, South Africa is the regional powerhouse, accounting for 70 percent of total regionalmanufacturing exports. A few smaller countries have developed manufacturing capacity that drives exports, such as Lesotho,Madagascar and Mauritius.During the same period, the region’s manufactured goods increased from 13 billion to 33 billion. The EU’s dominance as SubSaharan manufacturing exports destination has decreased significantly, from importing 39 percent of total Sub-Saharan Africanmanufacturing exports in 2000 to 29 percent in 2011.Since 2000, the overall growth of Sub-Saharan exports to emerging markets, including those of China, Brazil and India, and tocountries in the region has surpassed that to developed markets. Total exports to Brazil, India and China were larger than to theEU market in 2011. Geographic characteristics of export diversification are also noteworthy. Intra-regional exports, though still in anascent stage, are most diversified, with manufactured goods and agricultural products accounting for 46 percent of total exports.In contrast, manufacturing and agriculture account only for 5 percent of total exports to Brazil, India and China; 10 percent to theUnited States; and 30 percent to the EU.Contribution of different exports to totalexport growth, 2000-11Source: COMTRADE and staff 515011920216899 97 99142100119121508941 36 34 45 6402000Billion USExports by type100OtherManufactured goodsAgricultural sitionof Sub-Saharan8.66.29.4Other20.6Manufactured goodsAfrica’s exportAgricultural products4020FIGURE 8:Metal/ores/minerals55.3Petroleum0Percent contribution to total exportgrowth between 2000 2011Box 2 continuesA F R I C A’ S P U L S E 7
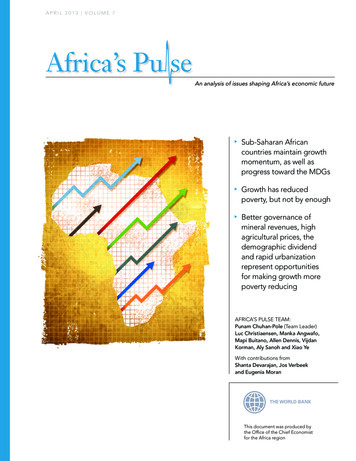
Box 2 continuedFIGURE 9:Manufacturing exports by destinationExports by type and destination35African exports140430by destinationOther countriesBillion US 25132050Sub-Saharan Billion US Sub-Saharan80604073200Other22921Agricultural productsManufactured goodsMetal/Ores5059EUUSBrazil/India/ChinaMineral fuel12SSASource: COMTRADE and staff calculation.following terrorism and piracy concerns there contributed to the 2 percent (y/y) fall in tourist arrivals to Kenya betweenJanuary and August 2012. Similarly, the conflict in Mali led to a sharp decline in tourist arrivals in that country.C. MEDIUM-TERM OUTLOOKMedium-term economic prospects for Sub-Saharan Africa remain strong. The same driving forces that have underpinnedthe region’s robust performance in recent years are expected to be sustained over the projection horizon. On aggregate,the region’s GDP growth is expected to average more than 5 percent over 2013-15: 4.9, 5.1 and 5.2 percent for 2013, 2014and 2015 respectively. Excluding South Africa, GDP growth for the rest of the region is expected to pick-up to about 6.1percent in 2013 and 6.0 percent and 6.1 percent in 2014 and 2015 respectively.Increased investment will drive growth over the medium term. Foreign direct investment to the region is expected toremain strong, with FDI inflows projected to increase to record levels each year reaching 54 billion by 2015. FDI inflowsto the extractive industries sector and, to a lesser extent, the agriculture sector should be supported by high, if somewhatsoftening, commodity prices over the next two to three years. Strong exploration efforts in East Africa in recent yearshave led to the opening of several oil and gas wells. In Southern Africa, Mozambique is likely to attract increased foreigninvestment to its huge coal deposits and offshore gas discoveries and Zambia will continue to see increased investmentsin its copper sector. Similar investments in the minerals sector in the West African countries of Ghana, Guinea, Liberia,Nigeria and Sierra Leone are also expected.Domestic private investment in the near term is expected to be supported by the interest rate cuts in the regionin 2012. Furthermore, in an environment of easy monetary policy in high-income countries, countries with a stablemacroeconomic environment and prudent fiscal policies could access international capital markets to finance their publicinfrastructure programs. So far some twenty countries in the region have obtained international sovereign credit ratings.Angola, Kenya, Rwanda and Tanzania have all expressed interest in raising international bonds in the near term.Consumer spending will likely remain strong, helped by an improving inflation outlook. With fuel and food staple priceseasing, inflationary pressures will moderate. Monetary authorities are also expected to keep inflationary pressures in check.Nevertheless, some countries may see an uptick in inflation due to higher imported inflation from weaker currencies,higher food prices or a reduction in energy subsidies.8 A F R I C A’ S P U L S E
The modest pick-up in the global economy projected in 2013 and beyond should provide some support to Sub-SaharanAfrican export growth. Exports are also expected to increase due to the coming on stream of new mineral exports inBurkina Faso, Cameroon, Gabon, Mozambique, Niger and Sierra Leone. A stronger global economy should also lead tofurther strengthening of the region’s tourism sector.The increased demand for capital goods to meet infrastructure and other investment needs, growing demand for oil,and rising per capita incomes should boost demand for consumer durables and other imports. As a result, the regionalcurrent account deficit is projected to increase to about 2.8 percent of regional GDP in 2014 from 2.4 percent in 2012before improving to 2.5 percent in 2015. However, for some of the less diversified oil exporters, such as Angola and theRepublic of Congo, net exports will be positive.These expected medium-term positive developments will not be uniform across the region. Labor unrest (South Africa)and political instability (Central African Republic, Mali and Togo) are expected to cut into economic activity in somecountries in the region over the forecast horizon.RisksNotwithstanding the robust growth expected for the region over the forecast horizon, some significant downside risksremain. On the external front, a fragile global recovery is a source of risk. While a tepid recovery of global economic activityis the baseline scenario, the many tension points in the global economy could result in a much weaker outcome. First,though tensions in financial markets in the Euro Area have eased since Q2 2012, conditions remain fragile and sentiment isvulnerable to bad news. Should they deteriorate markedly, with a credit freeze to some of the larger, high-spread, troubledEuro Area economies, global economy activity could return to recession-like conditions and GDP in Sub-Saharan Africacould fall by up to 3.5 percentage points relative to the baseline forecast.The sequester in the United States is already sapping growth there. The baseline scenario assumes agreement ona credible medium-term plan to restore fiscal sustainability. In an alternate scenario where uncertainty in US fiscalpolicy leads to increased precautionary savings by US consumers and businesses, US growth could slow by some 2.3percentage points. Should that arise, the trade channel alone could cause Sub-Saharan Africa’s GDP to decline by 0.6percentage points relative to the baseline. Given the importance of the US economy to global markets, the indirecteffects through weaker confidence and the rattling of global financial and commodity markets would likely have astronger impact on the region.A third tension point surrounds the possibility of a disorderly unwinding of China’s unusually high investment rate.With Chinese demand accounting for some 50 percent of many industrial metals exported from Africa, a sharper-thanenvisaged downturn there could lead to a slump in commodity prices which would hurt countries which are especiallyreliant on oil, metals and other minerals.Aside from these external risks, downturns from domestic disruptions are equally important. While debt-to-GDP ratiosand fiscal deficits remain on aggregate low in the region, a few countries have seen a rising trend in these indicators. Forinstance, fiscal deficits in Ghana climbed to around 12 percent of GDP in 2012, exceeding the already high target level of6.7 percent. Given the important contribution of macro stability to the recent robust growth performance in the region, itwould be prudent to ensure that debt dynamics remain sustainable—all the more so as an increasing number of countriesare exposing their economies to external private funding sources.Other risks include disruptions to productive activity from political, civil and labor unrest, as investment, trade and tourismactivity—all important growth drivers—are likely to suffer. In 2012, labor unrest in South Africa, terrorist activity in parts ofA F R I C A’ S P U L S E 9
Nigeria, coups d’état in Mali and Guinea-Bissau, and political stalemate in Guinea and Madagascar curtailed economic activityto varying degrees in these countries. Though most economies in the region remain stable, simmering conflicts, particularlyin the fragile states, continue to pose an important downside risk to their economic activity in the medium term. Food pricespikes are a cause for concern as well.Food pricesBecause of the large share of food in household spending, the poor are particularly vulnerable to food price increases. Atthe global level, food prices have declined some 9 percent from their peak of last August (W
APRIL 2013 VOLUME 7 An analysis of issues shaping Africa's economic future u Sub-Saharan African countries maintain growth momentum, as well as progress toward the MDGs u Growth has reduced poverty, but not by enough u Better governance of mineral revenues, high agricultural prices, the demographic dividend and rapid urbanization