Transcription
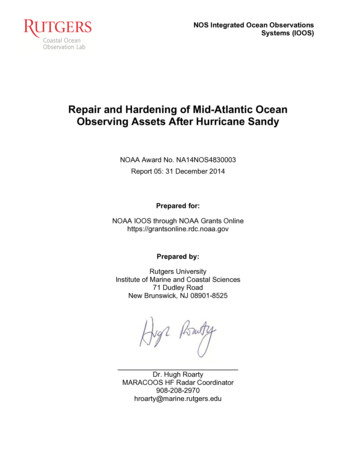
Appendix C. NOAA Data Site Wind Performance Summary Fact SheetsCover SheetAs part of the Massachusetts Technology Collaborative (MTC) Offshore Wind Collaborative Pilot Research Program,we have collected and analyzed available windspeed information from the National Oceanic & AtmosphericAdministration (NOAA) National Data Buoy Center (NDBC) (http://www.ndbc.noaa.gov). This information was thenused to analyze the potential economic and environmental performance of northeast offshore wind energy resources.There were seventeen data sites analyzed for this project (see map and table below). They represent a subset of thehistorical NOAA stations, and were chosen based on the number of years of data available. The table below listsstation names, ID numbers, locations, and other reference information. It also displays average windspeeds andassociated capacity factors for the data sites. The next page gives a detailed description of the content of theindividual site fact sheets created for this project.Locations of the 17 NOAA stations selected for analysisJonesport,MEMatinicusRock, MEPortlandIsle ofShoals, NHLoganBuzzardsBayAmbroseLight, NYMontaukPointBostonMt. DesertRock, MEGulf ofMaineSE Cape CodNantucketLongIslandDelaware BayGeorges BankNCDC StationsMoored BuoysC-MAN StationsHotelSource: www.ndbc.noaa.gov/Maps/northeast hist.shtmlStation NameStationID1Logan14739Portland44007Isle of ShoalsIOSN3Boston44013Jonesport44027Georges Bank44011Delaware Bay44009Long Island44025Nantucket44008Gulf of Maine44005Ambrose LightALSN6SE Cape Cod44018Buzzard's BayBUZM3Matinicus Rock MISM1Montauk Point44017Mt. Desert Rock MDRM1Hotel44004Location,LatitudeLongitude42.37 N 71.03 W43.53 N 70.14 W42.97 N 70.62 W42.35 N 70.69 W44.27 N 67.31 W41.11 N 66.62 W38.46 N 74.70 W40.25 N 73.17 W40.50 N 69.43 W43.18 N 69.18 W40.46 N 73.83 W41.26 N 69.29 W41.40 N 71.03 W43.78 N 68.86 W40.70 N 72.00 W43.97 N 68.13 W38.47 N 70.56 WDistance FromShore, nauticalmiles (miles)0 nm (0 mi)10 nm (12 mi)8 nm (9 mi)20 nm (23 mi)20 nm (23 mi)170 nm (196 mi)30 nm (35 mi)30 nm (35 mi)50 nm (58 mi)80 nm (92 mi)20 nm (23 mi)30 nm (35 mi)30 nm (35 mi)4 nm (5 mi)20 nm (23 mi)20 nm (23 mi)200 nm (230 mi)Anem. WaterAve.Ave.Location, Direction fromHeight, Depth, Windspeed CapacityShore Pointmm@ 75m, m/s Factor, %Logan Airport, Boston, MA86.4625.5SE of Portland, ME5207.1634.9SE of Portsmouth, NH327.5838.2East of Boston, MA5607.6037.9SE of Jonesport, ME51807.8840.3East of Hyannis, MA5908.0341.1SE of Cape May, NJ5308.1542.7South of Islip, NY5408.2643.7SE of Nantucket, MA5608.3443.7East of Portsmouth, NH5208.3644.3SE of Ambrose Light, NY298.3844.9East of Nantucket, MA5708.3943.6SW of Buzzard's Bay, MA258.4045.1SE of Matinicus Island, ME338.4745.0SW of Montauk Point, NY5508.6146.4SE of Mt. Desert Island, ME328.6346.3East of Cape May, NJ53,1208.9849.5Source: NOAA NDBC and NCDC1 Station Pages1Logan Airport data come from the NOAA National Climatic Data Center (NCDC) (http://www.ncdc.noaa.gov).MIT LFEE 2006-02 RPOffshore Wind Collaborative – Pilot Research ProgramJan. 2006, pg. App-12
The research team analyzed historical NOAA windspeed data to calculate windspeeds at wind turbine hub height foreach individual data site, and to estimate potential generation, revenue, and avoided emissions from locating windturbines in similar environments. These calculations are based on historical hourly values of NOAA windspeeds, NewEngland Independent System Operator (ISO-NE) wholesale power prices, and Environmental Protection Agency(EPA) emission rates for fossil generators. After finishing the analysis, we created fact sheets to display key resultsand to address the potential economic and environmental performance of the wind resource at the data sites.As the individual fact sheets show, inter-annual and intra-annual variability in windspeeds andpower generation is quite large. These variations in the wind resource must be taken into accountwhen assessing the performance of prospective wind farms.Below is a description of the various sections of the individual data site fact sheets.Average Annual Windspeed @ 75m and Average Seasonal Windspeed @ 75mWindspeeds were averaged from hourly wind data measured at anemometer height and scaled to 75m hubheight using the Log Law (with .2mm roughness length). Anemometer heights at the data sites vary from 5 to 33meters. Hub height was chosen as representative of likely U.S. offshore configurations. Log Law (and .2mmroughness length) was chosen as the best conservative estimate of the wind scaling relationship.Annual Capacity Factor and Seasonal Capacity Factorand Annual Capacity Factor Percent Changes - fromAverage and from Previous YearCapacity factor is defined as estimated generationexpressed as a percentage of maximum outputfrom installed capacity operating for all hours of agiven time period.Annual Generation per Installed Megawatt andSeasonal Generation per Installed MegawattElectrical energy was estimated from hourlywindspeeds using the power curve for the GE3.6s turbine with 111m diameter, and thensummed to annual or seasonal values.Annual Revenue from Sales of Electricity per InstalledMegawattRevenue was calculated using estimated generationand historical ISO-NE hourly wholesale powerprices. The graph also shows average historicalpower prices.Intra-Annual Variability of Windspeed @ 75m and Variability of Seasonal Windspeed @ 75mThe box plots show statistics of hourly windspeed data for each year and season.The table at the bottom of the fact sheets shows annual values for the main parameters, plus unit revenue, as well asavoided emissions per installed MW. Avoided emissions were calculated from estimated generation and hourlymarginal emissions rates, which were derived from EPA Acid Rain / Ozone Transport Commission (OTC)Program Hourly Emissions Data.2These fourteen facts sheets show selected results for individual data sites. For more information, and forcomparisons across sites, please refer to the main Report and the previous Appendices. The following Fact Sheetsappear in alphabetical order.These fact sheets, as well as the main Report and Appendices, are available via http://lfee.mit.edu/.2The three data sites Jonesport, SE Cape Cod, and Montauk Point are excluded from these calculations as they onlyhave several years of data,MIT LFEE 2006-02 RPOffshore Wind Collaborative – Pilot Research ProgramJan. 2006, pg. App-13
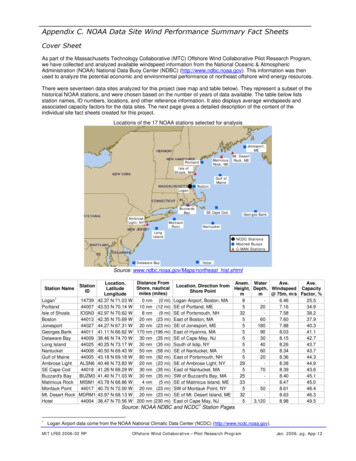
M a s s a c h u s e t t s I n s t i t u t e of T e c h n o l o g yOffshore Wind Collaborative – NOAA Data Site Wind Energy Summary Fact SheetStation: Ambrose Light, NYLocation: 40.5 N, 73.8 WDepth: 0 m (0 ft)Distance from Shore: 20 nm (23 mi)Average Annual Windspeed @ 75m (m/s)10Ave: 8.38Max: 8.72Min: 7.93 StdDev: 0.23 86Averaged from hourly winddata measured at 29m andscaled to hub height of75m using Log Law (.2mmroughness length)42019851990199520002005Annual Capacity Factor (%)Ave: 44.9 60StdDev: 2.050Annual estimated generationexpressed as a percentage of 40maximum output from30installed capacity operatingfor all hours in a given period20Max: 48.1Min: 41.0Annual Generation per Installed Megawatt (GWh/MWi)Max: 4.21Min: 3.59Ave: 3.94StdDev: 5.00Electrical energy estimatedfrom hourly windspeeds usingpower curve for GE 3.6sturbine with 111m diameter543210Annual Revenue from Sales of Electricity per Installed Megawatt (000 /MWi)Ave: 123.0 250StdDev: 46.0 200Calculated using estimatedgeneration and historicalISO-NE hourly energyprices756015045EnergyPrice10030501500Annual Capacity Factor Percent Changes - from Average and from Previous Year (%)20 % - % 15Ave. Prev. Year10Max: 7.1 15.15Min: -8.8-8.90Ave:0.1-5StdDev: 4.56.7-10Cap Fac % - Ave.Cap Fac % - Prev. YearIntra-Annual Variability of Windspeed @ 75m (m/s)40Max: 38.66Min: 0.00Ave: 8.383530Box plots showstatistics of hourlyMaxwindspeed data75th per.for each yearMedian ˇ2520151025th per.5Min0ˇ1985MIT LFEE 2006-02 RP1990ˇ ˇˇ ˇ ˇ ˇ ˇ ˇ ˇ ˇ ˇ ˇ ˇ1995Offshore Wind Collaborative - Pilot Research Program20002004Jan. 2006, pg. App-14( /MWh)Max: 203.0Min: 77.0
Station: Ambrose Light, NYAverage Seasonal Windspeed @ 75m (m/s)14MonthlyMonthly 9952000199520002005Seasonal Capacity Factor (%)These two plots showmonthly values andaverage seasonal valuesfor windspeed andcapacity factor8070605040302010Seasonal Generation per Installed Megawatt (GWh/MWi)2.0Electrical energy estimated1.6from hourly windspeedsusing power curve for GE1.23.6s turbine with 111m0.8diameter, then summed to0.4seasonal values0.0Variability of Seasonal Windspeed @ 75m (m/s)40Max: 38.66Min:0.00Ave:8.38353025Box plots show20statistics of hourlyMax15windspeed data 75th per.for each seasonMedian ˇ 10525th per.Min1990Ave. Ann. WindspeedAnn. Gen (GWh/Capacity FactorAnn. RevenueUnit RevenueCap Fac % -Cap Fac % - 8.90.16.7YearYearMIT LFEE 2006-02 RP019852004Ave. Ann.Ann.Ann.AvoidedEmissionsper NOxInstalledMegawattUnitCap Fac Cap Fac SO2 (tonne)Ann. GenSO2 (kg/MWh)NOx (tonne)(kg/MWh)CO2 (tonne)CO2 (kg/MWh)Windspeed (GWh/ Capacity Revenue Revenue % %MWi)(%)(000 )( /kWh)Ave.YearSO2SO2CO2NOxNOxCO2@@ 75m75mFactor(000 /( /kWh)Ave. Prev. YearMWi)(tonne) (kg/MWh) (tonne) (kg/MWh) (tonne) 2.24.94.53.53.03.1Offshore Wind Collaborative - Pilot Research 799749739767Jan. 2006, pg. App-15
M a s s a c h u s e t t s I n s t i t u t e of T e c h n o l o g yOffshore Wind Collaborative – NOAA Data Site Wind Energy Summary Fact SheetLocation: 42.4 N, 70.7 WDepth: 60 m (197 ft)Distance from Shore: 20 nm (23 mi)Station: BostonAverage Annual Windspeed @ 75m (m/s)10Ave: 7.60Max: 8.29Min: 7.00 StdDev: 0.41 86Averaged from hourly winddata measured at 5m andscaled to hub height of75m using Log Law (.2mmroughness length)42019851990199520002005Annual Capacity Factor (%)Max: 44.8Ave: 37.9 60Min: 32.7StdDev: 3.550Annual estimated generationexpressed as a percentage of 40maximum output from30installed capacity operatingfor all hours in a given period20Annual Generation per Installed Megawatt (GWh/MWi)Max: 3.94Min: 2.86Ave: 3.32StdDev: 11.0Electrical energy estimatedfrom hourly windspeedsusing power curve for GE3.6s turbine with 111mdiameter543210Annual Revenue from Sales of Electricity per Installed Megawatt (000 /MWi)Ave: 102.0 250StdDev: 43.0 200Calculated using estimatedgeneration and historicalISO-NE hourly energyprices756015045EnergyPrice10030501500Annual Capacity Factor Percent Changes - from Average and from Previous Year (%)25 % - % 20Ave. Prev. Year1510Max: 18.3 24.750Min: -13.6 -16.0-5Ave:0.8-10StdDev: 9.2 10.7-15-20Cap Fac % - Ave.Cap Fac % - Prev. YearIntra-Annual Variability of Windspeed @ 75m (m/s)40Max: 32.57Min: 0.00Ave: 7.603530Box plots showstatistics of hourlyMaxwindspeed data75th per.for each yearMedian ˇ2520151025th per.5Min0ˇ ˇ ˇ ˇ ˇ ˇ ˇ ˇ ˇ ˇ ˇ ˇ ˇ ˇ ˇ ˇ ˇ ˇ ˇ ˇ1985MIT LFEE 2006-02 RP19901995Offshore Wind Collaborative - Pilot Research Program20002004Jan. 2006, pg. App-16( /MWh)Max: 177.0Min: 58.0
Station: BostonAverage Seasonal Windspeed @ 75m (m/s)14Monthly 9952000199520002005Seasonal Capacity Factor (%)These two plots showmonthly values andaverage seasonal valuesfor windspeed andcapacity factor8070605040302010Seasonal Generation per Installed Megawatt (GWh/MWi)2.0Electrical energy estimatedfrom hourly windspeedsusing power curve for GE3.6s turbine with 111mdiameter, then summed toseasonal values1.61.20.80.40.0Variability of Seasonal Windspeed @ 75m (m/s)40Max: 32.57Min:0.00Ave:7.60353025Box plots show20statistics of hourlyMax15windspeed data 75th per.for each seasonMedian ˇ 10525th per.MinAve. Ann. WindspeedAnn. Gen (GWh/Capacity rMIT LFEE 2006-02 RP019851990Unit RevenueCap Fac % -Cap Fac % - Ann. Revenue2004Ave. Ann.Ann.Ann.AvoidedEmissionsper NOxInstalledMegawattUnitCap Fac Cap Fac SO2 (tonne)Ann. GenSO2 (kg/MWh)NOx (tonne)(kg/MWh)CO2 (tonne)CO2 (kg/MWh)Windspeed (GWh/ Capacity Revenue Revenue % %MWi)(%)(000 )( /kWh)Ave.YearSO2SO2CO2NOxNOxCO2@@ 75m75mFactor(000 /( /kWh)Ave. Prev. YearMWi)(tonne) (kg/MWh) (tonne) (kg/MWh) (tonne) .23.73.43.02.42.7Offshore Wind Collaborative - Pilot Research 802743738768Jan. 2006, pg. App-17
M a s s a c h u s e t t s I n s t i t u t e of T e c h n o l o g yOffshore Wind Collaborative – NOAA Data Site Wind Energy Summary Fact SheetLocation: 41.4 N, 71.0 WDepth: 0 m (0 ft)Distance from Shore: 30 nm (35 mi)Station: Buzzards BayAverage Annual Windspeed @ 75m (m/s)10Ave: 8.40Max: 8.83Min: 7.73 StdDev: 0.28 86Averaged from hourly winddata measured at 25m andscaled to hub height of75m using Log Law (.2mmroughness length)42019851990199520002005Annual Capacity Factor (%)Max: 48.8Min: 38.660Ave: 45.1StdDev: 2.7 50Annual estimated generationexpressed as a percentageof maximum output frominstalled capacity operatingfor all hours in a given period403020Annual Generation per Installed Megawatt (GWh/MWi)Max: 4.28Min: 3.395Ave: 3.96StdDev: 7.004Electrical energy estimatedfrom hourly windspeeds usingpower curve for GE 3.6sturbine with 111m diameter3210Annual Revenue from Sales of Electricity per Installed Megawatt (000 /MWi)Ave: 126.0 250StdDev: 53.0 200Calculated using estimatedgeneration and historicalISO-NE hourly energyprices756015045EnergyPrice10030501500Annual Capacity Factor Percent Changes - from Average and from Previous Year (%)20 % - % 15Ave. Prev. Year10Max: 8.2 19.95Min: -14.5 -9.70-5Ave:0.7-10StdDev: 6.18.1-15Cap Fac % - Ave.Cap Fac % - Prev. YearIntra-Annual Variability of Windspeed @ 75m (m/s)40Max: 37.76Min: 0.00Ave: 8.403530Box plots showstatistics of hourlyMaxwindspeed data75th per.for each yearMedian ˇ252015ˇˇ ˇ ˇ ˇ ˇ ˇ ˇ ˇ ˇ ˇ ˇ ˇ ˇˇ ˇ ˇ ˇ ˇ1025th per.5Min01985MIT LFEE 2006-02 RP19901995Offshore Wind Collaborative - Pilot Research Program20002004Jan. 2006, pg. App-168( /MWh)Max: 213.0Min: 73.0
Station: Buzzards BayAverage Seasonal Windspeed @ 75m (m/s)14Monthly 9952000199520002005Seasonal Capacity Factor (%)These two plots showmonthly values andaverage seasonal valuesfor windspeed andcapacity factor8070605040302010Seasonal Generation per Installed Megawatt (GWh/MWi)2.0Electrical energy estimated1.6from hourly windspeedsusing power curve for GE1.23.6s turbine with 111m0.8diameter, then summed to0.4seasonal values0.0Variability of Seasonal Windspeed @ 75m (m/s)40Max: 37.76Min:0.00Ave:8.40353025Box plots show20statistics of hourlyMax15windspeed data 75th per.for each seasonMedian ˇ 10525th per.MinAve. Ann. WindspeedAnn. Gen (GWh/Capacity .283.393.967.0048.838.645.12.7YearYearMIT LFEE 2006-02 RP019851990Unit RevenueCap Fac % -Cap Fac % - .03.21.38.2-14.56.119.9-9.70.78.1Ann. Revenue2004Ave. Ann.Ann.Ann.AvoidedEmissionsper NOxInstalledMegawattUnitCap Fac Cap Fac SO2 (tonne)Ann. GenSO2 (kg/MWh)NOx (tonne)(kg/MWh)CO2 (tonne)CO2 (kg/MWh)Windspeed (GWh/ Capacity Revenue Revenue % %MWi)(%)(000 )( /kWh)Ave.YearSO2SO2CO2NOxNOxCO2@@ 75m75mFactor(000 /( /kWh)Ave. Prev. YearMWi)(tonne) (kg/MWh) (tonne) (kg/MWh) (tonne) 2.24.84.43.73.23.3Offshore Wind Collaborative - Pilot Research 799748739767Jan. 2006, pg. App-19
M a s s a c h u s e t t s I n s t i t u t e of T e c h n o l o g yOffshore Wind Collaborative – NOAA Data Site Wind Energy Summary Fact SheetLocation: 38.5 N, 74.7 WDepth: 30 m (98 ft)Distance from Shore: 30 nm (35 mi)Station: Delaware BayAverage Annual Windspeed @ 75m (m/s)10Ave: 8.15Max: 8.75Min: 7.61 StdDev: 0.35 86Averaged from hourly winddata measured at 5m andscaled to hub height of75m using Log Law (.2mmroughness length)42019851990199520002005Annual Capacity Factor (%)Ave: 42.7 60StdDev: 3.250Annual estimated generation40expressed as a percentageof maximum output from30installed capacity operatingfor all hours in a given period20Max: 47.2Min: 37.8Annual Generation per Installed Megawatt (GWh/MWi)Max: 4.14Min: 3.315Ave: 3.74StdDev: 8.004Electrical energy estimatedfrom hourly windspeeds usingpower curve for GE 3.6sturbine with 111m diameter3210Annual Revenue from Sales of Electricity per Installed Megawatt (000 /MWi)Ave: 119.0 250StdDev: 52.0 200Calculated using estimatedgeneration and historicalISO-NE hourly energyprices756015045EnergyPrice10030501500Annual Capacity Factor Percent Changes - from Average and from Previous Year (%)20 % - % 15Ave. Prev. Year105Max: 10.6 19.60Min: -11.5 -17.5-5Ave:0.4-10-15StdDev: 7.4 11.6-20Cap Fac % - Ave.Cap Fac % - Prev. YearIntra-Annual Variability of Windspeed @ 75m (m/s)40Max: 33.79Min: 0.00Ave: 8.153530Box plots showstatistics of hourlyMaxwindspeed data75th per.for each yearMedian ˇ252015ˇ ˇ ˇ ˇ ˇ ˇ ˇ ˇ ˇ ˇ ˇ ˇ ˇ ˇ1025th per.5Min01985MIT LFEE 2006-02 RP19901995Offshore Wind Collaborative - Pilot Research Program20002004Jan. 2006, pg. App-20( /MWh)Max: 211.0Min: 66.0
Station: Delaware BayAverage Seasonal Windspeed @ 75m (m/s)14Monthly 9952000199520002005Seasonal Capacity Factor (%)These two plots showmonthly values andaverage seasonal valuesfor windspeed andcapacity factor8070605040302010Seasonal Generation per Installed Megawatt (GWh/MWi)2.0Electrical energy estimated1.6from hourly windspeedsusing power curve for GE1.23.6s turbine with 111m0.8diameter, then summed toseasonal values0.40.0Variability of Seasonal Windspeed @ 75m (m/s)40Max: 33.79Min:0.00Ave:8.15353025Box plots show20statistics of hourlyMax15windspeed data 75th per.for each seasonMedian ˇ 10525th per.Min1990Ave. Ann. WindspeedAnn. Gen (GWh/Capacity FactorAnn. RevenueUnit RevenueCap Fac % -Cap Fac % - 7.419.6-17.50.411.6YearYearMIT LFEE 2006-02 RP019852004Ave. Ann.Ann.Ann.AvoidedEmissionsper NOxInstalledMegawattUnitCap Fac Cap Fac SO2 (tonne)Ann. GenSO2 (kg/MWh)NOx (tonne)(kg/MWh)CO2 (tonne)CO2 (kg/MWh)Windspeed (GWh/ Capacity Revenue Revenue % %MWi)(%)(000 )( /kWh)Ave.YearSO2SO2CO2NOxNOxCO2@@ 75m75mFactor(000 /( /kWh)Ave. Prev. YearMWi)(tonne) (kg/MWh) (tonne) (kg/MWh) (tonne) 2.24.14.23.53.03.2Offshore Wind Collaborative - Pilot Research 796745737765Jan. 2006, pg. App-21
M a s s a c h u s e t t s I n s t i t u t e of T e c h n o l o g yOffshore Wind Collaborative – NOAA Data Site Wind Energy Summary Fact SheetLocation: 41.1 N, 66.6 WDepth: 90 m (295 ft)Distance from Shore: 170 nm (196 mi)Station: Georges BankAverage Annual Windspeed @ 75m (m/s)10Ave: 8.03Max: 8.72Min: 7.09 StdDev: 0.47 86Averaged from hourly winddata measured at 5m andscaled to hub height of75m using Log Law (.2mmroughness length)42019851990199520002005Annual Capacity Factor (%)Ave: 41.1 60Max: 47.2StdDev: 3.6Min: 34.250Annual estimated generation40expressed as a percentageof maximum output from30installed capacity operatingfor all hours in a given period20Annual Generation per Installed Megawatt (GWh/MWi)Max: 4.14Min: 3.005Ave: 3.60StdDev: 11.04Electrical energy estimatedfrom hourly windspeeds usingpower curve for GE 3.6sturbine with 111m diameter3210Annual Revenue from Sales of Electricity per Installed Megawatt (000 /MWi)Ave: 120.0 250StdDev: 51.0 200Calculated using estimatedgeneration and historicalISO-NE hourly energyprices756015045EnergyPrice10030501500Annual Capacity Factor Percent Changes - from Average and from Previous Year (%)25 % - % 20Ave. Prev. Year1510Max: 14.8 22.750Min: -16.8 -15.2-5Ave:1.2-10StdDev: 8.8 10.3-15-20Cap Fac % - Ave.Cap Fac % - Prev. YearIntra-Annual Variability of Windspeed @ 75m (m/s)40Max: 34.47Min: 0.00Ave: 8.033530Box plots showstatistics of hourlyMaxwindspeed data75th per.for each yearMedian2520151025th per.5Min0ˇ ˇ ˇ ˇ ˇ ˇ ˇ ˇ ˇ ˇ ˇ ˇ ˇ ˇˇ ˇ ˇ ˇ ˇ ˇ1985MIT LFEE 2006-02 RP19901995Offshore Wind Collaborative - Pilot Research Program20002004Jan. 2006, pg. App-22( /MWh)Max: 206.0Min: 69.0
Station: Georges BankAverage Seasonal Windspeed @ 75m (m/s)14Monthly 9952000200519952000Seasonal Capacity Factor (%)These two plots showmonthly values andaverage seasonal valuesfor windspeed andcapacity factor8070605040302010Seasonal Generation per Installed Megawatt (GWh/MWi)2.0Electrical energy estimated1.6from hourly windspeedsusing power curve for GE1.23.6s turbine with 111m0.8diameter, then summed toseasonal values0.40.0Variability of Seasonal Windspeed @ 75m (m/s)40Max: 34.43Min:0.00Ave:8.03353025Box plots showstatistics of hourlyMaxwindspeed data 75th per.for each seasonMedian2025th per.51510MinAve. Ann. WindspeedAnn. Gen (GWh/Capacity rMIT LFEE 2006-02 RP019851990Unit RevenueCap Fac % -Cap Fac % - 3Ann. Revenue2004Ave. Ann.Ann.Ann.AvoidedEmissionsper NOxInstalledMegawattUnitCap Fac Cap Fac SO2 (tonne)Ann. GenSO2 (kg/MWh)NOx (tonne)(kg/MWh)CO2 (tonne)CO2 (kg/MWh)Windspeed (GWh/ Capacity Revenue Revenue % %MWi)(%)(000 )( /kWh)Ave.YearSO2SO2CO2NOxNOxCO2@@ 75m75mFactor(000 /( /kWh)Ave. Prev. YearMWi)(tonne) (kg/MWh) (tonne) (kg/MWh) (tonne) 2.24.34.13.63.13.0Offshore Wind Collaborative - Pilot Research 805748739767Jan. 2006, pg. App-23
M a s s a c h u s e t t s I n s t i t u t e of T e c h n o l o g yOffshore Wind Collaborative – NOAA Data Site Wind Energy Summary Fact SheetLocation: 43.2 N, 69.2 WDepth: 20 m (66 ft)Distance from Shore: 170 nm (196 mi)Station: Gulf of MaineAverage Annual Windspeed @ 75m (m/s)10Ave: 8.36Max: 8.95Min: 7.41 StdDev: 0.47 86Averaged from hourly winddata measured at 5m andscaled to hub height of75m using Log Law (.2mmroughness length)42019851990199520002005Annual Capacity Factor (%)Ave: 44.3 60Max: 48.7StdDev: 3.6Min: 37.250Annual estimated generation40expressed as a percentageof maximum output from30installed capacity operatingfor all hours in a given period20Annual Generation per Installed Megawatt (GWh/MWi)Max: 4.28Min: 3.265Ave: 3.89StdDev: 10.04Electrical energy estimatedfrom hourly windspeeds usingpower curve for GE 3.6sturbine with 111m diameter3210Annual Revenue from Sales of Electricity per Installed Megawatt (000 /MWi)Ave: 128.0 250StdDev: 54.0 200Calculated using estimatedgeneration and historicalISO-NE hourly energyprices756015045EnergyPrice10030501500Annual Capacity Factor Percent Changes - from Average and from Previous Year (%)25 % - % 20Ave. Prev. Year1510Max: 9.8 21.550Min: -16.1 -19.5-5Ave:1.7-10StdDev: 8.19.7-15-20Cap Fac % - Ave.Cap Fac % - Prev. YearIntra-Annual Variability of Windspeed @ 75m (m/s)40Max: 33.64Min: 0.00Ave: 8.363530Box plots showstatistics of hourlyMaxwindspeed data75th per.for each yearMedian2520151025th per.5Min0ˇ ˇ ˇˇ ˇ ˇ ˇ ˇ ˇ ˇ ˇ ˇˇ ˇ ˇ ˇˇ ˇ ˇ ˇ1985MIT LFEE 2006-02 RP19901995Offshore Wind Collaborative - Pilot Research Program20002004Jan. 2006 pg. App-24( /MWh)Max: 226.0Min: 75.0
Station: Gulf of MaineAverage Seasonal Windspeed @ 75m (m/s)14Monthly 9952000199520002005Seasonal Capacity Factor (%)These two plots showmonthly values andaverage seasonal valuesfor windspeed andcapacity factor8070605040302010Seasonal Generation per Installed Megawatt (GWh/MWi)2.0Electrical energy estimated1.6from hourly windspeedsusing power curve for GE1.23.6s turbine with 111m0.8diameter, then summed toseasonal values0.40.0Variability of Seasonal Windspeed @ 75m (m/s)40Max: 33.64Min:0.00Ave:8.36353025Box plots showstatistics of hourlyMaxwindspeed data 75th per.for each seasonMedian2025th per.51510MinAve. Ann. WindspeedAnn. Gen (GWh/Capacity rMIT LFEE 2006-02 RP019851990Unit RevenueCap Fac % -Cap Fac % - 05.52.03.21.39.8-16.18.121.5-19.51.79.7Ann. Revenue2004Ave. Ann.Ann.Ann.AvoidedEmissionsper NOxInstalledMegawattUnitCap Fac Cap Fac SO2 (tonne)Ann. GenSO2 (kg/MWh)NOx (tonne)(kg/MWh)CO2 (tonne)CO2 (kg/MWh)Windspeed (GWh/ Capacity Revenue Revenue % %MWi)(%)(000 )( /kWh)Ave.YearSO2SO2CO2NOxNOxCO2@@ 75m75mFactor(000 /( /kWh)Ave. Prev. YearMWi)(tonne) (kg/MWh) (tonne) (kg/MWh) (tonne) 2.24.74.43.82.93.2Offshore Wind Collaborative - Pilot Research 801746738769Jan. 2006 pg. App-25
M a s s a c h u s e t t s I n s t i t u t e of T e c h n o l o g yOffshore Wind Collaborative – NOAA Data Site Wind Energy Summary Fact SheetLocation: 38.5 N, 70.6 WDepth: 3,120 m (10,234 ft)Distance from Shore: 200 nm (230 mi)Station: HotelAverage Annual Windspeed @ 75m (m/s)Max: 10.44Min: 8.32Ave: 8.98 10StdDev: 0.50 86Averaged from hourly winddata measured at 5m andscaled to hub height of75m using Log Law (.2mmroughness length)42019851990199520002005Annual Capacity Factor (%)Ave: 49.5 60StdDev: 4.150Annual estimated generationexpressed as a percentage of 40maximum output from30installed capacity operatingfor all hours in a given period 20Max: 61.7Min: 43.6Annual Generation per Installed Megawatt (GWh/MWi)Max: 5.40Min: 3.82Ave: 4.34StdDev: 0.365Electrical energy estimatedfrom hourly windspeeds usingpower curve for GE 3.6sturbine with 111m diameter34210Annual Revenue from Sales of Electricity per Installed Megawatt (000 /MWi)250Ave: 142.0Max: 247.0Min: 79.0 StdDev: 61.0 2001506045EnergyPrice10030501500Annual Capacity Factor Percent Changes - from Average and from Previous Year (%)25 % - % 2015Ave. Prev. Year105Max: 24.6 13.40Min: -11.9 -23.0-5-10Ave:- -0.7-15StdDev: 8.28.6-20-25Cap Fac % - Ave.Cap Fac % - Prev. YearIntra-Annual Variability of Windspeed @ 75m (m/s)40Max: 40.24Min: 0.00Ave: 8.983530Box plots showstatistics of hourlyMaxwindspeed data75th per.for each yearMedian ˇ2520151025th per.5Min0ˇ1985MIT LFEE 2006-02 RPˇ ˇ ˇ ˇ ˇ1990ˇˇ ˇ ˇ ˇ ˇ ˇ ˇ ˇ ˇ ˇ ˇ ˇ ˇ1995Offshore Wind Collaborative - Pilot Research Program20002004Jan. 2006, pg. App-26( /MWh)Calculated using estimatedgeneration and historicalISO-NE hourly energyprices75
Station: HotelAverage Seasonal Windspeed @ 75m (m/s)14Monthly ValueWdspd1210Winter (Dec, Jan, Feb)8Spring (Mar, Apr, May)64Fall (Sep, Oct, Nov)20Summer (Jun, Jul, Aug)1985199019952000199520002005Sea
The research team analyzed historical NOAA windspeed data to calculate windspeeds at wind turbine hub height for each individual data site, and to estimate potential generation, revenue, and avoided emissions from locating wind turbines in similar environments. These calculations are based on historical hourly values of NOAA windspeeds, New