Transcription
SolutionsManual-MIT-7x9-Style2015/4/2221:17Page i#1SOLUTIONS MANUAL FOR FUNDAMENTALS OFMACHINE LEARNING FOR PREDICTIVE DATAANALYTICS
SolutionsManual-MIT-7x9-Style2015/4/2221:17Page ii#2
SolutionsManual-MIT-7x9-Style2015/4/2221:17Page iii#3SOLUTIONS MANUAL FOR FUNDAMENTALS OFMACHINE LEARNING FOR PREDICTIVE DATAANALYTICSAlgorithms, Worked Examples, and Case StudiesJohn D. KelleherBrian Mac NameeAoife D’ArcyThe MIT PressCambridge, MassachusettsLondon, England
SolutionsManual-MIT-7x9-Style2015/4/2221:17Page iv#4
SolutionsManual-MIT-7x9-Style2015/4/2221:17Page v#5ContentsNotationNotational ConventionsNotational Conventions for Probabilitiesviiviiix1Machine Learning for Predictive Data Analytics: Exercise Solutions12Data to Insights to Decisions: Exercise Solutions53Data Exploration: Exercise Solutions114Information-based Learning: Exercise Solutions295Similarity-based Learning: Exercise Solutions456Probability-based Learning: Exercise Solutions557Error-based Learning: Exercise Solutions658Evaluation: Exercise Solutions77BibliographyIndex9193
SolutionsManual-MIT-7x9-Style2015/4/2221:17Page vi#6
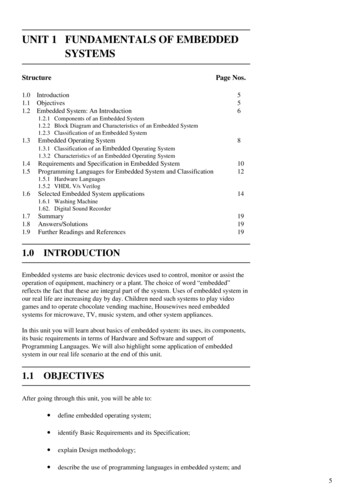
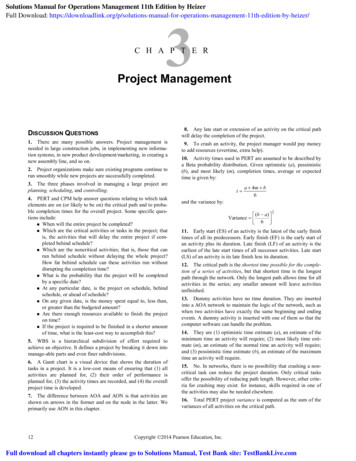
SolutionsManual-MIT-7x9-Style2015/4/2221:17Page vii#7NotationIn this section we provide a short overview of the technical notation usedthroughout this book.Notational ConventionsThroughout this book we discuss the use of machine learning algorithms totrain prediction models based on datasets. The following list explains the notation used to refer to different elements in a dataset. Figure 1[vii] illustrates thekey notation using a simple sample ld62CanadaB6Agnes35SwedenC7Tim32USABDRating AAt4d5 [3]d7Figure 1How the notation used in the book relates to the elements of a dataset.Datasets The symbol D denotes a dataset. A dataset is composed of n instances, pd1 , t1 q to pdn , tn q, where d is a set ofm descriptive features and t is a target feature. A subset of a dataset is denoted using the symbol D with a subscript toindicate the definition of the subset. For example, Df “l represents the subsetof instances from the dataset D where the feature f has the value l.
e viii#8NotationVectors of Features Lowercase boldface letters refer to a vector of features. For example, ddenotes a vector of descriptive features for an instance in a dataset, and qdenotes a vector of descriptive features in a query.Instances Subscripts are used to index into a list of instances. xi refers to the ith instance in a dataset. di refers to the descriptive features of the ith instance in a dataset.Individual Features Lowercase letters represent a single feature (e.g., f , a, b, c . . .). Square brackets rs are used to index into a vector of features (e.g., d rjsdenotes the value of the jth feature in the vector d). t represents the target feature.Individual Features in a Particular Instance di rjs denotes the value of the jth descriptive feature of the ith instance in adataset. ai refers to the value for feature a of the ith instance in a dataset. ti refers to the value of the target feature of the ith instance in a datasetIndexes Typically i is used to index instances in a dataset, and j is used to indexfeatures in a vector.Models We use M to refer to a model. Mw refers to a model M parameterized by a parameter vector w. Mw pdq refers to the output of a model M parameterized by parameters w fordescriptive features d.Set Size Vertical bars refer to counts of occurrences (e.g., a “ l represents thenumber of times that a “ l occurs in a dataset).
7Page ix#9ixFeature Names and Feature Values We use a specific typography when referring to a feature by name in the text(e.g., P OSITION, CREDIT R ATING, and C LAIM A MOUNT). For categorical features, we use a specific typography to indicate the levelsin the domain of the feature when referring to a feature by name in the text(e.g., center, aa, and soft tissue).Notational Conventions for ProbabilitiesFor clarity there are some extra notational conventions used in Chapter ?[?]on probability.Generic Events Uppercase letters denote generic events where an unspecified feature (or setof features) is assigned a value (or set of values). Typically we use lettersfrom the end of the alphabet—e.g., X, Y, Z—for this purpose. We use subscripts on uppercase letters to iterate over events. So, i PpXi qshould be interpreted as summing over the set of events that are a completeassignment to the features in X (i.e., all the possible combinations of valueassignments to the features in X).Named Features Features explicitly named in the text are denoted by the uppercase initialletters of their names. For example, a feature named M ENINGITIS is denotedby M.Events Involving Binary Features Where a named feature is binary, we use the lowercase initial letter of thename of the feature to denote the event where the feature is true and thelowercase initial letter preceded by the symbol to denote the event whereit is false. So, m will represent the event M ENINGITIS “ true, and m willdenote M ENINGITIS “ false.Events Involving Non-Binary Features We use lowercase letters with subscripts to iterate across values in thedomain of a feature.
SolutionsManual-MIT-7x9-Stylex2015/4/2221:17Page x#10Notation So i Ppmi q“ Ppmq Pp mq. In situations where a letter, for example X, denotes a joint event, then i PpXi q should be interpreted as summing over all the possible combinations of value assignments to the features in X.Probability of an Event The probability that the feature f is equal to the value v is written Ppf “ vq.Probability Distributions We use bold notation Ppq to distinguish a probability distribution from aprobability mass function Ppq. We use the convention that the first element in a probability distributionvector is the probability for a true value. For example, the probability distribution for a binary feature, A, with a probability of 0.4 of being true wouldbe written as PpAq “† 0.4, 0.6 .
SolutionsManual-MIT-7x9-Style12015/4/2221:17Page 1#11Machine Learning for Predictive Data Analytics: ExerciseSolutions1. What is predictive data analytics?Predictive data analytics is a subfield of data analytics that focuses on building modelsthat can make predictions based on insights extracted from historical data. To build thesemodels, we use machine learning algorithms to extract patterns from datasets.2. What is supervised machine learning?Supervised machine learning techniques automatically learn the relationship between a setof descriptive features and a target feature from a set of historical instances. Supervised machine learning is a subfield of machine learning. Machine learning is defined asan automated process that extracts patterns from data. In predictive data analytics applications, we use supervised machine learning to build models that can make predictionsbased on patterns extracted from historical data.
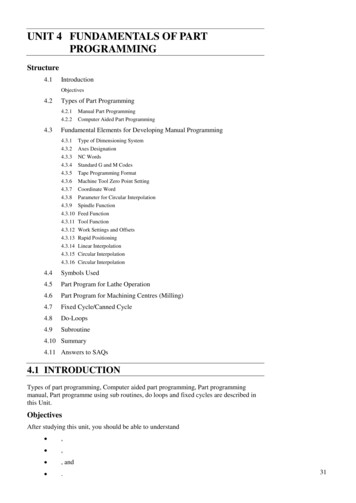
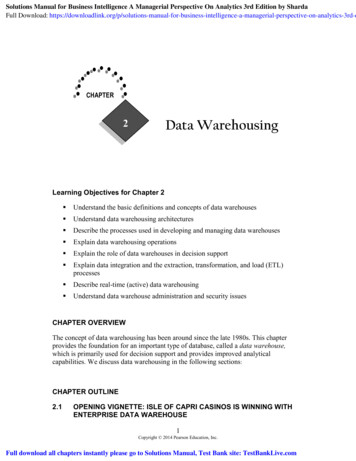
SolutionsManual-MIT-7x9-Style21:17Page 2#12Chapter 1 Machine Learning for Predictive Data Analytics: Exercise Solutions3. Machine learning is often referred to as an ill-posed problem. What doesthis mean?80000 2000040000 060000Income 4000060000 20000Income80000Machine learning algorithms essentially search through all the possible patterns that existbetween a set of descriptive features and a target feature to find the best model that isconsistent with the training data used. It is possible to find multiple models that are consistent with a given training set (i.e., that agree with all training instances). For this reason,inductive machine learning is referred to as an ill-posed problem, as there is typically notenough information in the training data to choose a single best model. Inductive machinelearning algorithms must somehow choose one of the available models as the best. Theimages below show an example of this. All the models are somewhat consistent with thetraining data, but which one is best?20406080100 0204080000 20000 4060Age100 60000Income 20804000060000 060Age40000Income80000Age2000022015/4/2280100 0204060Age80100
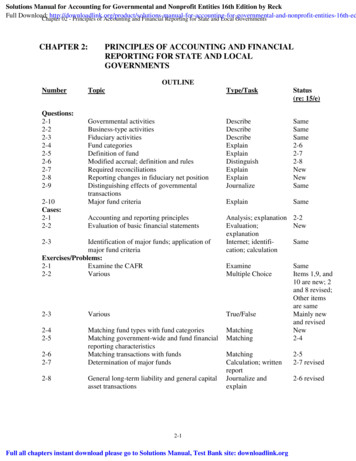
SolutionsManual-MIT-7x9-Style2015/4/2221:17Page 3Solutions to Exercises#1334. The following table lists a dataset from the credit scoring domain wediscussed in the chapter. Underneath the table we list two predictionmodels that are consistent with this dataset, Model 1 and Model 2.IDO CCUPATIONAGEL OAN -S ALARYR ATIOO 04.022.7 03.322.046.953.002.604.5 paydefaultrepayModel 1if L OAN -S ALARY R ATIO 3.00 thenO UTCOME defaultelseO UTCOME repayModel 2if AGE“ 50 thenO UTCOME defaultelse if AGE“ 39 thenO UTCOME defaultelse if AGE“ 30 and O CCUPATION industrial thenO UTCOME defaultelse if AGE“ 27 and O CCUPATION professional thenO UTCOME defaultelseO UTCOME repaya. Which of these two models do you think will generalise better toinstances not contained in the dataset?Model 1 is more likely to generalise beyond the training dataset because it is simpler andappears to be capturing a real pattern in the data.
SolutionsManual-MIT-7x9-Style42015/4/2221:17Page 4#14Chapter 1 Machine Learning for Predictive Data Analytics: Exercise Solutionsb. Propose an inductive bias that would enable a machine learning algorithm to make the same preference choice as you did in part (a).If you are choosing between a number of models that perform equally well then prefer thesimpler model over the more complex models.c. Do you think that the model that you rejected in part (a) of this questionis overfitting or underfitting the data?Model 2 is overfitting the data. All of the decision rules in this model that predict O UTCOME default are specific to single instances in the dataset. Basing predictions on singleinstances is indicative of a model that is overfitting.
SolutionsManual-MIT-7x9-Style22015/4/2221:17Page 5#15Data to Insights to Decisions: Exercise Solutions1. An online movie streaming company has a business problem of growingcustomer churn—subscription customers canceling their subscriptions tojoin a competitor. Create a list of ways in which predictive data analyticscould be used to help address this business problem. For each proposedapproach, describe the predictive model that will be built, how the modelwill be used by the business, and how using the model will help address theoriginal business problem. [Churn prediction] A model could be built that predicts the propensity, or likelihood,that a customer will cancel their subscription in the next three months. This model couldbe run every month to identify the customers to whom the business should offer somekind of bonus to entice them to stay. The analytics problem in this case is to build amodel that accurately predicts the likelihood of customers to churn. [Churn explanation] By building a model that predicts the propensity of customersto cancel their subscriptions, the analytics practitioner could identify the factors thatcorrelate strongly with customers choosing to leave the service. The business couldthen use this information to change its offerings so as to retain more customers. Theanalytics problem in this case would be to identify a small set of features that describethe company’s offerings that are important in building an accurate model that predictsthe likelihood of individual customers to churn. [Next-best-offer prediction] The analytics practitioner could build a next-best-offermodel that predicts the likely effectiveness of different bonuses that could be offeredto customers to entice them to stay with the service. The company could then run thismodel whenever contacting a customer believed likely to leave the service and identifythe least expensive bonus that is likely to entice the customer to remain a subscriberto the service. The analytics problem in this case would be to build the most accuratenext-best-offer model possible. [Enjoyment prediction] Presumably, if the company offered a better service to its customers, fewer customers would churn. The analytics practitioner could build a modelthat predicted the likelihood that a customer would enjoy a particular movie. The company could then put in place a service that personalized recommendations of newreleases for its customers and thus reduce churn by enticing customers to stay with theservice by offering them a better product. The analytics problem in this case would beto build a model that predicted, as accurately as possible, how much a customer wouldenjoy a given movie.2. A national revenue commission performs audits on public companies tofind and fine tax defaulters. To perform an audit, a tax inspector visits a company and spends a number of days scrutinizing the company’saccounts. Because it takes so long and relies on experienced, expert taxinspectors, performing an audit is an expensive exercise. The revenue commission currently selects companies for audit at random. When an auditreveals that a company is complying with all tax requirements, there is asense that the time spent performing the audit was wasted, and more important, that another business who is not tax compliant has been spared aninvestigation. The revenue commissioner would like to solve this problem
SolutionsManual-MIT-7x9-Style62015/4/2221:17Page 6#16Chapter 2 Data to Insights to Decisions: Exercise Solutionsby targeting audits at companies who are likely to be in breach of tax regulations, rather than selecting companies for audit at random. In this waythe revenue commission hopes to maximize the yield from the audits that itperforms.To help with situational fluency for this scenario here is a brief outlineof
SOLUTIONS MANUAL FOR FUNDAMENTALS OF MACHINE LEARNING FOR PREDICTIVE DATA ANALYTICS Algorithms, Worked Examples, and Case Studies John D. Kelleher Brian Mac Namee Aoife D’Arcy The MIT Press Cambridge, Massachusetts London, England. SolutionsManual-MIT-7x9-Style 2015/4/22 21:17 Page iv #4. SolutionsManual-MIT-7x9-Style 2015/4/22 21:17 Page v #5 Contents