Transcription
Speed LimitsA review of evidenceElizabeth BoxEdited by David BaylissAugust 2012
bThe Royal Automobile Club Foundation for Motoring is a transport policyand research organisation which explores the economic, mobility, safety andenvironmental issues relating to roads and their users. The Foundation publishesindependent and authoritative research with which it promotes informed debateand advocates policy in the interest of the responsible motorist.RAC Foundation89–91 Pall MallLondonSW1Y 5HSTel no: 020 7747 3445www.racfoundation.orgRegistered Charity No. 1002705August 2012 Copyright Royal Automobile Club Foundation for Motoring
cSpeed LimitsA review of evidenceElizabeth BoxEdited by David BaylissAugust 2012
iAbout the AuthorsElizabeth BoxElizabeth Box is Head of Research at the RAC Foundation where she isresponsible for commissioning a large programme of research addressingtaxation, mobility, safety, environmental and road performance issues. She hasspoken both nationally and internationally about UK transport policy. She hasalso presented RAC Foundation views to Government and Parliament on arange subjects including school travel, learning to drive, older people’s mobility,traffic signage, road network performance, road safety compliance and futuretransport policy.A transport planner by training, Elizabeth has an MA in Geography from TrinityCollege Cambridge, an MSc in Transport planning from Oxford BrookesUniversity and is an elected member of the Chartered Institute of Highwaysand Transportation. Both the Transport Planning Society and DeHavilland havepresented Elizabeth with awards in recent years for her success in the fields ofresearch and campaigning.Before the RAC Foundation Elizabeth worked for Buckinghamshire CountyCouncil as a Transport Policy Officer, responsible for accessibility planning,the Local Transport Plan and market research.David BaylissDavid Bayliss is a transport planner with over forty years of experience. He haslong had an interest in road pricing and was involved in the SupplementaryLicensing study which was the forerunner of the London Congestion Chargingscheme; he co-authored, with Banks and Glaister, the RAC Foundation’s reportRoads and Reality on pricing and investment for the national road system. Heis a trustee of the RAC Foundation, a visiting professor at Imperial College, andChairman of the Rees Jeffreys Road Fund.
iiContentsSummary and Conclusionsiii1 Introduction12 The Effects of Speed22.1 The benefits of speed32.2 The negative consequences of speed32.3 Environment42.4 Accidents62.5 Noise102.6 Quality of life112.7 Urban sprawl123 The Extent of Speeding133.1 Public attitudes towards speeding143.2 The psychology of speeding174 Speed Limits194.1 History of speed limits204.2 Responsibilities for setting speed limits224.3 Legislative framework for speed limits224.4 Rationale for setting speed limits234.5 Observance of speed limits294.6 Developments in speed limits304.7 Urban speed limits314.8 Motorway speed limits315 Traditional Traffic Management Measures and Speed Control336 Enforcement357 Education378 Road Infrastructure389 Technology4110 The Impact of Vehicle Design on Speed Limits4311 References44
iiiSummary and Conclusions Speed limits are an important dimension of road safety management, butdriving at speeds in excess of the posted speed limit is common in Britain,although this has been reducing over the last decade. Higher average(but not necessarily maximum) speeds mean shorter journey times,which in turn give economic and social benefits from lower costs andgreater accessibility. However, excessive speeding can result in unwantedand costly environmental damage and increased deaths and injuries tomotorists and other road users.The environmental effects of speeding are principally increased noise andemissions of pollutants and greenhouse gases. The main pollutants arecarbon monoxide; hydrocarbons; nitrous oxides; and particulates. Theemission rates of these pollutants are highest in slow-moving traffic andare at their lowest between 25 mph and 55 mph. Above 55 mph they risesteadily with increasing speeds, as do CO2 (carbon dioxide) emissions.Noise from road traffic can be a significant nuisance. At speeds up to25 mph engine noise will usually dominate and this can be made worsewith frequent acceleration and braking. Above this speed tyre noisebecomes increasingly important.Speed is a contributory factor in 27% of deaths from road accidents inBritain, and, with stopping distances trebling between 30 mph and 60 mph,it is estimated that a 5% increase in speed can result in a 10% increase inaccidents and a 20% increase in fatalities – depending on the type of road.Similarly the risk of a pedestrian being killed if hit by a car increases from10% at 30 mph to 70% at 50 mph. A doubling of speed from 30 mph to60 mph will typically increase noise levels by about 10 dB(a).Speeding traffic can also have more subtle effects on the quality ofpeople’s lives by making streets, squares and lanes less attractive placesand consequently impairing the enjoyment of open space and restrictingtravel on foot.Most drivers speed at some time in their lives and some regularly breakspeed limits. In uncongested conditions about half of traffic exceedsthe speed limits on built-up roads and motorways but this proportionhas fallen in recent years. This will have been influenced by changingattitudes to speeding and more effective enforcement of speed limits.Most drivers recognise that speeding contributes to road accidents andthat they themselves sometime drive in excess of the speed limit. This isbecause the posted speed limits are not always seen as appropriate andmany drivers make their own judgement about what is a safe speed todrive – and this is frequently higher than the prevailing legal limit by a fewmiles an hour. Speeding on residential roads is seen as less acceptablethan speeding on motorways – especially by men – and generally youngerdrivers are more likely to speed than older drivers.
iv Speeding is sometimes inadvertent as drivers underestimate thespeed they are travelling at or do not pay sufficient attention to theirspeedometer. Cues from within (e.g. noise levels) and outside the vehicle(e.g. peripheral visual signals) can have an influence on this and theabsence of these may result in misestimation of speeds. But speedingis often deliberate where a driver feels that he or she can travel abovethe speed limit safely because traffic is light, because modern cars aresafer than those on the roads when speed limits were set or because heor she is very familiar with the section of road in question. Also there areoccasions when drivers go faster than they would normally because theyare in a hurry, bored, stressed or simply thrill seeking.Whilst not the only measure to encourage driving at safe speeds, speedlimits are an important means of letting drivers know what is consideredto be the safe maximum speed for the type of road they are driving along.Speed limits were first introduced in Britain in 1865 with the emergenceof mechanically (steam) powered road locomotives and have evolved tothe present regime of national limits of 70 mph on motorways and ruraldual carriageways, 60 mph on rural single carriageways and 30 mphon built-up roads: with lower limits on sections of roads determined bylocal highway authorities. In recent years there have been reviews of howto approach the setting of speed limits with the most recent guidancepublished by the Department for Transport in 2006.
v The Highways Agency is responsible for speed limits on the strategic roadnetwork in England and local highway authorities for other roads. For manyyears the 85th percentile speed has been the touchstone for setting localspeed limits, but this was changed in 2006 to the mean speed – but withsome reference to the 85th percentile where this is abnormally higher thanthe mean. This can be contrasted with approaches in some other countriesin which more attention is paid to the balance of costs and benefits ofspeeds and in particular to Sweden where there is a ‘Vision Zero’ for roaddeaths. Variable speed limits (VSLs) are now used on some sections of busymotorways and lower limits are often employed where there are roadworks.Recent guidance, however, encourages a more measured approachby local highway authorities to determining appropriate speed limits.A range of factors must be taken into account including accident risk,environmental considerations, the types of road users and severance aswell as journey times. In some other countries ‘safe systems’ approachesare used in determining appropriate limits and computer-basedprocedures are employed to help in establishing safe limits.In setting speed limits it must be recognised that they will notautomatically be conformed with and the wider the gap between theposted limit and what drivers judge to be appropriate the lower – all otherthings being equal – the level of compliance will be. Research has foundthat, in the absence of other changes, actual speeds will usually changeby only about a quarter of the change in the posted limits. However, welldesigned accompanying measures and improved levels of enforcementcan help close this gap.Fixed speed limits necessarily do not reflect variable factors such asthe weather, lighting conditions and prevailing traffic conditions, andwider use is made of VSLs in some continental countries. This is clearlya development that deserves careful attention here in Britain, along withsuch innovations as digital maps of speed limits, which can be used bysatellite navigation systems and have the potential to feed into vehicles’automatic speed control systems.Motorway and urban speed limits are currently the subject of a good dealof attention, and 20 mph limits on local urban roads both individuallyand collectively in zones are becoming increasingly common withencouragement from the DfT. Traffic light regimes can be used to regulatethe flow and speed of traffic and give priority to pedestrians but need to bedesigned with care if they are not to encourage non-compliance by drivers.Maximum speed limits on motorways on the Continent are generallybetween 75 mph and 81 mph except in Germany where speeds above81 mph are allowed on some motorways provided it is safe to drive faster.Here in Britain about half of car drivers exceed the 70 mph limit in freeflowing conditions, and if this excess speeding could be eliminated it hasbeen estimated that 18 fatalities and 64 serious injuries could be avoidedeach year. Lowering the limit to 60 mph would avoid a further 94 fatalitiesand 371 serious injuries. There would, however, be costs of ensuringcompliance and increased journey times.
vi To achieve compliance with speed limits needs an effective enforcementregime, which requires clear information on the prevailing limits, effectivedetection and appropriate penalties for infringements. An important aspectof this is the tolerance that is given to offending motorists. In Britain a10% tolerance is normally given for speedometer error plus a 2 mphleeway. Where speeds are detected in excess of this the penalty regimeapplies and can result in a warning, in attendance at a speed awarenesscourse in the case of minor infringements and in fines plus penalty pointsfor more serious offences.Driver education has an important part to play in changing speedingbehaviour, although it should not be automatically assumed that on itsown it will have very large impacts. As part of a broader regime, however,it can help change behaviour as studies of the effects of speed awarenesscourses have shown.The nature of the road layout and environment can also affect speedingbehaviour by creating an awareness of the appropriate speed to driveat. The provision of separate lanes for slower- and faster-moving trafficand roundabouts at grade-level intersections can reduce unsafe speeddifferentials between potential conflicting vehicle movements. As cyclistsare especially vulnerable road users, dedicated cycle lanes can reduceconflicts between fast ‘armoured’ vehicles and slower soft road usersalthough limits on available space mean these are often difficult to provide.The harmful effects of speeding traffic can be particularly marked inresidential areas where a combination of lower speed limits (e.g. 20 mph)and street design (e.g. including road humps and chicanes) can keepspeeds down to an acceptable level. Reductions in accidents from theintroduction of such schemes have averaged 60% with an even higherreduction in fatalities (70%).Improvements in automotive technology over recent decades have hada major significance for speeding. Control and performance of vehiclesare much improved and this reduces the risk of losing control of vehiclesin hazardous circumstances. Also, should there be a crash, the risk ofdeath or serious injury to occupants has been reduced significantly.Whilst cyclists and pedestrians are still vulnerable when struck by a motorvehicle, the design of cars has been improved so that the severity of injuryfrom low-speed impacts has been lowered. Cruise control, intelligentcruise control and speed limiters allow speeds to be regulated by thedriver and are capable of being developed further to allow automaticallyfor some aspects of prevailing conditions (e.g. restricting the maximumspeed to an externally defined limit).
1Speed Limits – A review of evidence1. IntroductionThe speed at which vehicles travel is acontroversial and often discussed topic. Todaythe UK finds itself in the situation where 48%of vehicles exceed the 30 mph speed limitin free-flowing traffic on built-up roads (DfT,2010a), a fall from 53% over the past fiveyears. There is both support and oppositionfor setting and enforcing speed limits.This short report from the RAC Foundation details some ofthe existing research on the impact of speed and speed limits,and illustrates some of the more significant issues that thegovernment’s forthcoming review of speed limits should address.
2Speed Limits – A review of evidence2. The Effects of SpeedTraffic speed has significant effects, bothpositive and negative on the UK’s social,economic and environmental conditions. Inorder to ascertain how and to what extentspeed limits should be managed it is importantto understand the overall consequences ofincreasing or reducing the speed of travel.
The Effects of Speed2.1 The benefits of speedSpeed is often viewed in a negative way, but there are undoubtedly sometangible and positive benefits to increasing the average speed of traffic. Forindividuals this includes reduced journey times and enhanced mobility andaccess options. If car journey speeds were increased by 10% then the areathat could be accessed by the average journey would increase from 55 squaremiles to 67 square miles. There are also benefits for the economy with regardto reducing the time associated with transporting goods and with journeys inthe course of work. However, journey-time savings are often small, particularlyin urban areas where increased running speeds may provide only small savingsas a result of delays at intersections and traffic lights. In his study of the longterm links between transport and the UK’s economic productivity, growth andstability, Sir Rod Eddington concluded that eliminating existing congestionon the road network would be worth some 7–8 billion of GDP per year(Eddington, 2006).However, reducing congestion and increasing average speeds is not mainly amatter of increasing speed limits. For example, if a rise in the motorway speedlimit to 80 mph increased the average speed of free-flowing traffic from 69 mphto 71 mph this would save around 16 million vehicle hours a year – about afifth of what is lost from congestion. Therefore average speeds can be bestincreased by reducing congestion.2.2 The negative consequences of speedSpeed has significant consequences for the environment and road safety,which need to be addressed and recognised when making decisions aboutspeed limits. The negative impacts of speed are particularly felt in urban areas.Fast-moving motor vehicle are hazardous for pedestrians and cyclists; noiseand fumes are a nuisance for both road users and frontagers; and speedingtraffic in residential streets can change their character from ‘places’ to3
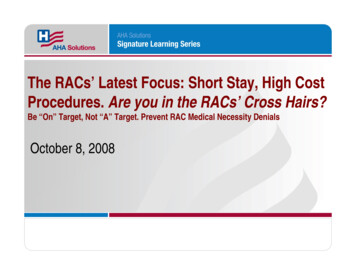
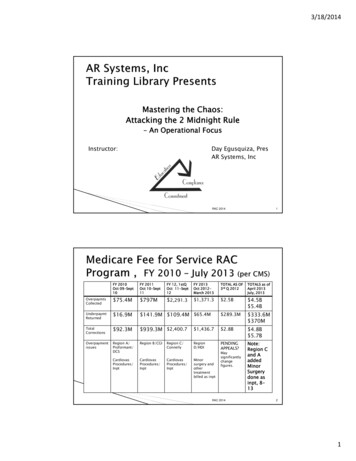
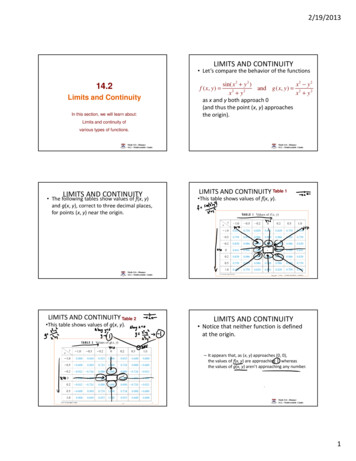
Speed Limits – A review of evidence‘thoroughfares’. On poorly laid-out rural roads excessive speeds increase thefrequency and seriousness of crashes.2.3 EnvironmentRoad vehicle emissions contain a variety of pollutants, which differ dependingon the speed travelled. The major pollutants are: carbon monoxide (CO);hydrocarbons (HC);oxides of nitrogen (NOx); andparticulates (also referred to as particulate matter – PM).As well as being complex, pollutant production processes vary betweendifferent types and vintages of vehicles and are also dependent on the enginetechnologies deployed. NOx are at their greatest at high engine operatingtemperatures, which result from steady high-speed driving. This meansthat speed-reduction strategies can have quite a significant effect on theseemissions, whereas for other pollutants, such as CO and HC, the effect ofspeed reduction is less clear. Generally speaking, as illustrated in Figure 1,HC emissions reduce with speed, whereas CO and PM ones have the lowestemission profiles at medium speeds. However, these emissions have beensteadily falling over the last two decades as shown in Figure 2.Figure 1: Pollutant emissions as a function of 162228344047Speed (mph)Source: DfT (2009)53596571780.0CO2g/kmgCO2/km4COHCNOXPM
The Effects of SpeedFigure 2: UK air pollutant emissions from transport 1990–200911010090PM10Index (1990 96199820002002200420062008Source: DfT (2011e: Table ENV0301b)Carbon dioxide (CO2), the most significant greenhouse gas, is generally producedin proportion to fuel consumption. CO2 emissions also fall steeply as speeds riseto c.20 mph and then change little as speeds increase to 50 mph. Thereafter theystart to rise again, although less rapidly than the decline in the 20 mph range.CO and CO2 emissions are highest at very low travel speeds of around 9 mphor less. In modern vehicles emissions tend to be more sensitive to accelerationthan average speeds, meaning that driving style has a significant impact on theseoverall emissions. It has been estimated that an aggressive driving style can leadto about a 37% increase in fuel consumption (Wengraf, 2012).5
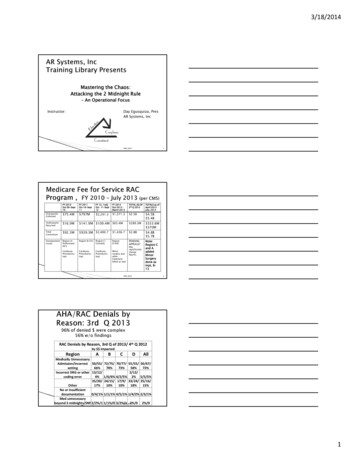
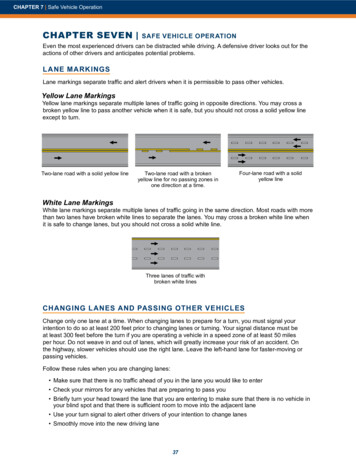
Speed Limits – A review of evidenceFigure 3: The relationship between speed and fuel consumption0.35Fuel consumption (litres per mile)60.300.250.200.150.100.050.000510 15 20 25 30 35 40 45 50 55 60 65 70 75 80 85 90 95 100Speed (mph)Average carAverage LGVSource: Wengraf (2012)Note: LGV – light goods vehicle2.4 AccidentsSpeed is noted as a contributory factor in 27% of all road-related deaths inGreat Britain (DfT, 2010b). Significant research has been conducted over theyears to demonstrate the relationship between speed, accident frequency andseverity, and accident reductions. Many researchers have modelled the specificrelationship between serious injury accidents, fatal accidents and speed.One of the most frequently used and well-regarded sources is Nilsson’s‘Power Model’, which illustrates that a 5% increase in average speed leadsto approximately a 10% increase in all injury accidents and a 20% increase infatal accidents. According to this model – which can be applied to the commonrange of speeds – serious injury accidents are related to the third power of thespeed; and for fatal accidents, the fourth power of the speed (OECD/ECMT,2006). The relative risks of accident involvement from driving faster than theaverage speed of other traffic have also been found to be very similar to thosefrom increases in the blood alcohol content. This is a general relationship andmore recent analysis supports the model but indicates that the powers havebeen decreasing slightly over time and are lower on urban roads than on ruralroads and motorways. The most likely explanation for the slight decrease overtime is improvements in car safety.
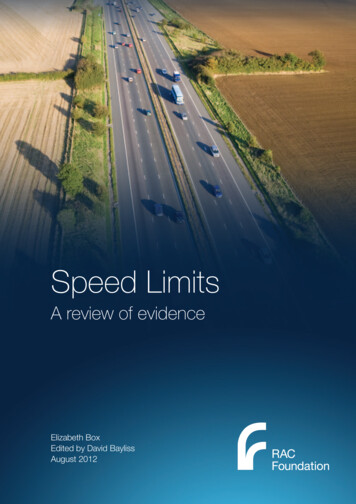
The Effects of SpeedFigure 4: Nilsson’s ‘Power Model’80Change in accidents %60Fatal accidents40Fatal and serious injuryaccidents20All injury accidents0-20-40-60-20-15-10-505101520Change in mean speed %Source: Nilsson (2004)The design of a road and how it is used affect the precise relationship betweenspeed and accident frequency. Complex traffic environments create specificdifficulties for users, which can lead to a higher accident risk; this means thatthe effect of speed tends to be greater. This issue of complexity goes a longway to explain why motorways experience relatively low accident rates incomparison to urban roads.Irrespective of whether speed is a direct contributory factor to a collision, thecollision severity is highly correlated with the vehicle speed at the moment ofimpact, due to the higher momentum. On impact the majority of the change inspeed will be incurred by any lighter crash ‘opponent’ – often the vulnerableroad user or lighter vehicle. It is for this reason that even minor changes inimpact speed can increase the risk of serious injury especially to pedestrians.Travelling at high speeds also reduces the time people have available to processinformation and react. The time needed to respond comprises two elements– driver reaction time and braking distance. Driver reaction time, typically onesecond in standard conditions, is the distance travelled in proportion to thespeed and the braking time. Braking distance is proportional to the square ofspeed (v2) so the distance between starting to brake and coming to a completestop greatly increases with speed (see Figure 5). Consequently the possibility ofavoiding a collision reduces as speed increases.7
8Speed Limits – A review of evidenceFigure 5: Stopping distance at different speeds (including reaction time ofaround one second)20 mph(32 km/h)30 mph(48 km/h)40 mph(64 km/h)50 mph(80 km/h)60 mph(96 km/h)70 mph(112 km/h)6m6m9m 12 metres (40 feet)or three car lengths14 m12 m 36 metres (118 feet)or nine car lengths24 m15 m18 m21 mThe distances shown are a general guide. The distance will depend onyour attention (thinking distance), the road surface, the weatherconditions and the condition of your vehicle at the time. 23 metres (75 feet)or six car lengths 53 metres (175 feet)or thirteen car lengths38 mThinking DistanceBraking DistanceAverage car length 4 metres (13 feet) 73 metres (240 feet)or eighteen car lengths55 m75 m 96 metres (315 feet)or twenety-four car lengthsSource: Directgov (2011)Stopping distances also depend on the condition of the road. They are, forexample, much higher on wet than dry surfaces. At 37 mph the stoppingdistance required on a wet road is more than 25% greater than on a dry road(OECD/ECMT, 2006). Similarly, icy conditions and roads slick from recentprecipitation on a greasy patina can dramatically extend stopping distances.Drivers should be aware of this and make appropriate allowances. Whilststopping on slippery surfaces can be aided by ABS (anti-lock braking system)this will not obviate the need for caution in adverse weather conditions.
The Effects of SpeedThe spread of a driver’s visual field reduces as speed increases. Whentravelling at 25 mph a driver has a field of vision covering 100 degrees. At thisspeed obstacles on the roadside or other potential hazards can be relativelyeasily seen. At over 80 mph the field of vision covers only around 30 degrees,which significantly reduces the capability of a driver to assess potentialdangers (ibid.).Reducing speeds is important because results from on-the-sceneinvestigations of collisions involving pedestrians and cars show that 98% ofpedestrians survive being hit by a car at speeds of 20 mph, whereas only 91%survive at speeds of 30 mph and 60% at 40 mph. By 50 mph survival chancesare down to 30%, and at the present motorway speed limit being hit by a roadvehicle means that death is almost inevitable (see Figure 6).Figure 6: Probability of a fatality from being struck by a ource: OECD/ECMT (2006)Throughout Europe speed is found to be a contributory factor in around a thirdof fatal accidents, and is an aggravating factor in the severity of all accidents.Research on urban roads indicates that the higher the proportion of drivers whoexceed the speed limit the more accidents occur. Individuals driving at morethan 10–15% above the average speed of the traffic around them are also muchmore likely to be involved in an accident (OECD/ECMT, 2006). Kloeden et al.(2002) also found a higher accident risk for fast drivers, particularly in urbanareas.Figure 7 indicates that driving at a slower speed than average traffic does notsignificantly increase risk. However, other studies have found that for non-injury9
Speed Limits – A review of evidenceaccidents there is similar accident risk for the ‘slowest drivers’ and ‘fastestdrivers’. There are potential safety implications associated with other driversovertaking a slower-than-average driver. Ultimately it is useful to try and reducethe speed differential between vehicles in the traffic stream as this is expectedto bring significant accident reductions. Where the speed differential betweendifferent road users is very large, such as heavy goods vehicles (HGVs) onthe motorway or cyclists on certain roads, it can be appropriate to provideseparate or segregated infrastructure. In addition to the increased risk tovulnerable road users there is added risk of serious injury to occupants of lightvehicles in collisions with a heavier vehicle (OECD/ECMT, 2006).Figure 7: Relative injury accident rate on urban roads and rural roads forvehicles going faster and slower than average speedUrban roads (60 km/h)35Rural roads (80–120 km/h)30Relative crash rate102520151050-10-505101520Vehicle speed in relation to average traffic speed (in km/h)Source: Based on Kloeden et al. (1997, 2001 and 2002)2.5 NoiseSpeed has a significant effect on the noise that a vehicle emits. Driving atlower speeds will generally reduce noise levels, although the frequency ofaccelerations can be more important than mean speed. Noise is created bythe power units on vehicles, tyre-road interaction and air displacement. Athigher speeds tyre noise dominates that created by vehicles. Tyre-road noiseincreases strongly with speed, around 12 dB(A) for a doubling of speed.The effects of acceleration and deceleration on noise are typically modestat speeds over 30 mph, but higher at speeds lower than this. This hasimplications for the use of chicanes and speed humps at lower speeds, where
The Effects of Speedvehicles are required to accelerate and decelerate.Figure 8 illustrates the relative contributions of engine and rolling noise to thetotal noise emitted in relation to speed. As a doubling of noise levels representsa tenfold increase in sound energy both scales are in effect logarithmic.Engine noise dominates up to about 25 mph, when tyre noise becomes moreimportant. At higher speeds tyre and then air displacement noise become themain source of traffic noise. This general picture is of course affected by designfeatures such as the type and condition of road surface and the degree ofstreamlining of vehicles.Figure 8: Engine noise and rolling noise as a function of speedStabilised speed / gear change at 1800 rpm85EngineRollingTotal m/hSource: INRETS (2005)2.6 Quality of lifeTraffic speed has been found to affect the assessments people make aboutquality of life. Although real, this tends to be difficult to quantify particularlyas it is those outside the vehicle that tend to be affected. Injuries and noise11
12Speed Limits – A review of evidenceare effects that are relatively easy to measure, whereas it is much harderto quantify the fear associated with discouraging people from walking andcycling. Physical activity is known to be important in reducing heart diseaseand strokes (Batty & Lee, 2004), and if the perceived danger from fast-movingtraffic dissuades some people from walking and cycling it could affect theirhealth and general fitness. It can also reduce walking to school, which canaffect children now and in future. Speeding traffic can also lead to communityseverance, and this tends to have a disproportional effect on older people andyoung children.2.7 Urban sprawlNational or regional changes in speed management policy may permanentlychange the accessibility of locations in relation to each other. Over time theaverage travel time budget for individuals has remained fairly static at aroundone hour a day (DfT, 2011c), which is why an increase in speed can lead topeople travelling longer distances as well as making different decisions abouthome and work locations. Whilst increasing speeds may be of economicbenefit through producing wealth as the result of more economic activity, thesame process can lead to locational sprawl and its associated disadvantages(OECD/ECMT, 2006). In the long run speed management can affect trafficvolumes on the roads, but there is no evidence to suggest that a reduction inspeed can help to reverse the process of urban sprawl.
13Speed Limits – A review of evidence3. The Extent of SpeedingSpeeding is something that most drivers admitto doing at some time, and just less than half ofcars travelling on the roads in free-flowing trafficexceed the limit. In the ten years from 1999 thepercentage of vehicles exceeding the 30 mphspeed limit on built-up roads in Great Britainfell for every vehicle type. The mos
speed limits, but this was changed in 2006 to the mean speed - but with some reference to the 85th percentile where this is abnormally higher than . speeds and in particular to Sweden where there is a 'Vision Zero' for road deaths. Variable speed limits (VSLs) are now used on some sections of busy .