Transcription
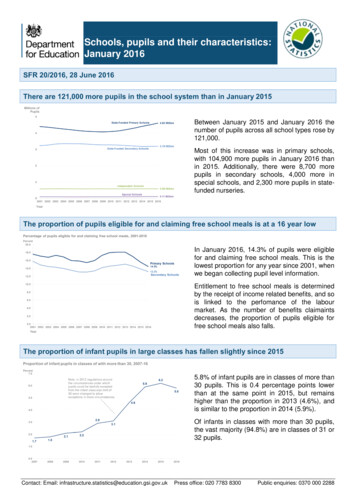
Schools, pupils and their characteristics:January 2016SFR 20/2016, 28 June 2016There are 121,000 more pupils in the school system than in January 2015Between January 2015 and January 2016 thenumber of pupils across all school types rose by121,000.Most of this increase was in primary schools,with 104,900 more pupils in January 2016 thanin 2015. Additionally, there were 8,700 morepupils in secondary schools, 4,000 more inspecial schools, and 2,300 more pupils in statefunded nurseries.The proportion of pupils eligible for and claiming free school meals is at a 16 year lowIn January 2016, 14.3% of pupils were eligiblefor and claiming free school meals. This is thelowest proportion for any year since 2001, whenwe began collecting pupil level information.Entitlement to free school meals is determinedby the receipt of income related benefits, and sois linked to the perfomance of the labourmarket. As the number of benefits claimaintsdecreases, the proportion of pupils eligible forfree school meals also falls.The proportion of infant pupils in large classes has fallen slightly since 20155.8% of infant pupils are in classes of more than30 pupils. This is 0.4 percentage points lowerthan at the same point in 2015, but remainshigher than the proportion in 2013 (4.6%), andis similar to the proportion in 2014 (5.9%).Of infants in classes with more than 30 pupils,the vast majority (94.8%) are in classes of 31 or32 pupils.Contact: Email: s office: 020 7783 8300Public enquiries: 0370 000 2288
Contents1.Pupil Numbers (Tables 1a-e) . 32.School Numbers (Tables 2a-2f) . 33.Free School Meals Eligibility (Table 3) . 64.Ethnic Group (Table 4) . 85.First Language (Table 5). 106.Class Sizes (Table 6) . 117.Special Educational Needs (SEN) (table S1-S4). 138.Accompanying tables . 159.Further information is available . 1710.National Statistics . 1911.Technical information . 1912.Using this data . 1913.Get in touch . 19Media enquiries . 19Other enquiries/feedback . 19About this releaseThis statistical first release (SFR) provides the number of schools and pupils in schools in England, using data fromthe January 2016 School Census.Breakdowns are given for school types as well as for pupil characteristics including free school meal eligibility, Englishas an additional language, ethnicity and special educational need (SEN).This release also contains information about average class sizes.In this publicationThe following tables are included in the SFR:National tables (Excel .xls)Local authority tables (Excel .xls)Cross border movement tablesUnderlying data (open format .csv and metadata .txt)The accompanying quality and methodology information document, provides information on the data sources, theircoverage and quality and explains the methodology used in producing the data.FeedbackWe are changing how our releases look and welcome feedback on any aspect of this document ontact: Email: s office: 020 7783 8300Public enquiries: 0370 000 2288
1. Pupil Numbers (Tables 1a-e)There are a total of 8.56 million pupils in schools in England. This is an increase of just over 121,000 pupils,or 1.4%, since 2015. The total number of pupils has grown every year since 2009 and there are now467,265 more pupils in schools than at that point.The number of pupils in state funded primary schools rose – as it has done over the last seven years.There are 104,860 more pupils than in 2014, and 537,820 more since 2009.The number of pupils in state funded secondary schools rose for the second year in a row. As theincreased number of primary pupils since 2009 move into secondary schools, we expect to see thenumber of secondary pupils continue to rise in the coming years.Table A: Primary, secondary and all age pupils:Schools in England, 2006-2016YearState FundedPrimarySchoolsState FundedSecondarySchoolsAll SchoolTypes 703,193,4208,559,540Source: School Census2.School Numbers (Tables 2a-2f)Between January 2015 and January 2016 there was a net increase of 12 state funded primary schools and20 state funded secondary schools. However, the total number of schools has decreased by 29 to 24,288because there has been a decline in the number of pupil referral units (9 fewer than in 2015) andindependent schools (46 fewer).The decline in the number of schools, coupled with the increase in pupil numbers, means schools arelarger on average. An average state-funded primary school now has 275 pupils on its roll, up from 269pupils in January 2015. While there was a slight fall in the number of pupils between 2006 and 2009, theaverage size of primary schools has not decreased in any year since 2006, when this was 237 pupils.Since 2011, the average size of primary schools has increased by 30 pupils, which is the equivalent of oneextra class per school. Schools which teach both primary and secondary year groups are growing innumber. In January 2015 there were 110 such schools, but this figure has increased to 141 schools inJanuary 2016.Just over 3 million pupils now attend academies and free schools. Just over 2 million of these are insecondary schools (65.6% of all secondary school pupils) and 0.9 million in primary schools (19.5% of allprimary school pupils). The remainder are in special and alternative provision academies.3
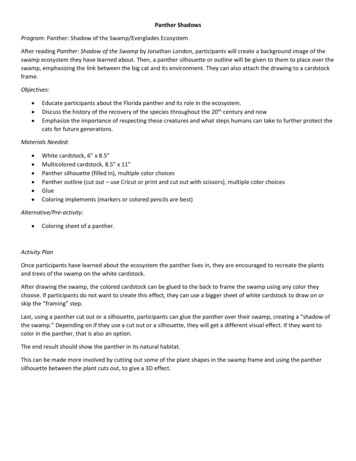
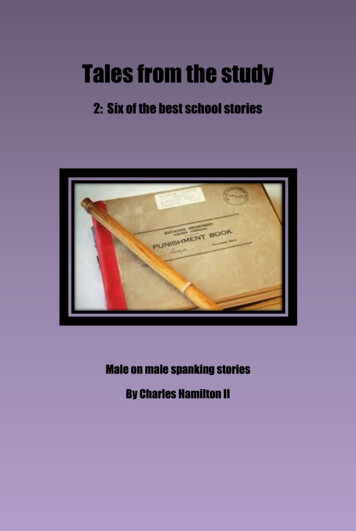
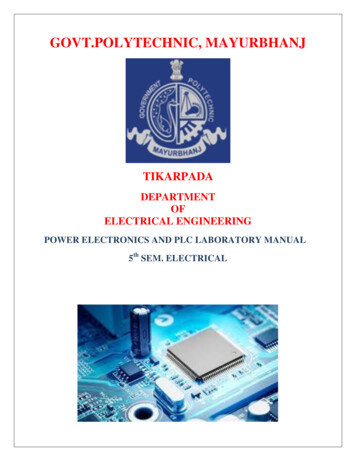
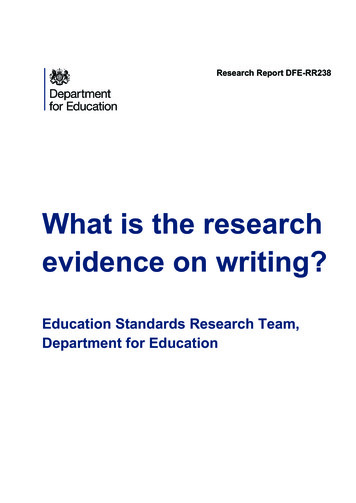
Figure A: The numbers of primary and secondary schools in England have slightly increased in the last year,but have declined over a longer period of time.Number of schools in England, 1947-2016Source: EdubaseFigure B: The average size of a state-funded secondary school has recently declined but historically grewmore quickly than other school typesAverage pupil numbers in state-funded primary and secondary schools in England, 1947-2016.Source: School Census4
Types of SchoolsState-funded primary schools and state-funded secondary schools – these include community schools,foundation schools, voluntary aided, voluntary controlled, academies and free schools. Primary schools typicallyaccept pupils aged 5-10 and secondary schools aged 11 and above, but there are increasing numbers of All-throughschools, who take pupils of all compulsory school ages.State-funded special schools – these are schools which provide tailored provision for pupils with special educationalneeds.Alternative provision – these are education settings for children unable to attend a mainstream school. Localauthority maintained establishments providing alternative provision are often referred to as pupil referral units. Thereare also an increasing number of alternative provision academies and free schools.Independent schools and Non-maintained special schools – these are registered schools which do not receivegovernment funding. They often charge fees for pupils to attend.State-funded nursery – these are nurseries maintained by the local authority in which they operate. Other nurseries,such as private and voluntary nurseries, are not included in the school census. Schools with a nursery attached willcomplete the school census as a school rather than as a nursery.5
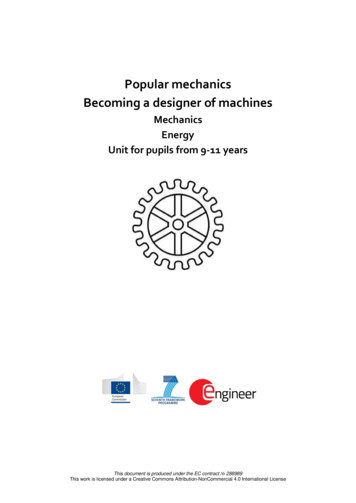
3. Free School Meals Eligibility (Table 3)In primary schools, 14.5% of pupils are known to be eligible for, and claiming, free school meals. Insecondary schools, it is 13.2%.The proportion of pupils known to be eligible for, and claiming, free school meals is now at its lowest levelin any year since 2001, when pupil level information was first collected.Figure C: Rates of eligibility for free school meals have declinedPercentage of pupils eligible for and claiming free school meals, 2001-2016 (excludes universal infant free schoolmeals – see note)Source: School CensusNote: this chart is based on those pupils who are eligible for and claiming free school meals based on household income andbenefit receipt. It does not include pupils claiming a free school meal under the Universal Infant Free School Meals programme,where free school meals are available to all infant pupils regardless of household income or benefit claims.Free School Meals: who was entitled?In England in January 2016, children in state-funded schools were entitled to receive free schools meals if a parent orcarer were in receipt of any of the following benefits: Income Support Income-based Jobseekers Allowance Income-related Employment and Support Allowance Support under Part VI of the Immigration and Asylum Act 1999 the guaranteed element of State Pension Credit Child Tax Credit (provided they were not also entitled to Working Tax Credit and had an annual gross income of nomore than 16,190, as assessed by Her Majesty’s Revenue and Customs) Working Tax Credit run-on - paid for 4 weeks after you stop qualifying for Working Tax Credit During the initial roll out of the benefit, Universal Credit (this category was added from 29 April 2013)Additionally, all infant pupils were entitled to receive free school meals from September 2014.6
Fewer pupils are eligible for, and claiming, free school meals (FSM) than in January 2015, in both primaryand secondary schools. The decline is occurring in a large number of areas across the country (table 8a/b)and is related to there being fewer parents than previously claiming the benefits which would make theirchildren eligible for free school meals.Primary academies have a higher than average rate of eligibility, with 16.3% of pupils eligible for FSM,compared with 14.5% across all schools. Conversely, secondary academies have a lower than averagerate, with 12.5% of pupils eligible compared with 13.2% across all schools.The reverse is the case in free schools – primary free schools have an FSM eligibility rate below thenational average, with secondary schools above the average. In primary free schools, 13.5% of pupils areeligible for FSM and in secondary free schools 14.6% of pupils are eligible.7
4. Ethnic Group (Table 4)Minority Ethnic OriginThose pupils of compulsory school age and above who have been classified according to their ethnic group and are ofany origin other than White British are defined as being of minority ethnic origin.The proportion of pupils from minority ethnic origins has been rising steadily since 2006.In primary schools, 31.4% of pupils are of minority ethnic origins, an increase from 30.4% in January 2015.Minority ethnic pupils made up 71% of the increase in pupil numbers in primary schools between 2015 and2016.In secondary schools, 27.9% of pupils are of minority ethnic origins, an increase from 26.6% in 2015.Figure D: The percentage of pupils from minority ethnic origins has increased2006-2016, primary and secondary schools in EnglandSource: School Census8
Figure E: Percentage of pupils by ethnic originState funded schools in England, 2016State-funded primary schoolsWhite BritishWhite Non-BritishAsianBlackMixedChineseAny otherUnclassifiedState-funded special schools67.97.110.65.75.70.41.80.7White BritishWhite Non-BritishAsianBlackMixedChineseAny otherUnclassifiedState-funded secondary schoolsWhite BritishWhite Non-BritishAsianBlackMixedChineseAny otherUnclassified70.95.410.35.54.70.41.61.2White BritishWhite Non-BritishAsianBlackMixedChineseAny otherUnclassified71.64.09.56.75.20.31.51.3Pupil Referral Units70.96.34.27.17.70.11.52.1Source: School CensusWhite non-British pupils now make up 7.1% of the population in primary schools. This is the third year thatthis ethnic group is the second largest ethnic minority, after pupils from Asian origins, who continue to bethe largest minority. Pupils from Asian and Black origins are the two largest minorities in secondaryschools. In pupil referral units, there are a greater proportion of black pupils and pupils from mixed ethnicorigins than in mainstream schools, and a smaller proportion of Asian pupils.9
5. First Language (Table 5)English as an additional languageA pupil is recorded to have English as an additional language if they are exposed to a language at home that is knownor believed to be other than English. This measure is not a measure of English language proficiency or a good proxyfor recent immigration.In primary schools, 20.1% of pupils are exposed to a language known or believed to be other than Englishin their home. This is an increase of 0.7 percentage points since January 2015, and the figure has beensteadily rising since 2006.In secondary schools, 15.7% of pupils are exposed to a non-English language in their home. This rate hasalso steadily increased over the last ten years and by 0.7 percentage points since January 2015.Figure F: The percentage of pupils exposed to a language other than English at home has increasedPupils with English as an additional language 2010-2016, primary and secondary schoolsSource: School CensusWhy the increase?This is related to the increase in the number of pupils. This increase in pupil numbers is largely driven by an increasein birth rate (rather than direct current immigration), which is driven in turn by an increase in the number of childrenborn to non-UK born women (compared to those born to UK-born women). The number of children born to non-UKborn women more than doubled between 1999 and 2010 (the years in which most children currently in schools wereborn) and the numbers of non-UK born women also increased. For more information about this, we recommend thefollowing links:England and Wales birth summary tables 2009, ONSParents’ country of birth statistics 2010, ONSEngland and Wales birth summary tables 2010, ONSHave women born outside the UK driven the rise in UK births since 2001?, ONS10
6. Class Sizes (Table 6)Large ClassesAn infant class is described as ‘large’ when it exceeds the statutory limit of 30 pupils. There are no formal policyrestrictions on any other class sizes.The number and proportion of infants in large classes fell between 2015 and 2016. In 2016, 5.8% of infantswere in classes with more than 30 pupils, compared with 6.2% in 2015 and 5.9% in 2014. This correspondsto 95,210 infants in class with more than 30 pupils in 2016, compared with 100,765 in 2015 and 93,345 in2014.The average infant class size remains at 27.4. This is now unchanged since 2014, but has increased from25.6 in 2006.Figure G: Average one-teacher class sizes2006-2016, Infant, primary and secondary classes in EnglandSource: School CensusLawful and unlawful infant classesThe School Admissions (Infant Class Sizes) (England) Regulations 2012 prescribe certain limited circumstances inwhich pupils may be admitted as lawful exceptions to the infant class size limit of 30 for one-teacher classes. Thismeans that a class of, for example, 32 pupils is lawful if two or more of those pupils have been admitted under lawfulexceptions. If fewer than two have been admitted as lawful exceptions then the class is termed ‘unlawful’.The figures on lawful and unlawful large classes were previously de-designated as National Statistics by UK StatisticsAuthority and are pending reassessment following improvements made to their collection. UKSA are currentlyassessing these statistics with a view to re-establishing their status as National Statistics. Until then they are publishedseparately at Annex A.11
More than half of one-teacher key stage 1 classes have either 29 or 30 pupils in them, with 43.9% of infantpupils in classes of exactly 30 pupils. However, of those infant classes with more than 30 pupils, roughly95% of pupils are in classes of 31 or 32 pupils and larger classes are uncommon.Figure H: Infant pupils are most commonly in classes of exactly 30Infant class size distribution, January 201612
7. Special Educational Needs (SEN) (table S1-S4)SEN ClassificationsSEN Support – Extra or different help is given from that provided as part of the school’s usual curriculum. The classteacher and SEN co-ordinator (SENCO) may receive advice or support from outside specialists.SEN with a statement or Education, Health and Care (EHC) Plan – A pupil has a statement of SEN or an EHC planwhen a formal assessment has been made. A document is in place that sets out the child’s need and the extra helpthey should receive.The number and proportion of pupils classified with SEN has been in decline since 2010. There are now1.23 million pupils with SEN in schools in England. This represents 14.4 percent of all pupils. Of these,237,000 have a statement of SEN or EHC plan (2.8% of all pupils) and 992,000 have SEN Support (11.6%of all pupils).The decline in the number of pupils with SEN has is made up entirely of those who do not have a statementof SEN or EHC plan. There has been a continuing decline since 2010, but this has hastened since 2014.Figure I: SEN without statement / EHC plan continues to fall while the number of pupils with a statement orEHC plan remains at a consistent levelNumber of pupils with SEN by classification, 2006-16Classification ChangesThere were changes to the classification of type of need in 2015: the previous code of ‘Behaviour, emotional andsocial difficulties’ (BESD) was removed. A new code ‘Social, emotional and mental health’ (SEMH) has beenintroduced, although this is not a direct replacement. The code ‘SEN support but no specialist assessment of type ofneed’ was also introduced in 2015.Due to changes in the coverage and classification, it is not possible to produce a direct comparison with data for yearsprior to 2015.13
Figure J: Autism Spectrum Disorder is the most common primary need with statements or EHC plansSEN by primary type of need, January 2016 (Percentages)Primary Type of NeedStatement of SEN or EHC Plan15.6Specific Learning Difficulty4.026.8Moderate Learning Difficulty13.40.4Severe Learning Difficulty13.10.1Profound & Multiple Learning Difficulty4.517.3Social, Emotional and Mental Health12.3SEN Support20.9 Speech, Language and Communications Needs 14.01.6Hearing Impairment2.70.9Visual Impairment1.50.2Multi- Sensory Impairment0.32.2Physical Disability5.84.7Autistic Spectrum Disorder25.95.5Other Difficulty/Disability2.4CoveragePrimary need is collected for those pupils on SEN support or with a statement of SEN / EHC plan.Moderate learning difficulty is the most common type of need. In January 2016, 24.2% of all pupils withSEN were recorded as having a moderate learning difficulty. This is more prevalent among those pupilswith SEN Support, with 26.8% of those pupils having this as their primary need, compared to 13.4% ofthose with a statement of SEN or EHC plan.Autism spectrum disorder is the most common need for those with a statement or EHC plan. More than aquarter of pupils (25.9%) with a statement of SEN or EHC plan in January 2016 had Autistic SpectrumDisorder listed as their primary type of need. This primary type of need is much less common in pupils withSEN support, with only 4.7% of pupils with SEN support having this type of need.More statistics related to SEN are available in the special educational needs statistics collection on thedepartment’s website, and more general information about the SEND reforms of 2014 is available in theSEND code of practice and related guides to support education settings.14
8. Accompanying tablesThe following tables are available in Excel format on the department’s statistics website:National tables1Pupil numbers by age and gender1a State-funded primary, secondary and special schools: Number of pupils by age and gender, January 20161b Pupil referral units and local authority alternative provision: Number of pupils by age and gender, January20161c Independent schools: Number of pupils by age and gender, January 20161d State-funded primary, secondary and special schools: Number of pupils by national curriculum year group andgender, January 20161e Pupil referral units and alternative provision academies and free schools: Number of pupils by nationalcurriculum year group and gender, January 20162Pupil numbers by school characteristics2a All schools: Number of schools and pupils by type of school, January 2003 to 20162b Academies: Number of schools and pupils by type of academy, January 20162c State-funded primary and secondary schools: Number of schools by their status and religious character,January 20162d State-funded primary and secondary schools: Number (headcount) of pupils by the status and religiouscharacter of their schools, January 20162e State-funded primary and secondary schools: Number of schools by size, January 20162f3State-funded primary and secondary schools: Number (headcount) of pupils by the size of their school,January 2016Free School Meals eligibility3a State-funded nursery, state-funded primary, state-funded secondary, special schools, pupil referral units andlocal authority alternative provision: Number of pupils known to be eligible for and claiming free school mealsby age and gender, January 20163b State-funded nursery, state-funded primary, state-funded secondary, special schools and pupil referral units:Number of pupils known to be eligible for and claiming free school meals based on Performance Tables,January 20163c Academies: Number of pupils eligible for and claiming free school meals, January 20163d Infant Pupils: Number of free school meals taken on census day, January 20164Ethnicity4a State-funded primary, secondary, and special schools, pupil referral units and local authority alternativeprovision: Number and percentage of pupils by ethnic group, January 20164b Primary academies: Number and percentages of pupils by ethnic group, January 20164c Secondary academies: Number and percentages of pupils by ethnic group, January 20164d Special and alternative provision academies: Number and percentages of pupils by ethnic group, January20165First Language5a State-funded primary, secondary, special schools and pupil referral units: Number and percentage of pupils byfirst language, January 20165b Academies: Number and percentage of pupils by first language, January 20166Class Sizes6a State-funded schools: Key stage 1 and 2 classes, as at January each year, January 2006 to 20166b State-funded primary and secondary schools: Classes as taught, as at January each year, January 2006 to201615
SPupils with SEN and SEN by primary type of needS1 All Schools: Pupils with statements of SEN or EHC plans, January 2007 to 2016S2 State-funded primary, state-funded secondary and special schools: number and percentage of pupils byprimary type of needS3 Academies: Pupils with special educational needs (SEN), by type of academyS4 Academies - Pupils With Special Educational Needs (Sen), Time SeriesLocal authority and regional tables7Pupil Numbers by Pupil Characteristics7a All schools: Number of schools by type of school, by local authority area and region in England, January 20167b All schools: Number (headcount) of pupils by type of school, by local authority area and region in England,January 20167c State-funded secondary schools: Number of schools and number (headcount) of pupils, by admissions policy,by local authority area and region in England, January 20167d State-funded primary schools: Number of schools and number (headcount) of pupils, by the status of theirschool, by local authority area and region in England, January 20167e State-funded secondary schools: Number of schools and number (headcount) of pupils, by the status of theirschool, by local authority area and region in England, January 20167fState-funded primary schools: Number of schools and number (headcount) of pupils, by the religiouscharacter of school, by local authority area and region in England, January 20167g State-funded secondary schools: Number of schools and number (headcount) of pupils, by the religiouscharacter of school, by local authority area and region in England, January 20168Free School Meals Eligibility8a State-funded nursery and state-funded primary schools: Number of pupils taking free school meals andnumber of pupils eligible for and claiming free school meals by local authority area and region in England,January 20168b State-funded secondary schools: Number of pupils taking free school meals and number of pupils eligible forand claiming free school meals by local authority area and region in England, January 20168c Special schools: Number of pupils taking free school meals and number of pupils eligible for and claiming freeschool meals by local authority area and region in England, January 20168d Pupil referral units and alternative provision academies and free schools: Number of pupils eligible for andclaiming free school meals by local authority area and region in England, January 20168e All Schools: Number and percentage of infant pupils taking a free school meal on census day, by localauthority area and region in England, January 20169Ethnicity9a State-funded primary schools: Number of pupils by ethnic group, by local authority area and region inEngland, January 20169b State-funded secondary schools: Number of pupils by ethnic group, by local authority area and region inEngland, January 20169c Special schools: Number of pupils by ethnic group, by local authority area and region in England, January201610First Language10a State-funded primary schools: Number and percentage of pupils by first language, by local authority area andregion in England, January 201610b State-funded secondary schools: Number and percentage of pupils by first language, by local authority areaand region in England, January 201610c Special schools: Number and percentage of pupils by first language, by local authority area and region inEngland, January 201616
10d State-funded primary schools: Classes as taught by key stage of pupils, by local authority area, by region,January 2016SPupils with special educational needs and type of needS5 Number of pupils with Special Educational Needs (SEN) based on where the pupils attends school inEngland, January 2016S6 State-funded primary schools: number and percentage of pupils with SEN by primary type of need in England,January 2016S7 State-funded secondary schools: number and percentage of pupils with SEN by primary type of need inEngland, January 2016S8 Special schools: number and percentage of pupils with SEN by primary type of need in England, January 2016When reviewing the tables, please note that: Some tables show all pupils, others only those of compulsory school ageEthnicity and language tables only include pupils of compulsory school age and above. Free school mealstables are based on the performance tables methodology and include full time pupils aged 0-15 and part timepupils aged 5-15. Other tables include pupils of all ages. There are four schools which do not complete the school censusThese are all 16-19 schools, which instead complete the individualised learner record (ILR). These schoolsare counted in school number counts, but not pupil number counts. Pupils are counted based on enrolment statusPupils are counted at the school where they have either a sole or main dual registration. This means that pupilreferral units and alternative provision institutions often teach more pupils than listed in these tables, but theiradditional pupils are counted at another institution. These figures are a snapshotFigures are correct as at January 2016. They may no longer reflect the situation on an individual school leveldue to pupil movements.9. Further information is available School level figuresThese can be found in the underlying data tables as follows:Statistics coveredUnderlying data file name suffixPupil numbers by age, free schoolmeals eligibility, ethnicity, firstlanguage, and SEN provisionSchools Pupils UDPupil numbers by nationalcurriculum year groupSchools NCYear UDClass SizesSchools Classes UDAlternative provision at LA levelLA level APcensus UD17
Cross border movement tablesThese figures show the number of pupils residing in one local authority, but attending school inanother. Figures are available both at national level and a local authority matrix level. Figures from previous yearsYou can find analogous figures from previous years within the statistical collection ‘Statistics: schooland pupil numbers’. More SEN dataMore statistics related to SEN are available in the special educational needs statistics collection onthe department’s website.’Special Educational Needs: England 2016’ will be published 21st July 2016. In addition to the SENtables included in this publication, the July publication will include other SEN statistics that have notbeen incl
The proportion of pupils eligible for and claiming free school meals is at a 16 year low In January 2016, 14.3% of pupils were eligible for and claiming free school meals. This is the lowest proportion for any year since 2001, when we began collecting pupil level information. Entitlement to free school meals is determined