Transcription
November 2018THE PARTNERSHIP FOR LENDINGIN UNDERSERVED MARKETSIncreasing Minority Entrepreneurs’ Access to CapitalBY CAROLYN SCHULMAN
November 2018THE PARTNERSHIP FOR LENDINGIN UNDERSERVED MARKETSIncreasing Minority Entrepreneurs’ Access to CapitalBY CAROLYN SCHULMAN
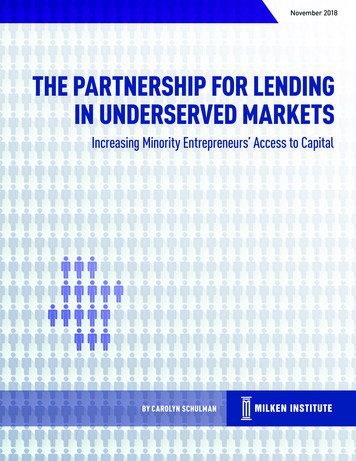
ABOUT USABOUT THE MILKEN INSTITUTEThe Milken Institute is a nonprofit, nonpartisan think tank determined to increaseglobal prosperity by advancing collaborative solutions that widen access tocapital, create jobs, and improve health. We do this through independent, datadriven research, action-oriented meetings, and meaningful policy initiatives.ABOUT THE CENTER FOR REGIONAL ECONOMICSThe Center for Regional Economics promotes prosperity and sustainable growth byadvancing regional competitiveness and job creation. Through research and policyanalysis, stakeholder engagement, and programming, we develop and supportactionable economics and policy solutions for local, statewide, and regional leaders.ABOUT THE CENTER FOR FINANCIAL MARKETSThe Center for Financial Markets promotes financial market understanding andworks to expand access to capital, strengthen—and deepen—financial markets,and develop innovative financial solutions to the most pressing global challenges. 2018 Milken InstituteThis work is made available under the terms of the Creative Commons Attribution-NonCommercialNoDerivs3.0 Unported License, available at creativecommons.org/licenses/by-nc-nd/3.0/
CONTENTSINTRODUCTION.1PART I: LANDSCAPE OVERVIEW.2ECONOMIC INDICATORS.2African American Small Businesses. 3Hispanic Small Businesses. 4ACCESS TO CAPITAL.5Startup Financing. 5New Funding Relationships for Growing Businesses. 7SBA Lending. 8CULTURAL BARRIERS.10Generational Poverty. 10Educational Attainment. 11Professional Training and Management Deficits. 11Country of Origin and Immigration Status. 12Discrimination. 12Trust Gap. 13PART II: THE PARTNERSHIP FOR LENDING IN UNDERSERVED MARKETS.14STRATEGIES TO OVERCOME MINORITY CAPITAL ACCESS BARRIERS.15PILOT CITIES.17Market Research. 17Local Policy. 19Technical Assistance. 19Lender Engagement. 20Execution and Implementation. 22NATIONAL EFFORTS.23Federal and Congressional Engagement. 23Comment Letters. 23Research and Initiatives. 23Milken Institute Events. 24CONCLUSION.25ABOUT THE AUTHOR.27ACKNOWLEDGMENTS.28
INTRODUCTIONThe contribution and importanceof small businesses to the nation’seconomy is well-researched andunderstood; for minority-owned smallbusinesses the impact and significanceis even greater. Not only do minorityowned small businesses help drivejob creation, raise wages, and elevatebetter standards of living, they alsooffer a critical pathway for Blackand Hispanic populations to closethe racial wealth gap. An increasein entrepreneurship among peopleof color can create income for bothentrepreneurs and the people ofcolor who work at the businesses.Yet, starting a new firm or growing anestablished business requires capital,and Black and Hispanic businesses havehigher barriers to accessing capital.In 2016, the Milken Institute and the U.S. Small BusinessAdministration (SBA) formed the Partnership for Lendingin Underserved Markets (PLUM) to develop actionablesolutions to long-standing barriers that constrainminority entrepreneurs from accessing capital to startand grow businesses. The Institute committed to forminglocal programs in Baltimore and Los Angeles and toundertaking national research and policy efforts. The SBAprovided seed funding and on-the-ground support.The Institute has been documenting preliminaryfindings and outcomes, as well as publishing publiccomment letters and other research.1 In the followingpages, we summarize research, activities, and outcomesin hopes that local and national leaders can buildon the PLUM foundation and continue to advancesolutions to increase minority access to capital.1.The PLUM library of publications is available at http://www.milkeninstitute.org/plum.THE PARTNERSHIP FOR LENDING IN UNDERSERVED MARKETS1
PART I: LANDSCAPE OVERVIEWIt is important to assess the currentstate of minority-owned smallbusinesses and minority entrepreneurs’success in securing financing, as wellas what forces may be driving theircapital outcomes. This understandingcreates a foundation to unpack theissues and pain points and begin toidentify and advance solutions.Economic IndicatorsAbundant, successful, and growing minority-ownedsmall businesses are a critical component to minorityeconomic development. The stronger minority-ownedbusinesses perform, the more likely they are to employadditional workers and pay them decent wages. These arestraightforward economic indicators that speak tothe health and potential of minority communities.In the following pages we analyze data from theU.S. Census Bureau, Federal Reserve Bank of New York,and the U.S. Small Business Administration. With thePLUM program, the focus was employer firms vs. nonemployer firms (sole proprietors), which generate incomefor individual owners but do not generate the multipliereconomic effects that come with job creation. Therefore,we filtered census data by private (not publicly-held)employer firms with less than 500 employees. The FederalReserve data only looked at private employer firms withless than 500 employees. The SBA’s small business sizestandards (the largest that a business can be and still qualifyas a small business for federal government programs)vary by industry. Therefore, to avoid drawing erroneousconclusions, readers should note that the definition ofa small business is not consistent across data sets.Also, the Milken Institute recognizes there is adifference between “Hispanic” and “Latino” designations.However, the U.S. Census Bureau is now using “Hispanic”and “Latino” interchangeably (as they do “Black” and“African American”). Because this is a data-drivenreport, we have followed suit throughout the report.2THE PARTNERSHIP FOR LENDING IN UNDERSERVED MARKETS
AFRICAN AMERICAN SMALL BUSINESSESAfrican Americans would have small business parity if theirshare of small businesses (and sales, employee count, andannual payroll) relative to all U.S. small businesses (and totalsales, total employees, and total annual payroll) approximatedtheir share of the total population ages 18 years and older.Looking at the population that is18 years and older more accuratelycaptures entrepreneurs when theyare forming businesses vs. lookingat the total population. However,doing so may understate disparities,particularly among Latinos, whosepopulation skews younger thanother populations.In 2016, African Americans ages 18 years and older made up12.8 percent of the population. Parity would be about 13 percentof all U.S. businesses being owned by African Americans andBlack-owned firms accounting for approximately 13 percentof total sales, total employees, and total payroll. As seen inFigure 1, the metrics are nowhere close to parity. Black-ownedsmall businesses are significantly underrepresented. 2Also, as the Black and Latinopopulations age into their businessowning years, measures of businessparity could worsen if minoritiescontinue to grow their share of thetotal population and capital accessbarriers remain.SHARE OF BUSINESS METRICS TO SHARE OF POPULATIONFIGURE 1Population 18 yearsBLACK-OWNEDSMALL BUSINESSDISPARITIES, 2016Firms (#)2.2%Sales ( 000s)1%Employees (#)2%Annual Payroll ( 000s)0%2%4%12.8%6%1.4%8%10%12%14%16%18%Source: U.S. Census Bureau.Black-owned small businesses are gaining ground in their share ofemployees and payroll, but their number of firms are not keeping pacewith population changes, and they are losing share of sales. Between 2007and 2016, the Black population ages 18 years and older grew 22.3 percent(see Figure 2, “% Δ Count”), and the share of the Black population ages18 years and older to the total population 18 years and older increased10.3 percent (see Figure 2, “% Δ Share”).3 The number of Black-owned smallbusinesses did not increase nearly as much as the population (1.1 percent vs.22.3 percent), and the change in the share of Black-owned small businessesto all small businesses did not exceed the share of the population increase(9.3 percent vs. 10.3 percent).4 Increases in the share of employees(20.4 percent) and payroll (26 percent) did exceed population growth,but the share of sales dropped 9.6 percent. Despite employing a greatershare of workers and paying a greater share of total payroll, it is a troublingindicator of future success that African American-owned small businessdid not capture a greater share of total firms and lost share of sales.2.“2016 Population Data,” American FactFinder, Population Division, U.S. Census Bureau, jsf/pages/productview.xhtml?src bkmk; “2016 AnnualSurvey of Entrepreneurs,” American FactFinder, U.S. Census Bureau, index.xhtml.3.“National Intercensal Tables: 2000-2010, 2007 Population Data,” U.S. Census l; “2016 Population Data.”4.“2007 Survey of Business Owners,” American FactFinder, U.S. Census Bureau, index.xhtml; “2016 Annual Survey of Entrepreneurs.”THE PARTNERSHIP FOR LENDING IN UNDERSERVED MARKETS3
CHANGE IN NUMBER AND SHARE OF BUSINESSES VS. POPULATIONFIGURE 2BLACK-OWNED SMALLBUSINESSES AREGAINING GROUNDIN THEIR SHARE OFEMPLOYEES ANDPAYROLL, BUT THEIRNUMBER OF FIRMS ARENOT KEEPING PACEWITH POPULATIONCHANGES, ANDTHEY ARE LOSINGSHARE OF SALES.BLACK-OWNEDSMALL BUSINESSPERFORMANCEOVER TIME% Δ SHARE% Δ COUNT70%49.7%60%50%40%30%24.6%22.3%20%20.4%10.3% 9.3%1.1% 4.7%10%26%0%-10%2007-2016-9.6%Population 18 yearsFirms (#)Sales ( 000s)Employees (#)Annual Payroll ( 000s)Source: U.S. Census Bureau.SHARE OF BUSINESS METRICS TO SHARE OF POPULATIONFIGURE 3HISPANIC-OWNEDSMALL BUSINESSDISPARITIES, 2016Population 18 yearsFirms (#)Sales ( 000s)6.3%3.4%Employees (#)4.9%Annual Payroll ( 000s)0%2%4%6%15.7%8%3.8%10%12%14%16%18%HISPANIC SMALL BUSINESSESIn 2016, Latinos ages 18 years and olderaccounted for 15.7 percent of the U.S.population. Like with African Americanowned small businesses, Latino-ownedsmall businesses were underrepresentedacross all metrics (see Figure 3).5However, Latinos are faring better thanAfrican Americans; between 2007 and 2016,Hispanic-owned small businesses increasedtheir share of total firms and employees,and paid a greater share of total payroll(see Figure 4).6 While not enough to exceedthe increase in the share of populationgrowth, Hispanic-owned small businessesalso increased their share of total sales.Source: U.S. Census Bureau.CHANGE IN NUMBER AND SHARE OF BUSINESSES VS. POPULATIONFIGURE 4HISPANIC-OWNEDSMALL BUSINESSPERFORMANCEOVER TIME49.7%60%50% 34.6%40%30%33%21.3%“2016 Population Data;” “2016 Annual Survey of Entrepreneurs.”6.“National Intercensal Tables: 2000-2010, 2007 PopulationData;” “2016 Population Data;” “2007 Survey of BusinessOwners;” “2016 Annual Survey of Entrepreneurs.”4THE PARTNERSHIP FOR LENDING IN UNDERSERVED 2016Population 18 yearsFirms (#)5.% Δ SHARE% Δ COUNT70%Source: U.S. Census Bureau.Sales ( 000s)Employees (#)Annual Payroll ( 000s)
Access to CapitalFIGURE 5To advance minority economic development,more minorities need to be able to start andgrow businesses in their communities. However,this requires access to capital, and Black andHispanic business owners have higher barriersto accessing safe and affordable capital.STARTUPFINANCING, 2016SOURCES OF CAPITAL USED TO START OR ACQUIRE A BUSINESSAll firmsBlackHispanicPersonal/family savings of owner(s)Business loan from a bank orfinancial institutionPersonal credit card(s)carrying balancesPersonal/family assets otherthan savings of owner(s)Personal/family home equity loanSTARTUP FINANCINGIn 2016, general trends across race and ethnicitywere similar in terms of sources of capital usedto start or acquire a business, but, accordingto the “2016 Annual Survey of Entrepreneurs,”African American and Latino business ownerswere more likely to report using personaland family savings, credit cards, and othersources of capital to start their businessescompared to all business owners, who reportedhigher use of business loans (see Figure 5).7Business credit card(s)carrying balancesBusiness loan/investmentfrom family/friendsGovernment-guaranteed business loanfrom a bank or financial institutionBusiness loan from federal, state,or local governmentInvestment by venture capitalist(s)Grants0% 10% 20% 30% 40% 50% 60% 70%Source: U.S. Census Bureau.DATA DEFICITIt is very important to note that the public doesnot have anywhere near sufficient access tosmall business financing data, including lendingdata. There are no reporting requirements forsmall business lending similar to those formortgage lending under the Home MortgageDisclosure Act (HMDA), and the CommunityReinvestment Act (CRA) does not requiresmall and mid-sized banks, credit unions, orcommunity development financial institutionsto report their small business lending activity.Section 1071 of the 2010 Dodd-Frank WallStreet Reform and Consumer Protection Act(Dodd-Frank Act) amended the Equal CreditOpportunity Act to address this issue by requiringfinancial institutions to compile, maintain, andreport information concerning credit applicationsmade by women-owned, minority-owned, andsmall businesses. However, the rule has yet tobe implemented, and in 2017 the U.S. Departmentof the Treasury recommended repealing theapplication of Section 1071. Also in 2017,the Consumer Financial Protection Bureau didput out a request for comment regarding thesmall business lending market to “inform theBureau’s work on the business lending datacollection rulemaking to implement section1071.” In October of 2018 they put smallbusiness lending data collection on their listof “long-term actions.”* Without completedata, it is difficult to identify lending andother financing deficits to minority groups.*U.S. Consumer Financial Protection Bureau, “Request for Information Regarding the Small Business Lending Market” available online arket/;U.S. Department of the Treasury, “A Financial System That Creates Economic Opportunities, Banks and Credit Unions, Report to President Donald J. Trump”available online at es/Documents/A%20Financial%20System.pdf.7.“2016 Annual Survey of Entrepreneurs.”THE PARTNERSHIP FOR LENDING IN UNDERSERVED MARKETS5
AFRICAN AMERICANSAND LATINOS PAYMORE TO BORROWCAPITAL TO START ANDEXPAND BUSINESSESCOMPARED TOTHE POPULATIONAT LARGE.The average interest rate (AIR) on a conventional business loanis around 3 to 5 percent.8 Unlike the annual percentage rate (APR),the effective annual interest rate (AIR) does not include any closing,origination or other fees, which will increase the cost of the loan.Still, the APR is 14 percent on a business credit card and 16.5 percent forall credit cards.9 Consequently, African Americans and Latinos end uppaying more to borrow capital compared to the population at large.The most oft-cited reasons banks decline Black and Hispanic borrowers’loan applications in the first place are lower credit scores, lower networth, and lack of assets.10 Of the more than 8,000 firms surveyedfor the “2017 Small Business Credit Survey,” the majority of all firms(68 percent) reported a low-risk credit score vs. the majority of Blackand Hispanic firms who reported medium- or high-risk scores(see Figure 6).11 African American business owners reported the mostmedium- (45 percent) and high-risk (25 percent) credit scores of all.SELF-REPORTED CREDIT SCORESFIGURE 6CREDIT RISK, 2017High credit risk100%Medium credit riskLow credit risk6%12%90%25%25%80%70%37%60%Online and alternative lenders maybe able to provider lower-cost smallbusiness loans—average APRs fromthese lenders range from 7 percentto over 100 percent. When comparedto banks, online and alternativelenders often have higher interestrates because they have fewereligibility requirements and fasterunderwriting processes, potentiallyreturning a credit decision withina few hours. Due to the reducedeligibility criteria, online lendersappeal to businesses and borrowersthat are less bankable, such asstartups, low revenue businesses,or applicants with lower creditscores. There are many safealternative and online lenders,however, the risk of predatorylending can be much higher.40%THE PARTNERSHIP FOR LENDING IN UNDERSERVED MARKETS68%30%51%20%30%10%0%AllBlackHispanicLow risk: business score of 80-100 or personal score of 720 Medium risk: business score of 50-79 or personal score of 620-719High risk: business score of 1-49 or personal score less than 620Source: Federal Reserve Bank of New York.8.“Survey of Terms of Business Lending - E.2,” FRB: E.2 Release—Survey of Terms of BusinessLending—Current Release, /default.htm.9.Kelly Dilworth, “Rate Survey: Average Card APR Breaks New Record, Climbing to 17.08 Percent,”CreditCards.com, October 24, 2018, report.php.10. Robert W. Farlie and Alicia M. Cobb, “Disparities in Capital Access between Minority and Non-MinorityOwned Businesses: The Troubling Reality of Capital Limitations Faced by MBEs,” Minority BusinessDevelopment Agency, U.S. Department of Commerce (2010), t.pdf.11.645%50%“2017 Small Business Credit Survey,” Federal Reserve Bank of New York, iness-credit-survey-2017.
NEW FUNDING RELATIONSHIPSFOR GROWING BUSINESSESResults of the “2017 Small Business Credit Survey” reinforcefindings from the “2016 Annual Survey of Entrepreneurs”—banks and other financial institutions were less likely toapprove loans and lines of credit, especially for the fullamount requested, for young and established minority firmscompared to all firms (see Figure 9).13 Approval rates varybetween the two surveys, as both are based on a sampleof business owners self-reporting their activities andoutcomes. The trends, however, are consistent. Moreover,the primary explanation for credit denials were poor orlimited credit and insufficient collateral (see Figure 10).14The same capital access trends that appeared for startupsappear for young and established firms seeking to form newfunding relationships. Based on self-reported activities andoutcomes in the “2016 Annual Survey of Entrepreneurs,”among young firms (those that have been in business for lessthan two years) and established firms (those that have beenin business for more than two years), Black- and Hispanicowned businesses were more likely to apply for credit cardsand less likely to receive small business or home equity loanscompared to all businesses (see Figure 7 and Figure 8).12 Reading the graphs: While more young Black-owned firms applied for a loan from a bank (18.9 percent) than the average acrossall young firms (14.5 percent), a smaller share received the full amount requested (46.9 percent vs. 65.4 percent).25%PERCENT APPLIEDNEW FUNDINGRELATIONSHIPS,DEBT, YOUNGFIRMS, 2016BANKS, CREDIT UNIONS,OR OTHER FINANCIAL %HISPANIC2.6%ALLPercent 4%15%18.9%BLACKCREDIT CARDS66.8%57.6%46.9%10%HOME EQUITY LOANS IN THENAME OF BUSINESS OWNERSALLBLACK80%60%40%20%PERCENT RECEIVEDFIGURE 70%HISPANICReceived total amount requestedSource: U.S. Census Bureau.25%PERCENT APPLIEDNEW FUNDINGRELATIONSHIPS,DEBT, ESTABLISHEDFIRMS, 2016BANKS, CREDIT UNIONS,OR OTHER FINANCIAL INSTITUTIONS20%77.8%61.2%15%10%12.3%5%0%ALLHOME EQUITY LOANS IN THENAME OF BUSINESS OWNERS59.3%3%2.1%HISPANICALLBLACKPercent REDIT %HISPANIC40%20%PERCENT RECEIVEDFIGURE 80%Received total amount requestedSource: U.S. Census Bureau.FIGURE 9LOAN AND LINE OFCREDIT APPROVALRATES, ic66% Note: Inclusive in the small business credit survey’s definitionof loans or lines of credit are SBA loans or lines of credit,business loans, lines of credit, home equity lines of credit,personal loans, mortgages, and auto or equipment loans.47%23%RECEIVING SOME FINANCING28%RECEIVING FULL AMOUNT REQUESTEDSource: Federal Reserve Bank of New York.13. “2017 Small Business Credit Survey.”12. “2016 Annual Survey of Entrepreneurs.”14. “2017 Small Business Credit Survey.”THE PARTNERSHIP FOR LENDING IN UNDERSERVED MARKETS7
FIGURE 10REASON FORCREDIT DENIAL37%50%40% 27%30%20%10%0%LOW CREDIT SCOREAll45%45%36%35%30%INSUFFICIENT CREDIT HISTORY35%29%22%INSUFFICIENT COLLATERALHispanic30%24%23%Black17%WEAK BUSINESS PERFORMANCE16%TOO MUCH DEBT ALREADYSource: Federal Reserve Bank of New York.CROWDFUNDING PLATFORMS25%PERCENT APPLIEDNEW FUNDINGRELATIONSHIPS,EQUITY ANDALTERNATIVECAPITAL, YOUNGFIRMS, 2016ANGEL SPANIC1.4%2%0.8%ALLBLACKPercent appliedHISPANIC1%0.7%ALLBLACK1%PERCENT RECEIVEDVENTURE CAPITALISTSFIGURE 110%HISPANICReceived total amount requestedSource: U.S. Census Bureau.PERCENT APPLIEDNEW FUNDINGRELATIONSHIPS,EQUITY ANDALTERNATIVE CAPITAL,ESTABLISHED FIRMS,2016VENTURE CAPITALISTS25%ANGEL INVESTORSCROWDFUNDING %0%ALLBLACKHISPANIC0.4%ALLPercent appliedBLACKHISPANIC0.7%0.3%ALLBLACK0.6%PERCENT RECEIVEDFIGURE 120%HISPANICReceived total amount requestedSource: U.S. Census Bureau.While application rates were much lower for newfunding relationships with equity and alternative capitalproviders compared to debt providers, across the board,young Black-owned firms did have more success thanall firms, including Hispanic-owned firms, in securingnew funding relationships with angel investors andthrough crowdfunding platforms (see Figure 11). Hispanicowned firms were consistently the least likely to securenew funding relationships with equity and alternativeproviders, despite applying the most (on par with AfricanAmerican-owned firms for crowdfunding applications).Again, regardless of race or ethnicity, application rates forequity and alternative capital providers were even loweramong older firms (see Figure 12). However, establishedHispanic-owned firms were more successful than young Latinofirms in securing new relationships, and established Black-8THE PARTNERSHIP FOR LENDING IN UNDERSERVED MARKETSowned firms outperformed all firms, including Latino-ownedfirms, in securing new funding from crowdfunding platforms.Given minorities’ reported relative success securingequity capital, a deeper understanding of what drovethese results could lead to more accessible avenues tocapital for this population of small business owners.SBA LENDINGIn the U.S. Census Bureau’s “2016 Annual Survey ofEntrepreneurs,” less than 2 percent of business ownersreported using government-guaranteed business loansfrom a bank or other financial institution, including SBAguaranteed loans, to start or acquire a business.1515. “2016 Small Business Credit Survey,” Federal Reserve Bank of New York,April 2017, lbusiness/2016/SBCS-Report-EmployerFirms-2016.pdf.
7(a) loans are the SBA’s basic andmost popular lending product.A 7(a) loan does not comedirectly from the SBA. Instead,an authorized SBA lender makesthe loan and the SBA guaranteesa portion of it, mitigating much ofthe risk for the lender. With theSBA guaranteeing a large portionof the loan, the lender can lowerits lending standards, allowingsmall business owners with lessestablished credit histories or lesscash flow to qualify. If purchasing abusiness or getting working capitalis the goal, the SBA 7(a) loan islikely the better tool.504 loans can only be used forcommercial real estate or long-termmachinery purchases. 504 loanscome with lower interest rates anddown payments than 7(a) loans,making them a much better choiceif a business owner plans on buyingproperty or investing in equipment.While 7(a) loans can also be usedfor real estate, they are bettersuited for other uses such asworking capital, debt refinancing orsupplies and inventory because theyoffer more flexibility in their terms.There was little variance across race and ethnicity (see Figure 5).Still, given insufficient small business lending data, comparing theshare of SBA loans for which data is available among Black andHispanic business owners to the share of the population provides alens into lending parity and is indicative of disparities in capital access.Accounting for 12.8 percent of the 18 years and older population,African Americans would have had SBA lending parity if theyreceived roughly 13 percent of SBA loans, by both count (numberof loans) and volume (dollar value of loans). Hispanic parity wouldhave been about 16 percent. As seen in Figure 13, across lendingproducts, African Americans and Latinos were underrepresented.16SHARE OF SBA LOANS TO SHARE OF POPULATION 18 YEARSFIGURE 13SBA LENDING,201618%16% 12.8%14%12%10%8%3.7%2.2% 1.7% 1.5%6%4%2%0%BLACKPopulation 18 years504 Count (#)15.7%8.6%7.7%5.6%6%HISPANIC7(a) Count (#)504 Volume ( )7(a) Volume ( )Source: SBA.On a positive note, Latinos are capturing more of the SBA lending market.Between 2012 and 2016, their share of SBA lending products (in termsof count and volume) increased at a higher rate than the increase intheir share of the population (see Figure 14).17 Less encouraging, AfricanAmericans only gained ground in their share of the number of 7(a) loansreceived—albeit a large increase (33.3 percent). However, their share of thelending volume of 7(a) and 504 loans and count of 504 loans all remainedflat at about 2 percent, which translated into zero change in share.FIGURE 14SBA 504-7a-loancomparison/ for more information.CHANGE IN SHARE OF COUNT AND VOLUME OF SBA LOANS VS. POPULATION33.3%35%30%25%20%15%10% 2%5%0%Population504 Count (#)33.3%28.6%20%20%6.4%0%0%0%BLACKHISPANIC7(a) Count (#)504 Volume ( )7(a) Volume ( )Source: SBA.16. “2016 Population Data;” SBA lending data made available to the Milken Institute after a Freedom ofInformation Act (FOIA) request to the SBA dated September 28, 2018.17. “2017 Population Data,” American Fact Finder, Population Division, U.S. Census Bureau, index.xhtml; SBA lending data released to the Milken Institute after anFOIA request to the SBA dated September 28, 2018.THE PARTNERSHIP FOR LENDING IN UNDERSERVED MARKETS9
Cultural BarriersWhy do African Americans and Latinos have higher barriers to accessingcapital compared to the general population and other racial andethnic groups? A legacy of poverty, inequality, and bias plays a largerole. Entrepreneurs who are well-educated, professionally experien
The Center for Financial Markets promotes financial market understanding and works to expand access to capital, strengthen—and deepen—financial markets, and develop innovative financial solutions to the most pressing global challenges.