Transcription
USINGSATELLITE DATAIN FINANCIALINCLUSIONHow financial services providerscan use satellite data andadvanced analytics techniquesto reach remote customersJuly 2019Maria Fernandez Vidal and Peter Bull1
Consultative Group to Assist the Poor1818 H Street NW, MSN F3K-306Washington DC 20433Internet: www.cgap.orgEmail: cgap@worldbank.orgTelephone: 1 202 473 9594Cover photo by Sujan Sarkar, India. CGAP/World Bank, 2019RIGHTS AND PERMISSIONSThis work is available under the Creative Commons Attribution 4.0 International PublicLicense (https://creativecommons.org/licenses/by/4.0/). Under the Creative CommonsAttribution license, you are free to copy, distribute, transmit, and adapt this work, includingfor commercial purposes, under the following conditions:Attribution—Cite the work as follows: Vidal, Maria Fernandez, and Peter Bull. 2019. “UsingSatellite Data in Financial Inclusion.” Technical Guide. Washington, D.C.: CGAP.Translations—If you create a translation of this work, add the following disclaimer alongwith the attribution: This translation was not created by CGAP/World Bank and should notbe considered an official translation. CGAP/World Bank shall not be liable for any contentor error in this translation.Adaptations—If you create an adaptation of this work, please add the following disclaimeralong with the attribution: This is an adaptation of an original work by CGAP/World Bank.Views and opinions expressed in the adaptation are the sole responsibility of the author orauthors of the adaptation and are not endorsed by CGAP/World Bank.All queries on rights and licenses should be addressed to CGAP Publications, 1818 H Street,NW, MSN IS7-700, Washington, DC 20433 USA; e-mail: cgap@worldbank.org
CONTENTS Executive Summary1Introduction2Section 1: The Opportunity in Remote Sensing3Section 2: Developing Your Remote Sensing Capabilities5Section 3: The Data9Section 4: The Modeling16Section 5: Case Study19References22Appendix23
E XECUTIVE SUMMARYFinancial services providers that see an opportunity to reach financially excludedpeople in rural areas can use new technology to remotely gather and analyze dataon potential customers.High-quality satellite data are becoming increasingly available. By leveragingadvances in machine learning—the ability of computers to analyze data quicklyand at scale—providers can gain valuable insights into customers’ economic,environmental, and demographic characteristics. This guide explains foundationalconcepts of machine learning and how financial services providers can apply thosemethods to leverage information contained in satellite images for the purpose ofcredit scoring.This guide focuses on smallholder finance, but providers may find it useful forother applications as well, such as estimating local infrastructure, housing, andincome levels; assessing the effectiveness of farming practices; crop insurance andrisk calculations; and forecasting yields to combat food security problems.E x ec u t i v e S umm a r y1
INTRODUCTIONTHIS GUIDE FOCUSES ON THE USE OFsatellite imagery for credit scoring algorithms thatfacilitate smallholder farmer finance. Those interested in other applications of satellite imagery will also findthe guide useful. The guide covers the basics of machinelearning and highlights the knowledge, skills, tools, anddata sources necessary when using satellite imagery inmachine learning.The guide focuses on three types of organizations: Financial services providers (FSPs) that serve smallholder farmers. These providers can use models based onsatellite images to estimate relevant metrics, such as timingand value of yields, at a low marginal cost. Non-FSP organizations that have smallholder farmersas customers. Other organizations in agricultural valuechains—input providers, exporters, and traders—can usedetailed information about type and density of crops orpopulation to help them make decisions on products, yields,quality, or source locations.This guide strives to do the following: Introduce remote sensing and its potential for financialinclusion and smallholder finance. Explain in simple terms how these methods work and clarify both the abilities and limits of current techniques. Present use cases where computation techniques applied tosatellite imagery can help organizations better serve smallholder farmers. Equip organizations interested in exploring these methodswith clear and actionable roadmaps that outline dataprerequisites, problem scoping guidelines, and advice ongetting started with research and development efforts.Providers can use this guide as a tool to help them applytechnologies, processes, and data analytics and machinelearning methods to improve the delivery of financialservices to low-income segments. Development organizations and public sector.Development organizations and public sector actors that seethe potential of financial inclusion are increasingly interestedin big data and analytics. Those in agriculture and agrifinance are particularly interested in using satellite imagery.USING S ATELLITE DATA IN FIN A NCI A L INCLUSION2
SECTION 1THE OPPORTUNIT YIN REMOTE SENSING1.1 W hat Is Remote Sensing?Why Does It Matterfor Financial Inclusion?The availability of data is increasing exponentially.Over the past 15 years, there has been a dramatic increasein the availability of high-resolution satellite imagery datafrom commercial providers. These images make it possibleto follow events on the ground—from changing infrastructure to the availability of water resources—that can provideinsight into economic, environmental, and demographicchanges over time.Better tools make it easier to apply advanced analyticstechniques. Advances in machine learning paired with anincrease in affordable computational and storage capabilitiesof machines and networks provide new ways to leveragedata. Machines can analyze imagery data quickly and atscale and can learn from patterns. For example, convolutional neural networks (CNNs) power applications like theauto-tagging of friends on Facebook or the computer-aidedidentification of irregular tissue in medical scans. Pairedwith the increased availability of high-frequency satelliteimages, these approaches help organizations learn aboutwhat is happening in remote locations in a scalable way.Remote sensing can enable fast, affordable, effective,and scalable decision making. Remote sensing is theacquisition of information about an object or phenomenonwithout making physical contact with the object. It generally refers to the use of satellite sensor technologies todetect and classify objects on Earth. Satellite imagery allowsorganizations to make smart decisions at scale, while theT he Op p or t uni t y In Rem o t e S ensinguse of traditional methods can be expensive, infeasible, andcomplicated. There are three important benefits of remotesensing when compared with other data collection options: It is often cheaper It can often provide intelligence more quickly It can scale to enormous geographic areas much more effectively—thus providing large time and cost savings benefits.Reducing the marginal costs of operation is key for financial inclusion. One of the big challenges of financial inclusionbusiness models is the low revenue potential per customer.Therefore, low marginal costs are a key enabler of viablebusiness models to serve the poor. The availability of digitalchannels has been a first step in lowering the costs of traditional operational models and expanding reach. However, oncean in-person, one-on-one relationship is replaced by a digitalone, organizations lose opportunities to know their customers.Remote sensing technology, although still nascent, has thepotential to enable individualized decision making in an automated way by providing new customer-level data.Remote sensing technology has significant potential fororganizations that work in financial inclusion, especiallyfinancial inclusion for smallholder farmers. Collecting dataabout farmers who are spread across remote areas is a slow andexpensive process. Most smallholder farmers do not have formalfinancial information that can be used to assess their incomeflows or ability to repay. Remote sensing can help organizations that serve rural segments (e.g., agricultural services,microfinance institutions, off-grid energy providers) to collectand analyze data and better assess opportunities and risks in ascalable way.3
1.2 A reas Where These MethodsCan be AppliedBOX 1.Key termsData science. A broad term that encompassesThe following use cases illustrate the potential for satelliteimagery and machine learning to impact development.collecting, storing, processing, analyzing, andAlternative credit scoring. Low-income people in general,and rural populations in particular, often do not have traditional credit histories and financial records, which makes itdifficult for FSPs to assess their creditworthiness and to lendto them. Satellite images can provide an estimate of past andfuture agriculture income as well as the timing and sources ofthis income, and thus, they can provide key inputs to creditassessments.refers to machine learning and statistical modeling.Estimating local infrastructure, housing, and incomelevels. Reliable estimates of local infrastructure, housing, andincome levels can help development organizations identify gapsand needs for investment and can help private-sector playersidentify markets and opportunities. Satellite data can enableassessment of large areas, effective comparisons across locations,and tracking of changes and evolution in a cost-effective way.GIS (geographic information systems). A systemAssessing the effectiveness of farming practices (includinginputs, methods, and crops). Satellite images can enableautomated assessment and guidance on farming practicesat a minimal marginal cost. This may be particularlybeneficial to subsistence farmers who lack access to formaltraining or advisers.relies on statistical models or other algorithms used toCalculating crop insurance and risk. Insurance can smoothincome and provide resilience against shocks, which is particularly important for low-income people who have limited assetsand savings. Remote sensing has the potential to automateinsurance claim evaluation, which would significantly reducemarginal cost and enable business models for microinsurance.future. For example, a model can try to predict cropForecasting yields to combat food security problems. Foodsecurity is a major challenge for many developing countriesthat have large population segments that depend on rainfallagriculture. This is exasperated by uncertainties stemmingfrom climate change and the lack of early detection of lowyields, which limits the ability of governments and otherorganizations to mitigate shortages. Remote sensing can provide automated high-frequency yield estimates to maximizetheir ability to react and address potential food shortages.light, but they may also include images resulting fromcommunicating data. In this paper, “data science” alsoDeep learning (also known as deep structuredlearning or hierarchical learning). This is part of abroader family of machine-learning methods basedon learning data representations, as opposed totask-specific algorithms. Among deep-learningmethods, convolutional neural networks (CNNs) are themost common approach used for image recognition.of tools that are used to store, process, analyze, andmap geographic data. These systems are complex, andspecially trained experts are needed to run them.Machine learning. This term refers to using datato “give computers the ability to learn without beingexplicitly programmed.” Much of machine learninggenerate results from information found in data ratherthan in predefined explicit rules.Prediction. Making inferences about unknowninformation based on data inputs. When we talk aboutpredictions, we are not necessarily talking about theyields in the upcoming year or it can try to predictwhether a given image is of a cat or of a dog.Satellite imagery. Data collected from satellitemounted sensors of different light spectra as theycircle the Earth. These can simply be images at visiblenonvisible wavelengths (such as infrared or ultraviolet)detected by specialized sensors.Statistical model. Refers to an algorithm thattranslates input data—in this paper, this is usuallysatellite imagery—to a predicted result of interest. Themodels discussed in this paper are generated usingmachine-learning techniques, but statistical models canbe generated using a variety of econometric techniques.Although many of these use cases are new or experimental,they are becoming increasingly accessible as technologybecomes cheaper and more widespread.USING S ATELLITE DATA IN FIN A NCI A L INCLUSION4
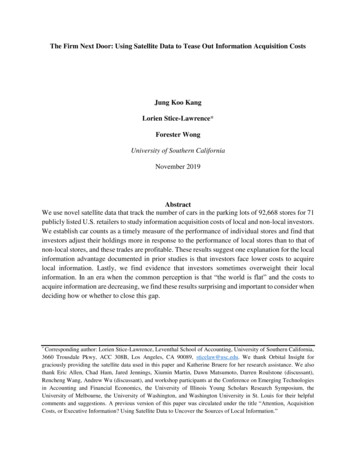
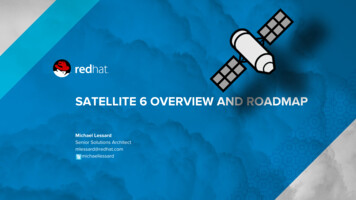
SECTION 2DE VELOPING YOUR REMOTESENSING CAPABILITIES2.1 What Is Machine Learning?Machine learning has been around since the early 20thcentury, and it has become increasingly relevant as advancesin technology reduce the cost of the computational andstorage capacity of computers. Traditional applications areset up by defining explicit rules: “if X, then Y.” For example,you can tell a computer how to play tic-tac-toe (noughtsand crosses) by defining rules for all possible scenarios: “Ifyou selected top-right and player B selected top-center youshould select middle-center next.” For a simple game witha limited set of possible moves like tic-tac-toe, definingexplicit rules is relatively easy to do. However, in some cases(e.g., a more complex game like chess), it is difficult, timeconsuming, and/ or expensive to write out all the rules forevery situation. You may not know what the rules are aheadof time—for example, you may have data about what happened in a given situation and what the outcome was, butyou may not know the steps of “if X, then Y” that producedthe outcome. In this case, you want the computer to learnthose rules by examining many examples or data. In thetic-tac-toe example, you would provide the computer a dataset of several tic-tac-toe games that contains the sequenceof selections of each player and the outcome: Player A wins,Draw, or Player B wins. The computer can use that information to learn how to play in a way that maximizes itschances of winning. This is called machine learning.Linear regression, a standard econometrics technique usedfor modeling, is a simple example of machine learning(although the term is most often used to refer to more complex examples). Given two points, you can unequivocallyD E V E L OPIN G Y O UR R EMO T E S E N S ING CAPA BIL I T IE Sdetermine the straight line that best fits them: the line thatpasses though both points. However, the procedure of “fitting” or “training” this line becomes increasingly complexas the number of points increases and you need to maketrade-offs between being closer to one or to another.Once you have a “fitted” or “trained” model, you can usethat model to make predictions. The trained model is a formula that, for any combination of inputs, provides the mostlikely outcome, even if it was never trained on this exactcombination of inputs. (See Figure 1.)FIGURE 1. An example of fitting training datayy1x1Training dataModelxy1 Prediction5
The two basic procedures of machine learning are traininga model and using that trained model to make predictions.Models can also be retrained to incorporate new data andimprove predictions. This type of computation can be donein seconds by any basic computer, so the term “machinelearning” tends to be used for more complex estimationsinvolving unstructured data. For example, looking at cropyield, you can train a model that takes satellite images asinputs and generates a prediction of the crop yield of thefields in the photographs. The model can be fine-tuned withother data such as weather forecasts.2.2 Technical CapabilitiesData science is an inherently cross-functional and interdisciplinary field, where projects ordinarily cut across manyparts of the business, both technically and operationally.Successfully combining technical and operational knowledge—either by finding people with expertise in both ormore commonly by achieving effective collaboration in amultidisciplinary team—is often the biggest challenge fororganizations that want to use advanced analytics.FUNCTIONAL ROLESFunctional roles define capabilities and functions ratherthan titles and people. A single person may have one ormore roles depending on his or her expertise and the size ofthe operation. Data scientist with deep learning experience.1 The coreskill set for any satellite imagery machine-learning project isthe ability to obtain, clean, and analyze very large heterogeneous data sets. This involves both quantitative andprogramming skills, including familiarity with data toolsand software. At a minimum, this requires the following: Strong knowledge of statistics, applied math, andcomputer science, usually with a masters (or higher)degree in a quantitative discipline. Mastery of at least one programming language commonly used for data work. Prevailing languages used by datascientists are Python and R (R Development Core Team12342008).2 Both of these languages are good options formodeling with satellite images.3 Experience with deep-learning methods (preferablecomputer vision approaches used for image analyseslike CNN). Experience with computer vision principles or projects,4where image data are analyzed using CNNs or otherrelevant approaches. GIS practitioner. Like data scientists, GIS practitionersspecialize in cleaning, synthesizing, and analyzing varieddata sets. They are experts in and focus mainly on geospatial data analysis. They generally do not need advancedmathematical backgrounds, and while many are able toscript and automate certain aspects, they often use desktopenvironments such as ArcGIS, Mapinfo, or QGIS for theiranalyses rather than custom software. Data engineer. The data engineer has a traditional IT rolethat focuses on systems for storing and processing data. Thework of the data engineer—sometimes called an infrastructure engineer—overlaps with work in developmentoperations. The data engineer decides how to develop andmanage the systems infrastructure. The data engineer needsthe following: An ability to strategize about “cloud” and “on premise”architectures. (See Section 4.1, IT Infrastructure forMachine Learning.) Experience with storing and processing images andgeospatial data, both of which have specializeddatabase technologies. Experience using application programming interfaces(APIs) to extract data and metadata from satelliteproviders. Experience scaling systems to handle massive amountsof information (in the terabytes) of input data. Business expert. The business expert is a project manager who understands the business use case and is familiarwith the “ground truth” data (see Section 3, The Data).The expert works closely with the data scientist to resolvequestions about patterns in the data. Importantly, the expertBecause this role involves several technical skill sets that intersect several fields, it can be difficult to find qualified data scientists, and it can be expensiveto bring them on as full-time employees—see “Building Capacity vs. Outsourcing,” later in this section for advice on getting started without full-timedata scientists.Python Software Foundation, “Python Language Reference,” http://www.python.org.Some other data analysis languages such as SPSS, SAS, and MATLAB are not as effective and flexible when working with satellite imagery.Computer vision is an interdisciplinary field that uses computers to gain high-level understanding from digital images or videos.USING S ATELLITE DATA IN FIN A NCI A L INCLUSION6
understands the area depicted in the satellite images andknows which patterns are expected and which are unusual.The expert understands the business case for using satelliteimagery and machine learning. The business expert needs thefollowing: Domain expertise and knowledge of the business use case. Understanding of the “ground truth” data that are beingmodeled. For example, how are the data collected? Whatare the anomalies? Where are the missing data? What doindividual columns in the data set mean? Ability to communicate across different functions andshare progress, questions, and successes. Senior owner or “champion.” Machine-learning projectsare, at their core, research and development projects.A senior-level project owner will ensure that expectationsaround the work are set properly and will demonstratethat an organization understands the long-term buy-inthat is necessary for success. The senior owner or champion needs to: Support the project as a research and developmenteffort that uses cutting-edge technology to solvebusiness problems. Have a firm grasp on the domain and understand whatthe application of the system will be—in particular, howthe system will improve the business and its operations. Ideally, have a technical background.Even projects with brilliant technical staff may fail if staffcannot rely on a subject matter expert to keep the focus onissues that matter to commercial and other stakeholdersand to keep assumptions realistic. Similarly, a cutting-edgeresearch and development project that achieves impressivenumerical results but cannot feasibly be run on the organization’s existing IT infrastructure will not be adopted andused. Even successful and objectively high-quality technicalefforts tend to flounder in larger organizations without asenior project leader acting as a champion and helping tobreak down barriers between disparate business units.De v elopin g y o ur r e mo t e sensing c a pa bili t iesB U I L D I N G C A PA C I T Y V S . O U T S O U R C I N GShould you build machine-learning models with satelliteimagery in-house or should you outsource this effort? Youranswer depends on many aspects, including whether youhave the expertise required in-house, what your projectgoals are, the scope of your budget, your timing requirements, and your long-term strategy.Will machine-learning capabilities strengthen your positionin the marketplace? If yes, do you have or can you find,attract, and support the right person to lead this effort?This person needs to understand the business as well as howmachine learning can address business needs. The lead willneed to work in a dynamic environment and invest resourcesin areas that have the most potential for success. However,even well-informed decisions do not guarantee success.If you do not have the necessary conditions in-house,you may want to outsource the work. Outsourcing oftenmeans getting results faster and having lower risks becauseyou would not need to take the time to train in-housespecialists. This is especially valuable at the research anddevelopment phase, where future investments are oftenbased on the results of initial experiments. By outsourcingthis work, your organization can more effectively managetimelines, prices, and goals by negotiating these upfrontwith the contractor.If you decide to outsource the work, you should clearlydefine the success (and failure) criteria of the project.Machine learning is about experimenting with data andmethods, and not every experiment will work. Learningwhy something did not work often can be as valuable as creating a working model. This caveat should be acknowledgedwhen assessing the value of machine learning. Creatingmodels with extremely high accuracy involves an iterativeapproach and learning from both successes and failures.7
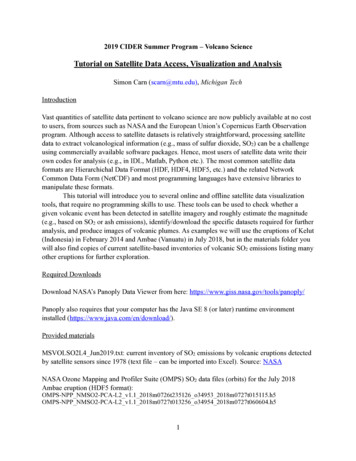
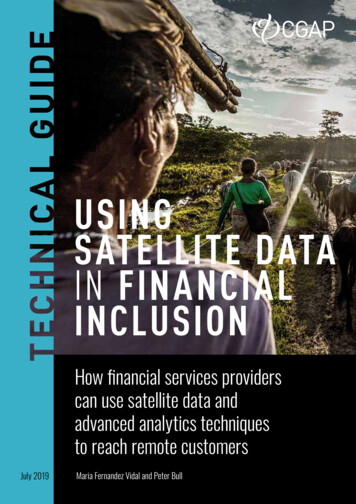
Each step should be built on a solid foundation—this isreferred to as the Data Science Hierarchy of Needs (afterMaslow’s Hierarchy of Needs, see Figure 2). When outsourcing a machine-learning project (or defining onein-house), you should review the Data Science Hierarchyof Needs with the contractor and have a frank discussionabout the effort required at each level. The more information the contractor has, the more likely it is that togetheryou can scope a successful project.In most cases, an investment in a machine-learning modelis an investment in custom software. There are currentlyno off-the-shelf software providers that use state-of-the-artmodels and near-daily satellite data. Therefore, you willneed to invest in custom software, keeping in mind theneed for maintenance, improvements, support, and integration of that software.Overall, the decision to build internal capacity or to outsource comes down to your organization’s unique situation.Your organization must assess strategy, current capabilities,and the expected business benefits of this technology todetermine the best path forward.FIGURE 2.The data science hierarchy of needsArtificialIntelligence,Deep LearningLearn/OptimizeAnalytics, Metrics, Segments, Aggregates,Features, Training ectA/B Testing, Experimentation,Sample MachineLearning AlgorithmsCleaning, Anomaly Detection, PrepReliable Data Flow, Infrastructure, Pipelines, Extract/Transform/Load,Structured and Unstructured Data StorageInstrumentation, Logging, Sensors, External Data, User Generated ContentSource: Rogati, 2017.USING S ATELLITE DATA IN FIN A NCI A L INCLUSION8
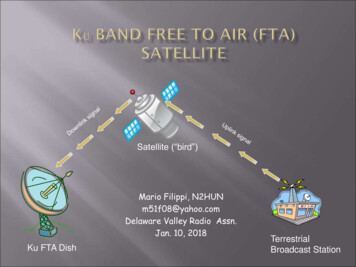
SECTION 3THE DATACOLLECTING DATA IS AT THE BASE OFthe Data Science Hierarchy of Needs. One of themantras of the data scientist is: “Garbage in, garbage out.” Without accurate, timely, and relevant data youcannot build effective models. A plan for getting the rightdata, in the right format, and within a reasonable timeframeis critical.In the case of remote sensing, data need to capture threeessential features: what, when, and where. While critical forworking with satellite data for smallholder farmers, thesefeatures are also relevant for many other types of image andremote sensing data.A data audit is an essential first step. In addition to ensuringthat the necessary data are collected, you must make surethat data are of sufficient quality. The data scientist shouldprovide those familiar with the data (the business expert,the data engineer, and others within the company asFIGURE 3.3.1 S electing a Target Variableto Model (What)The machine-learning process creates a data-driven model thattakes contextual information (such as satellite images) as inputsand produces predictions about another variable.5 For instance,a model may predict an estimate of crop yield, the rate of deforestation, the density of road traffic, or the total irrigated land. Thekey initial step is to produce a data set that has the variable to bepredicted. This is called the “target variable.” You want your modelto be a function that takes images as inputs and produces estimatesModel development and applicationModel DevelopmentImage Target Variable5needed) with descriptive statistics for the different variablesand identify any potential errors. Descriptive statistics mayinclude means, medians, maximum and minimum values,distribution of data, and correlations between variables.Trained ModelModel ApplicationImageModelPredicted TargetVariableTechnically, this is a subfield of machine learning called “supervised learning.” Supervised learning is the focus of this paper, but there are also methods called“unsupervised learning.” These methods attempt to discover structure in data independent of a quantity of interest or variable you are looking to measure.T he d ata9
of this target variable. For example, to train an algorithm to predictyield based on an image, you need a data set that contains imagesand the yield associated to each of them. (See Figure 3.)In the data set, this target variable will have a temporal component (when it was measured) and a spatial component(where was it measured). Knowing when and where yourmeasurements of the target variable comes from allows you tosynchronize your target data with the available satellite imagery.CL ASS OF MODELClassification, regression, and segmentation are the threeclasses of machine-learning models that are relevant whenworking with satellite imagery. These classes have differentkinds of target variables, but all can be modeled using satellite imagery if there are enough examples of satellite imagerywhere the value of that target variable is known.In a classification problem, there is a set of discrete categories to model. Figure 4 illustrates a simple example wherea photograph needs to be classified as being of a cat, dog,mug, or hat. The kind of object in the picture is the targetvariable. The goal of classification is to identify which class(category) the image should be associated with. For satelliteimagery, the algorithm might, for example, classify a satellite image as “urban” or “rural.”In a regression problem, a continuous variable is modeled (asopposed to a discrete category). The algorithm will predict aFIGURE 4.specific value at a given time for this continuous variable. Thetarget variable is usually a number representing the quantityof interest. For example, a regression model might predictfuture house prices, where house prices can have any dollarvalue—not just “cheap” or “expensive.” Some examples usingsatellite images include changes in the number of buildingsin a suburb, expected crop yield from an area of farmland, orthe percentage of the image covered in water.In an image segmentation problem, areas of interest within animage must be identified. For example, an algorithm mightdraw bounding boxes around cultivated land in the image orit may identify areas that are bodies of water. Image segmentation is closely related to object recognition. As Figure5 shows, for this kind of data, example images are neededwhere the objects of interest have already been labeled withbounding boxes. Sometimes this can be done by manuallyadding these annotations to a subset of the satellite images sothat an algorithm can be built to automate that process.L E V E L O F A G G R E G AT I O NNext, the level of aggregation in the data set must be considere
the potential of financial inclusion are increasingly interested in big data and analytics. Those in agriculture and agrifi - nance are particularly interested in using satellite imagery. This guide strives to do the following: Introduce remote sensing and its potential for financial inclusion and smallholder finance.