Transcription
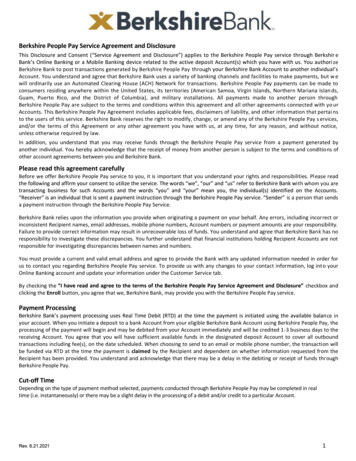
By Warren E. BuffettAnnual Percentage ChangeS&P 500Per-SharePer-SharewithBook Value of Market Price ofBerkshireDividendsBerkshire1965 . . . . . . . . . . . . . . . . . . . . . . . . . . . . . . . . . . . . . . . . . . . . . . . . . . .1966 . . . . . . . . . . . . . . . . . . . . . . . . . . . . . . . . . . . . . . . . . . . . . . . . . . .1967 . . . . . . . . . . . . . . . . . . . . . . . . . . . . . . . . . . . . . . . . . . . . . . . . . . .1968 . . . . . . . . . . . . . . . . . . . . . . . . . . . . . . . . . . . . . . . . . . . . . . . . . . .1969 . . . . . . . . . . . . . . . . . . . . . . . . . . . . . . . . . . . . . . . . . . . . . . . . . . .1970 . . . . . . . . . . . . . . . . . . . . . . . . . . . . . . . . . . . . . . . . . . . . . . . . . . .1971 . . . . . . . . . . . . . . . . . . . . . . . . . . . . . . . . . . . . . . . . . . . . . . . . . . .1972 . . . . . . . . . . . . . . . . . . . . . . . . . . . . . . . . . . . . . . . . . . . . . . . . . . .1973 . . . . . . . . . . . . . . . . . . . . . . . . . . . . . . . . . . . . . . . . . . . . . . . . . . .1974 . . . . . . . . . . . . . . . . . . . . . . . . . . . . . . . . . . . . . . . . . . . . . . . . . . .1975 . . . . . . . . . . . . . . . . . . . . . . . . . . . . . . . . . . . . . . . . . . . . . . . . . . .1976 . . . . . . . . . . . . . . . . . . . . . . . . . . . . . . . . . . . . . . . . . . . . . . . . . . .1977 . . . . . . . . . . . . . . . . . . . . . . . . . . . . . . . . . . . . . . . . . . . . . . . . . . .1978 . . . . . . . . . . . . . . . . . . . . . . . . . . . . . . . . . . . . . . . . . . . . . . . . . . .1979 . . . . . . . . . . . . . . . . . . . . . . . . . . . . . . . . . . . . . . . . . . . . . . . . . . .1980 . . . . . . . . . . . . . . . . . . . . . . . . . . . . . . . . . . . . . . . . . . . . . . . . . . .1981 . . . . . . . . . . . . . . . . . . . . . . . . . . . . . . . . . . . . . . . . . . . . . . . . . . .1982 . . . . . . . . . . . . . . . . . . . . . . . . . . . . . . . . . . . . . . . . . . . . . . . . . . .1983 . . . . . . . . . . . . . . . . . . . . . . . . . . . . . . . . . . . . . . . . . . . . . . . . . . .1984 . . . . . . . . . . . . . . . . . . . . . . . . . . . . . . . . . . . . . . . . . . . . . . . . . . .1985 . . . . . . . . . . . . . . . . . . . . . . . . . . . . . . . . . . . . . . . . . . . . . . . . . . .1986 . . . . . . . . . . . . . . . . . . . . . . . . . . . . . . . . . . . . . . . . . . . . . . . . . . 32.3(5.0)21.422.46.131.618.6
1987 . . . . . . . . . . . . . . . . . . . . . . . . . . . . . . . . . . . . . . . . . . . . . . . . . . .1988 . . . . . . . . . . . . . . . . . . . . . . . . . . . . . . . . . . . . . . . . . . . . . . . . . . .1989 . . . . . . . . . . . . . . . . . . . . . . . . . . . . . . . . . . . . . . . . . . . . . . . . . . .1990 . . . . . . . . . . . . . . . . . . . . . . . . . . . . . . . . . . . . . . . . . . . . . . . . . . .1991 . . . . . . . . . . . . . . . . . . . . . . . . . . . . . . . . . . . . . . . . . . . . . . . . . . .1992 . . . . . . . . . . . . . . . . . . . . . . . . . . . . . . . . . . . . . . . . . . . . . . . . . . .1993 . . . . . . . . . . . . . . . . . . . . . . . . . . . . . . . . . . . . . . . . . . . . . . . . . . .1994 . . . . . . . . . . . . . . . . . . . . . . . . . . . . . . . . . . . . . . . . . . . . . . . . . . .1995 . . . . . . . . . . . . . . . . . . . . . . . . . . . . . . . . . . . . . . . . . . . . . . . . . . .1996 . . . . . . . . . . . . . . . . . . . . . . . . . . . . . . . . . . . . . . . . . . . . . . . . . . .1997 . . . . . . . . . . . . . . . . . . . . . . . . . . . . . . . . . . . . . . . . . . . . . . . . . . .1998 . . . . . . . . . . . . . . . . . . . . . . . . . . . . . . . . . . . . . . . . . . . . . . . . . . .1999 . . . . . . . . . . . . . . . . . . . . . . . . . . . . . . . . . . . . . . . . . . . . . . . . . . .2000 . . . . . . . . . . . . . . . . . . . . . . . . . . . . . . . . . . . . . . . . . . . . . . . . . . .2001 . . . . . . . . . . . . . . . . . . . . . . . . . . . . . . . . . . . . . . . . . . . . . . . . . . .2002 . . . . . . . . . . . . . . . . . . . . . . . . . . . . . . . . . . . . . . . . . . . . . . . . . . .2003 . . . . . . . . . . . . . . . . . . . . . . . . . . . . . . . . . . . . . . . . . . . . . . . . . . .2004 . . . . . . . . . . . . . . . . . . . . . . . . . . . . . . . . . . . . . . . . . . . . . . . . . . .2005 . . . . . . . . . . . . . . . . . . . . . . . . . . . . . . . . . . . . . . . . . . . . . . . . . . .2006 . . . . . . . . . . . . . . . . . . . . . . . . . . . . . . . . . . . . . . . . . . . . . . . . . . .2007 . . . . . . . . . . . . . . . . . . . . . . . . . . . . . . . . . . . . . . . . . . . . . . . . . . .2008 . . . . . . . . . . . . . . . . . . . . . . . . . . . . . . . . . . . . . . . . . . . . . . . . . . .2009 . . . . . . . . . . . . . . . . . . . . . . . . . . . . . . . . . . . . . . . . . . . . . . . . . . .2010 . . . . . . . . . . . . . . . . . . . . . . . . . . . . . . . . . . . . . . . . . . . . . . . . . . .2011 . . . . . . . . . . . . . . . . . . . . . . . . . . . . . . . . . . . . . . . . . . . . . . . . . . .2012 . . . . . . . . . . . . . . . . . . . . . . . . . . . . . . . . . . . . . . . . . . . . . . . . . . .2013 . . . . . . . . . . . . . . . . . . . . . . . . . . . . . . . . . . . . . . . . . . . . . . . . . . .2014 . . . . . . . . . . . . . . . . . . . . . . . . . . . . . . . . . . . . . . . . . . . . . . . . . . .Book .614.418.28.3Compounded annual gain (1965-2014) . . . . . . . . . . . . . . . . .Overall gain. . . . . . . . . . . . . . . . . . . . . . . . . . . . . . . . . . . . . . . . . . . .19.4%751,113%Market .4(4.7)16.832.727.021.6%1,826,163%S&P .12.116.032.413.79.9%11,196%Notes: Data are for calendar years with these exceptions: 1965 and 1966, year ended 9/30; 1967, 15 months ended12/31. Starting in 1979, accounting rules required insurance companies to value the equity securities they hold atmarket rather than at the lower of cost or market, which was previously the requirement. In this table, Berkshire’sresults through 1978 have been restated to conform to the changed rules. In all other respects, the results are calculated using the numbers originally reported.The S&P 500 numbers are pre-tax whereas the Berkshire numbers are after-tax. If a corporation such as Berkshirewere simply to have owned the S&P 500 and accrued the appropriate taxes, its results would have lagged the S&P 500in years when that index showed a positive return, but would have exceeded the S&P 500 in years when the indexshowed a negative return. Over the years, the tax costs would have caused the aggregate lag to be substantial.All of the letters in this book are written and copyrighted by Warren E. Buffett and are reproduced here with hispermission. These letters must not be reproduced, copied, sold, or otherwise distributed without the permissionof Warren E. Buffett.
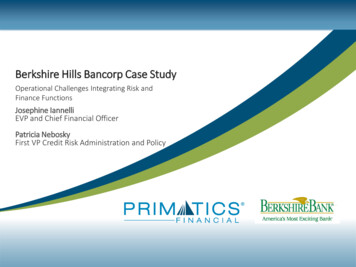
IntroductionWarren E. Buffett first took control of Berkshire Hathaway Inc., a small textilecompany, in April of 1965. A share changed hands for around 18 at the time. Fiftyletters to shareholders later, the same share traded for 226,000, compoundinginvestor capital at just under 21% per year—a multiplier of 12,556 times.Buffett has said many times that he “was wired at birth to allocate capital.” Byallocating resources to assets and endeavors that have the greatest potential forgain, Buffett has guided Berkshire to creating enormous value—not only forshareholders, but for the managers, employees, and customers of its holdings.The numbers and charts you see on the following pages tell the story of acompounding machine. The rest of the book tells of the people, companies, andphilosophy that have driven it for five decades.In addition to providing an astounding case study on Berkshire’s success, Buffettshows an incredible willingness to share his methods and act as a teacher to hismany students.I put this compilation together as thanks to Warren’s positive influence on myselfand many, many others.Max OlsonMarch 3, 2015Mountain View, CAP.S. I owe a huge thanks to Tracy Britt, for working with me to finish this book, Deb Ray for scouringWarren’s archives for the information I needed, and to Guy Spier for suggesting I make the book public.NOTES: Formatting of letters prior to 1998 was reproduced as close as possible to match the original.Page numbers mentioned within the letters themselves refer to pages in their original Annual Reports(available post-1994 at http://www.berkshirehathaway.com/).
1,638,400Growth of 051,20025,60012,8006,400005&PS3,2001,600800xrice Indeer 1196919671965100
Topics IndexInvestingInvestment strategy . . . . . . . . . . . . .33, 38, 168, 209, 213, 230, 236, 278, 299, 311,327, 335, 345, 377, 379, 386, 445, 583, 679, 719,724, 744-745, 752Workouts and arbitrage. . . . . . . . . . .169, 186, 215, 232, 236, 254, 310, 329Mr. Market . . . . . . . . . . . . . . . . . .33, 209, 212, 213, 328, 719Circle of competence . . . . . . . . . . . .312, 329, 335, 385, 431, 622, 723, 757Bonds . . . . . . . . . . . . . . . . . . . . .28, 63, 75, 144, 185, 214, 231, 232, 254, 256,277, 386, 431, 594, 633, 666Zero-Coupon Securities . . . . . . . . . 256, 317, 386Junk bonds . . . . . . . . . . . . . . . . 278, 439, 466, 494, 509, 527Municipal bonds . . . . . . . . . . . . . 610Preferred stock . . . . . . . . . . . . . . . .254, 279, 299, 312, 361, 396, 613, 653, 666-667Derivatives . . . . . . . . . . . . . . . . . .213, 386, 481, 504, 544, 569, 572, 593, 613, 617,633, 655, 679, 697Index puts . . . . . . . . . . . . . . . . . 593, 615, 633, 656, 679, 761Option pricing . . . . . . . . . . . . . . 617, 657Foreign currencies . . . . . . . . . . . . . .510, 527, 529, 571, 594Commodities. . . . . . . . . . . . . . . . .386, 666, 680Transaction costs . . . . . . . . . . . . . .552, 576Value and the Price/Value Gap . . . 70, 85, 104, 112, 153, 199, 238, 241, 336, 339,350, 368, 445, 640, 760Measuring performance . . . . . . . . . .Moats and Return on Capital70, 112, 303, 559, 621, 640, 685, 707, 729. . . . . 85, 101, 125, 159, 202, 220, 292, 293, 337, 424,430, 548, 583, 681Economic goodwill . . . . . . . . . . . . .113, 125, 174, 427, 447, 645Good businesses . . . . . . . . . . . . . . .125, 159, 202, 292, 583
Bad businesses . . . . . . . . . . . . . . . .158, 292, 585Turnarounds . . . . . . . . . . . . . . . 60, 74Marketing . . . . . . . . . . . . . . . . . .Risk225, 246, 423, 541. . . . . . . . . . . . . . . . . . . . . . . 327, 328, 554, 615, 622, 634, 658, 679, 745, 760Mistakes . . . . . . . . . . . . . . . . . . . 84, 260, 279, 299, 300, 346, 362, 379, 394, 410,447, 464, 509, 585, 613, 666, 674, 743, 751, 753Capital Allocation . . . . . . . . . . . . 5, 69, 147, 175, 339, 410, 431, 493, 585, 643,660, 701, 710, 732, 753, 756Dividend policy . . . . . . . . . . . . . . .6, 146, 701, 762Share repurchases . . . . . . . . . . . . . .54, 132, 267, 431, 668, 701, 709, 732Share repurchases at Berkshire4, 431, 668, 707, 760Stock issuance . . . . . . . . . . . . . . . .103, 110, 319, 380, 394, 401, 634, 753, 756Stock price activity . . . . . . . . . . . . .66, 121, 238, 729, 760Stock splits/spinoffs . . . . . . . . . . . . .78, 121, 317, 363, 758-759Debt issuance . . . . . . . . . . . . . . . .21, 79, 110, 216, 319, 380, 505, 522, 544, 553,658Credit rating . . . . . . . . . . . . . . . . .239Accounting & TaxesAccounting shenanigans . . . . . . . . . .221, 412, 488, 534, 595, 755Accounting for M&A (amortization),minority investments . . . . . . . . . . . .47, 68, 94, 176, 194, 222, 267, 338, 367, 411,427, 695, 718, 741EBITDA . . . . . . . . . . . . . . . . . . .257, 449, 461, 489, 718, 741Stock options . . . . . . . . . . . . . . . . .161, 314, 412, 534, 595Reporting . . . . . . . . . . . . . . . . . . .449, 489Deferred taxes . . . . . . . . . . . . . . . .84, 242, 319, 323Accounting methods . . . . . . . . . . . .22, 33, 56, 68, 84, 94, 125, 194, 212, 221, 283,313, 319, 347, 532, 694Tax accounting and taxation . . . . . . . .34, 71, 85, 188, 197, 208, 231, 242, 304, 313,319, 323, 374, 403, 445, 495, 574Management Qualities . . . . . . . . . 83, 104, 230, 762
Corporate Governance . . . . . . . . . 82, 110, 231, 261, 330, 369, 405, 484, 496, 532,623Business principles . . . . . . . . . . . . .449, 623, 643, 663, 763Board of directors . . . . . . . . . . . . . .231, 330, 485, 498, 532, 573, 644, 762Audit committees . . . . . . . . . . . . . .487Institutional imperative . . . . . . . . . . .261, 276, 516, 518Pension funds . . . . . . . . . . . . . . . .52, 489, 576, 596, 725Labor relations . . . . . . . . . . . . . . . .4, 8, 137, 157, 313Compensation . . . . . . . . . . . . . . . 159, 340, 423, 486, 496, 575Stock options . . . . . . . . . . . . . . . . .Mergers & Acquisitions159, 340, 550. . . . . . . . . 81, 83, 96, 103, 105, 305, 339, 351, 394, 425,634, 686, 731, 754Leveraged buyouts . . . . . . . . . . . . . .438, 439, 604, 757-758Conglomerates . . . . . . . . . . . . . . . .755-756, 765Diversifying earnings . . . . . . . . . . 5, 8, 9, 751, 756The EconomyMarket levels . . . . . . . . . . . . . . . . .69, 96, 152, 175, 186, 213, 220, 384, 396, 446,466, 600, 688Inflation . . . . . . . . . . . . . . . . . . .70, 82, 84, 86, 127, 681, 744Recessions . . . . . . . . . . . . . . . . . .116, 439, 464, 600, 688Predicting the future . . . . . . . . . . . .450, 596Policies . . . . . . . . . . . . . . . . . . . .510, 529, 551, 571, 594, 600, 634U.S. economic future . . . . . . . . . . . .510, 600, 639-640, 688, 710, 733Insurance IndustryUnderwritingmethods . . . . . . . . . . . . . . . . . . 16, 76, 91, 166, 207, 273, 326, 390, 458, 516,712, 737as a commodity . . . . . . . . . . . . . . 101, 206, 516, 768
of super-cat insurance . . . . . . . . . . 251, 272, 297, 308, 326, 344, 357, 371, 388, 441,458, 520, 541accounting methods . . . . . . . . . . . 100, 141, 184, 462, 565mistakes . . . . . . . . . . . . . . . . . . 358, 459, 476of retroactive reinsurance . . . . . . . . 441, 478, 562, 563Insurance competition . . . . . . . . . . .20, 26, 101, 165, 183, 206, 372, 373, 387, 443,518, 605, 712Industry results . . . . . . . . . . . . . . .26, 32, 36, 51, 75, 89, 100, 119, 139, 163, 182,205, 228, 249, 271, 296, 307, 324, 357, 689Floatdefinition . . . . . . . . . . . . . . . . . 274, 342, 500, 516, 624, 734quality . . . . . . . . . . . . . . . . . . . 273, 441composition and growth . . . . . . . . . 310, 408, 421, 562, 689, 708, 711, 734as leverage or equity . . . . . . . . . . . 356, 670, 689, 712, 735cost. . . . . . . . . . . . . . . . . . . . . 408, 421, 440, 458, 475, 500, 541, 646, 712cost measurement. . . . . . . . . . . . . 387, 408, 421, 516from derivatives. . . . . . . . . . . . . . 615, 698Other IndustriesTextile . . . . . . . . . . . . . . . . . . . .5, 22, 31, 49, 60, 157, 750Furniture . . . . . . . . . . . . . . . . . . .135, 225, 353Newspapers . . . . . . . . . . . . . . . . .116, 137, 177, 203, 247, 270, 359, 566, 698Banking . . . . . . . . . . . . . . . . . . . .13, 15, 17, 21, 29, 34, 39, 276Jewelry . . . . . . . . . . . . . . . . . . . .227, 245, 268, 352Consumer staples . . . . . . . . . . . . . .228, 255Media . . . . . . . . . . . . . . . . . . . . .270, 292Airlines . . . . . . . . . . . . . . . . . . . .279, 346, 379, 585Retailing . . . . . . . . . . . . . . . . . . .54, 118, 247, 268, 352, 353Utilities . . . . . . . . . . . . . . . . . . . .426, 473, 503, 540, 543, 604, 627, 650, 738Commodity . . . . . . . . . . . . . . . . .100, 206, 515Homebuilding & lending . . . . . . . . . .607, 630, 652, 667, 677Selling Your Business to Berkshire. 287, 321, 351, 405, 439, 604, 757
Memo to Managers. . . . . . . . . . . . 663Management Succession. . . . . . . . 555, 572, 654, 665, 762-763, 768Charitable Contributions . . . . . . . 91, 107, 123, 150, 172, 219, 240, 264, 281, 301,317, 331, 347, 365, 381, 398, 415, 433, 452, 468,489, 510Philanthropy . . . . . . . . . . . . . . . . .Factors of Berkshire’s Success .575. . . . 753, 756-757, 765-769
1Berkshire Hathaway Inc.Corporate GenealogyIn 1929, several textile operations with much common ownership were amalgamated with BerkshireCotton Manufacturing Co. (incorporated 1889), immediately renamed Berkshire Fine Spinning Associates,Inc. The merging mills were Valley Falls Co., Coventry Co., Greylock Mills, and Fort Dummer Mills, incorporated in 1853, 1865, 1880 and 1910 respectively. Although the documentation is not perfect, it is believed that the earliest progenitor of these corporations began business in 1806.The resulting operation was a giant, accounting for about 25% of the country’s fine cotton textile production. In the 1930s its many mills utilized approximately 1% of the electric output in the New Englandstates. But profitability did not follow volume and preferred dividends were omitted late in 1930 and for sixyears thereafter.World War II and the immediate postwar years produced extraordinary profitability and great balancesheet strength. In 1955, Hathaway Manufacturing Co., a New Bedford based manufacturer of both synthetic and cotton textiles was merged into Berkshire Fine Spinning and the name was immediately changed toBerkshire Hathaway Inc. Hathaway was founded in 1888 by Horatio Hathaway and included Hetty Greenas an original shareholder with 6¼% ownership.The combined enterprise had over 10,000 employees and owned close to six million square feet of plantbut the subsequent financial record was just as dismal as that which followed the previous grand consolidation of 1929.After the merger, Berkshire Hathaway’s summarized balance sheet was as follows at its fiscal year-endSeptember 30, 1955:AssetsCash . . . . . . . . . . . . . .Marketable Securities . . . .Accounts Receivable andInventories . . . . . . . . .Net Property, Plant andEquipment . . . . . . . . .Other Assets . . . . . . . . . . . . . . 4,169,0004,580,000. . .28,918,000. . . . .16,656,0001,125,000 55,448,000Liabilities and Stockholders’ EquityAccounts Payable andAccrued Expenses . . . . . . . . 4,048,000Stockholders’ Equity —2,294,564 shares outstanding;book value 22.40 per share . .51,400,000 55,448,000During the nine following years, sales of Berkshire Hathaway Inc. aggregated approximately 530million. A reconciliation of shareholders’ equity for these nine years follows:Stockholders’ equity at September 30, 1955 .Additions to capital surplus . . . . . . . . . . .Aggregate net loss-from operations 1956-64Cash dividends paid 1956-64 . . . . . . . . . .Repurchases of common stock . . . . . . . . .Stockholders’ equity at October 3, 1964 . . . 51,400,000888,000(10,138,000)( 6,929,000)(13,082,000) 22,139,000Berkshire Hathaway Inc.’s summarized balance sheet at October 3, 1964 was as follows:AssetsCash . . . . . . . . . . . . . .Accounts Receivable andInventories . . . . . . . . .Net Property, Plant andEquipment . . . . . . . . .Other Assets . . . . . . . . . . . . 920,000. . .19,140,000. . . . .7,571,000256,000 27,887,000Liabilities and Stockholders’ EquityNotes Payable . . . . . . . . . . . . 2,500,000Accounts Payable andAccrued Expenses . . . . . . . .3,248,000Total Liabilities . . . . . . . . . . .5,746,000Stockholders’ Equity —1,137,776 shares outstanding;book value 19.46 per share . .22,139,000 27,887,000
Berkshire Hathaway Inc.To the Shareholders of Berkshire Hathaway Inc.:First, a few words about accounting. The merger with Diversified Retailing Company, Inc. atyearend adds two new complications in the presentation of our financial results. After the merger,our ownership of Blue Chip Stamps increased to approximately 58% and, therefore, the accounts ofthat company must be fully consolidated in the Balance Sheet and Statement of Earnings presentation of Berkshire. In previous reports, our share of the net earnings only of Blue Chip had been included as a single item on Berkshire’s Statement of Earnings, and there had been a similar one-lineinclusion on our Balance Sheet of our share of their net assets.This full consolidation of sales, expenses, receivables, inventories, debt, etc. produces an aggregation of figures from many diverse businesses—textiles, insurance, candy, newspapers, tradingstamps—with dramatically different economic characteristics. In some of these your ownership is100% but, in those businesses which are owned by Blue Chip but fully consolidated, your ownershipas a Berkshire shareholder is only 58%. (Ownership by others of the balance of these businesses isaccounted for by the large minority interest item on the liability side of the Balance Sheet.) Such agrouping of Balance Sheet and Earnings items—some wholly owned, some partly owned—tends toobscure economic reality more than illuminate it. In fact, it represents a form of presentation thatwe never prepare for internal use during the year and which is of no value to us in any managementactivities.For that reason, throughout the report we provide much separate financial information andcommentary on the various segments of the business to help you evaluate Berkshire’s performanceand prospects. Much of this segmented information is mandated by SEC disclosure rules and covered in “Management’s Discussion” on pages 29 to 34. And in this letter we try to present to you aview of our various operating entities from the same perspective that we view them managerially.A second complication arising from the merger is that the 1977 figures shown in this reportare different from the 1977 figures shown in the report we mailed to you last year. Accounting convention requires that when two entities such as Diversified and Berkshire are merged, all financialdata subsequently must be presented as if the companies had been merged at the time they wereformed rather than just recently. So the enclosed financial statements, in effect, pretend that in 1977(and earlier years) the Diversified-Berkshire merger already had taken place, even though the actualmerger date was December 30, 1978. This shifting base makes comparative commentary confusingand, from time to time in our narrative report, we will talk of figures and performance for Berkshireshareholders as historically reported to you rather than as restated after the Diversified merger.With that preamble it can be stated that, with or without restated figures, 1978 was a goodyear. Operating earnings, exclusive of capital gains, at 19.4% of beginning shareholders’ investmentwere within a fraction of our 1972 record. While we believe it is improper to include capital gains orlosses in evaluating the performance of a single year, they are an important component of the longerterm record. Because of such gains, Berkshire’s long-term growth in equity per share has beengreater than would be indicated by compounding the returns from operating earnings that we havereported annually.For example, over the last three years—generally a bonanza period for the insurance industry,our largest profit producer—Berkshire’s per share net worth virtually has doubled, thereby com1197847
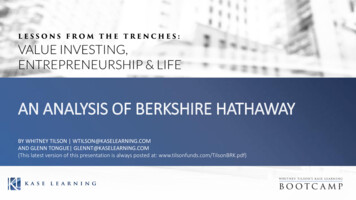
197848pounding at about 25% annually through a combination of good operating earnings and fairly substantial capital gains. Neither this 25% equity gain from all sources nor the 19.4% equity gain fromoperating earnings in 1978 is sustainable. The insurance cycle has turned downward in 1979, and itis almost certain that operating earnings measured by return on equity will fall this year. However,operating earnings measured in dollars are likely to increase on the much larger shareholders’ equitynow employed in the business.In contrast to this cautious view about near term return from operations, we are optimisticabout prospects for long term return from major equity investments held by our insurance companies. We make no attempt to predict how security markets will behave; successfully forecasting shortterm stock price movements is something we think neither we nor anyone else can do. In the longerrun, however, we feel that many of our major equity holdings are going to be worth considerablymore money than we paid, and that investment gains will add significantly to the operating returnsof the insurance group.Sources of EarningsTo give you a better picture of just where Berkshire’s earnings are produced, we show below atable which requires a little explanation. Berkshire owns close to 58% of Blue Chip which, in addition to 100% ownership of several businesses, owns 80% of Wesco Financial Corporation. Thus,Berkshire’s equity in Wesco’s earnings is about 46%. In aggregate, businesses that we control haveabout 7,000 full-time employees and generate revenues of over 500 million.The table shows the overall earnings of each major operating category on a pre-tax basis (several of the businesses have low tax rates because of significant amounts of tax-exempt interest anddividend income), as well as the share of those earnings belonging to Berkshire both on a pre-tax andafter-tax basis. Significant capital gains or losses attributable to any of the businesses are not shownin the operating earnings figure, but are aggregated on the “Realized Securities Gain” line at thebottom of the table. Because of various accounting and tax intricacies, the figures in the table shouldnot be treated as holy writ, but rather viewed as close approximations of the 1977 and 1978 earningscontributions of our constituent businesses.2
Net EarningsAfter TaxEarnings Before Income TaxesTotal(in thousands of dollars)Total – all entities . . . . . . . .Earnings from operations:Insurance Group:Underwriting . . . . . . . .Net investment income . .Berkshire-Waumbec textiles .Associated Retail Stores, Inc.See’s Candies . . . . . . . . . .Buffalo Evening News . . . .Blue Chip Stamps - Parent . .Illinois National Bank andTrust Company . . . . . .Wesco FinancialCorporation – Parent . .Mutual Savings andLoan Association . . . . .Interest on Debt . . . . . . . .Other . . . . . . . . . . . . . . .Total Earnings from OperationsRealized Securities Gain. . . . .Total Earnings . . . . . . . . . . .197849Berkshire ShareBerkshire Share197819771978197719781977 66,180 57,089 54,350 42,234 39,242 30,393 3,00119,7052,9162,75712,482(2,913)2,133 5,80212,804(620)2,77512,8407511,091 3,00019,6912,9162,7577,013(1,637)1,198 5,80212,804(620)2,7756,598389566 1,56016,4001,3421,1763,049(738)1,382 064,2623,2881,7712,0067778136654193,042(2,349)261 30,0529,190 39,2421,946(2,129)48 23,0807,313 30,39310,556(5,566)720 52,38413,796 66,1806,779(5,302)165 42,89114,198 57,0894,638(4,546)438 40,95513,395 54,3502,747(4,255)102 31,42710,807 42,234Blue Chip and Wesco are public companies with reporting requirements of their own. Laterin this report we are reproducing the narrative reports of the principal executives of both companies,describing their 1978 operations. Some of the figures they utilize will not match to the penny theones we use in this report, again because of accounting and tax complexities. But their commentsshould be helpful to you in understanding the underlying economic characteristics of these important partly-owned businesses. A copy of the full annual report of either company will be mailedto any shareholder of Berkshire upon request to Mr. Robert H. Bird for Blue Chips Stamps, 5801South Eastern Avenue, Los Angeles, California 90040, or to Mrs. Bette Deckard for Wesco FinancialCorporation, 315 East Colorado Boulevard, Pasadena, California 91109.TextilesEarnings of 1.3 million in 1978, while much improved from 1977, still represent a low returnon the 17 million of capital employed in this business. Textile plant and equipment are on thebooks for a very small fraction of what it would cost to replace such equipment today. And, despitethe age of the equipment, much of it is functionally similar to new equipment being installed by theindustry. But despite this “bargain cost” of fixed assets, capital turnover is relatively low reflectingrequired high investment levels in receivables and inventory compared to sales. Slow capital turnover, coupled with low profit margins on sales, inevitably produces inadequate returns on capital.Obvious approaches to improved profit margins involve differentiation of product, lowered manufacturing costs through more efficient equipment or better utilization of people, redirection towardfabrics enjoying stronger market trends, etc. Our management is diligent in pursuing such objectives. The problem, of course, is that our competitors are just as diligently doing the same thing.3
197850The textile industry illustrates in textbook style how producers of relatively undifferentiatedgoods in capital intensive businesses must earn inadequate returns except under conditions of tightsupply or real shortage. As long as excess productive capacity exists, prices tend to reflect direct operating costs rather than capital employed. Such a supply-excess condition appears likely to prevailmost of the time in the textile industry, and our expectations are for profits of relatively modestamounts in relation to capital.We hope we don’t get into too many more businesses with such tough economic characteristics. But, as we h
Warren E. Bu!ett "rst took control of Berkshire Hathaway Inc., a small textile company, in April of 1965. A share changed hands for around 18 at the time. Fi#y letters to shareholders later, the same share traded for 226,000, compounding investor capital at just under 21% per year—a multiplier of 12,556 times.