Transcription
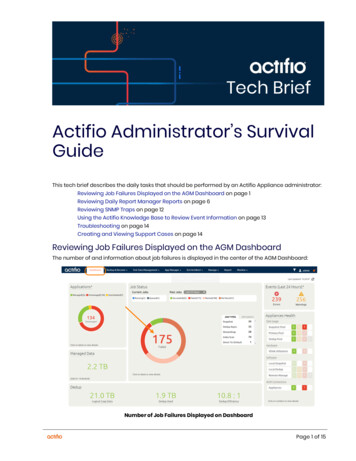
Tech BriefActifio Administrator’s SurvivalGuideThis tech brief describes the daily tasks that should be performed by an Actifio Appliance administrator:Reviewing Job Failures Displayed on the AGM Dashboard on page 1Reviewing Daily Report Manager Reports on page 6Reviewing SNMP Traps on page 12Using the Actifio Knowledge Base to Review Event Information on page 13Troubleshooting on page 14Creating and Viewing Support Cases on page 14Reviewing Job Failures Displayed on the AGM DashboardThe number of and information about job failures is displayed in the center of the AGM Dashboard:Number of Job Failures Displayed on DashboardPage 1 of 15
Click on the number of job failures to display a list of failed jobs in the Jobs Monitor service. For example:Job Failures Displayed in Jobs MonitorRight-click on a job entry to display detailedinformation about the entry.Review the details of the entry and: Use the Search Knowledge Base link tolearn how to resolve the issue. Ensure the application’s host is running. For virtual machines, verify the VM has notbeen migrated to another vCenter. If applicable, verify that the ActifioConnector service is running.Learn more about common job failures in the ActifioKnowledge Base. To research the knowledge base,see Using the Actifio Knowledge Base to Review EventInformation on page 13.If there are issues that you cannot resolve, you can contact Actifio Support or open a support case byfollowing the procedure outlined in Creating and Viewing Support Cases on page 14.Reviewing Errors and Warnings Displayed on the AGM DashboardThe number of errors and warnings encountered by an Actifio Appliance are displayed in the upper righthand corner of the Dashboard:Number of Errors and Warnings Displayed in AGM Dashboard1.2Click on the number of errors or warnings to display a list of the errors or warning in the EventsMonitor service. For example:
Errors Displayed in Events MonitorRight-click on an error entry to display detailed information about the error. You can learn moreinformation about the most common errors in the Actifio Knowledge Base. To research the knowledgebase, see Using the Actifio Knowledge Base to Review Event Information on page 13.2.If there are issues that youcannot resolve, you can contactActifio Support or open a supportcase by following the procedureoutlined in Creating and ViewingSupport Cases on page 14.3
Reviewing the Appliances Health Monitor in the AGM DashboardThe high-level status of your managed Actifio Appliances is displayed in the Appliances Health Monitoron the right-hand side of the Dashboard:Appliances Health Monitor in AGM DashboardThe Appliances Health Monitor provides an overview of resource usage and system health. Disk Usage: Current percent utilization of the default pools (Snapshot, Primary, and Deduppools). Clicking the Snapshot Pool, Primary Pool, or Dedup Pool label displays the associatedpool window in the Domain Manager. If you do not have access to Snapshot Pool, Primary Pool,or Dedup Pool information, then you see no values in Disk Usage. Hardware: Status of storage resources and VDisk utilization. Software: Status of local snapshot, local dedup, and remote protection. AGM Connections: Status of connections to each managed Actifio Appliance.Note: Image Preservation and Dedup Stats are available only from the Actifio Desktop of eachmanaged appliance.If you mouse over an entry in the Appliances Health Monitor, definitions for the various color coded statusindicators are displayed:Disk UsageHardwareSoftwareAGM Connections4
Disk UsageIf the System Health Monitor shows a Disk Usage pool as YELLOW or RED:1.Click on the pool and the Storage Pools page is displayed.2.If possible, add more disks to the pool. See AGM Online Help for instructions.3.Contact Actifio Support if more disks cannot be added.Checking Disk UsageHardware If the System Health Monitor Hardware Storage section displays YELLOW or RED, ensure storageis online. If VDisk utilization is RED, the VDisk count has exceeded its limit and corrective action isnecessary: unmount unneeded active images and expire old images from snapshot pool. TheAGM online help has instructions.Software If Local Snapshot or Dedup is RED, contact Actifio Support. If Remote Manage is YELLOW or RED, determine if communication between Actifio Applianceshas been disrupted or changed. If there are issues that you cannot resolve, you can contact Actifio Support or open a supportcase by following the procedure outlined in Creating and Viewing Support Cases on page 14.AGM ConnectionsIf any AGM connections are RED or YELLOW, then click on the red or yellow square to see in the DomainManager which managed appliances have issues.Checking AGM Stale Connections5
Reviewing Daily Report Manager ReportsThe optional Report Manager can generate detailed reports on your Actifio Appliance and theapplications and data it manages. For details on how to configure the Report Manager to automaticallygenerate and deliver daily email reports, see Using the Report Manager in ActifioNOW customer portal.At a minimum, review the following reports either manually or included in your daily email reports:Appliance Health Dashboard on page 6Daily Protection Status on page 8Unresolved Failures on page 9Backup Job Details on page 10Database Backup Status on page 11Storage Resource Usage Summary on page 11Storage Resource Trending on page 12Appliance Health DashboardThe Appliance Health Dashboard is the default home screen you see when you log on to the ReportManager. It shows you key attributes and resource consumption of your appliances at a glance, withcolors to indicate snapshot and dedup pools and VDisks that are approaching their limits. Appliancesthat are in a critical or warning state appear at the top.Appliance Health Dashboard6
Column NameDescriptionApplianceName and IP Address/DNS Name of the appliance.Last SyncTime stamp of the last successful data synchronization, along with the elapsed timesince that synchronization.Software VersionAppliance software version.Managed DataManaged Data Licenses consumed by the appliance in Terabytes, with a trend line.Used/Capacity: Current usage and capacity. Pools are measured in Terabytes.% Used: Percentage of pool volume that is consumed.30 Day Trend: History of consumption and capacity over the past 30 days.Dedup PoolDedup pool consumed by the appliance in Terabytes, along with a trend line.Used/Capacity: Current usage and capacity. Pools are measured in Terabytes.% Used: Percentage of pool volume that is consumed.30 Day Trend: History of consumption and capacity over the past 30 days.Snapshot Pool(s)Snapshot pool consumed by the appliance in Terabytes, along with a trend line.Used/Capacity: Current usage and capacity. Pools are measured in Terabytes.% Used: Percentage of pool volume that is consumed.30 Day Trend: History of consumption and capacity over the past 30 days.VDisksVDisks consumed by the appliance, along with a trend line.Used/Capacity: Current usage and capacity.% Used: Percentage of VDisks volume that are consumed.30 Day Trend: History of consumption and capacity over the past 30 days.7
Daily Protection StatusThis reports shows whether any snapshot, dedup/direct-dedup, remote dedup, StreamSnap, DedupAsync and OnVault jobs succeeded with consistency dates corresponding to the dates shown in thereport. The number of color slots shown will depend on the policy types used for each appliance,representing snapshot, dedup, remote dedup, StreamSnap and OnVault status. Direct-to-dedup jobs aretreated as dedup, similarly Direct to OnVault jobs are considered as OnVault. It only looks at policies witha daily schedule.Details of the columns and parameters are in the Report Manager online help.Daily Protection Status Report8
Unresolved FailuresThis report displays applications that had job failures in the selected time period without any subsequentsuccessful jobs. Failures are grouped by the combination of application, job type, and error code. A failurecount and time range is provided in this report.Details of the columns and parameters are in the Report Manager online help.Unresolved Failures Report9
Backup Job DetailsThis report provides details about the following backup jobs: Snapshot Dedup Remote-Dedup Direct Dedup Dedup-Async ReadyVM OnVault Log Replicate StreamSnap Direct-to-OnVaultThe report also shows the Log backup jobs and includes an option to show only Log backup jobs. Thechart in the report shows the count of jobs based on the status (succeeded, failed, canceled, not run) forthe selected dates. The Backup Job Details report also shows how long a queued job has been waiting.Details of the columns and parameters are in the Report Manager online help.Backup Job Details Report10
Database Backup StatusThis report provides the database and log backup status for database applications such as Oracle, SQLServer, SAP HANA, or Consistency Groups with Oracle, SQL Server and SAP HANA applications asconsistency group members. It also provides the most recent job status, along with the recent successfuldatabase and log jobs.Details of the columns and parameters are in the Report Manager online help.Database Backup Status ReportStorage Resource Usage SummaryThis report provides the concise detailed summary of resource consumption for a selected date.Details of the columns and parameters are in the Report Manager online help.Storage Resource Usage Summary Report11
Storage Resource TrendingThis report shows the resource consumption for snapshot pools, dedup pools, and VDisks. It also forecaststhe future consumption of the resources.Details of the columns and parameters are in the Report Manager online help.Storage Resource Trending ReportReviewing SNMP TrapsIf you have an SNMP trap receiver configured, your Actifio Appliance can send SNMP traps to the SNMPtrap receiver in the appliance. Reviewing the SNMP trap receiver is the first place to look for critical issues.For details on how to configure SNMP traps from the Actifio Desktop, including the location of the ActifioMIB file, see Network Administrator’s Guide to Actifio VDP located in the ActifioNOW customer portal. Payparticular attention to the “43901” series events, as they indicate a job failure. See Using the ActifioKnowledge Base to Review Event Information on page 13 for details.12
Using the Actifio Knowledge Base to Review Event InformationSearch the Actifio Knowledge Base in the ActifioNOW customer portal for an event’s meaning andresolution:1.Go to: https://now.actifio.com and enter the user name and password provided by your Actifiorepresentative, then click Login.2.From the ActifioNOW portal, click Get Help in the banner at the top of the portal.3.From the Get Help page, click Knowledge Base.Get Help Page of the ActifioNOW Portal4.From the Search Knowledge Base page, enter the event number and then press Enter on yourkeyboard.Search Knowledge Base PageLinks to all relevant articles for the event number appear in the Search Knowledge Base page.Summary of Search Results in the Search Knowledge Base Page13
Note: In the left sidebar there are filters that you can use to limit the search results. If you getmany results, deselect Articles of all types except Event ID.5.Select a relevant Knowledge Base article and review the information for the specified event ID.A Sample Knowledge Base Entry for a Job Failure EventTroubleshootingMany problems can be traced to fundamentals such as network issues and software permissions. Totrack down these issues, see Troubleshooting Actifio Systems in ActifioNOW at https://now.actifio.com.Sometimes a problem arises due to software that was software was added into the system or upgradedto an unsupported version. To check these, refer to the Actifio Support Matrix and to the Release Notesfor your version. These are also available in ActifioNOW.Creating and Viewing Support CasesIf there are issues that you cannot resolve, open a support case from the ActifioNOW customer portal,Depending the severity of the case, an Actifio support case may be auto-generated for you.If you need to contact an Actifio support representative, you can call:From anywhere: 1.315.261.7501US Toll-Free: 1.855.392.6810Australia: 0011 800-16165656Germany: 00 800-16165656New Zealand: 00 800-16165656UK: 0 800-0155019To log a case with Actifio Support and view case information related to an open case:141.Log into the ActifioNOW customer portal at: https://now.actifio.com/.2.From the ActifioNOW portal, click Get Help in the banner at the top of the portal.3.From the Get Help page, click Create a Case.
4.From the Create New Case page, fill in the form as required for the issue you are experiencing.Click Submit Case when you are done. Your case is created and sent to Actifio Support, and youreturn to the Get Help page.5.To review information about your case, or other existing cases, from the Get Help page, clickManage Cases. The Manage Cases page appears. You can also create a new case from theManage Cases page.15
MIB file, see Network Administrator's Guide to Actifio VDP located in the ActifioNOW customer portal. Pay particular attention to the "43901" series events, as they indicate a job failure. See Using the Actifio Knowledge Base to Review Event Information on page 13 for details.


![[ST] Survival Analysis - Stata](/img/33/st.jpg)
