Transcription
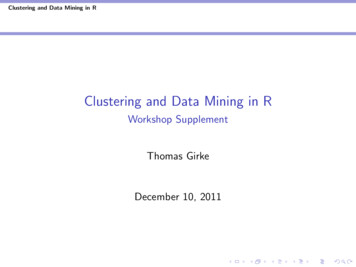
Introduction to ClusteringDilan GörürUniversity of California, IrvineJune 2011iCAMP summer project
Outline What is machine learning? What is clustering? Example application areas Challenges Approaches‣ K-Means‣ K-Medoids / Affinity propagation‣ Linkage Implementation details
Machine learning Machine learning provides methods that automatically learn from data. Extract the underlying structure in the data to summarize information. Accurately predict future data based on what we learn from currentobservations: generalization. Typically need a large collection of data or strong prior information.
What is clustering? In classification, we have a labeled set of training points and we learnthe grouping structure in a supervised way. Classification tries to predict the label of (unlabeled) data. Clustering is grouping things into “natural” categories when no classlabel is available Clustering is unsupervised learning. Need to automatically decide on the grouping structure.
What is clustering? In classification, we have a labeled set of training points and we learnthe grouping structure in a supervised way. Classification tries to predict the label of (unlabeled) data. Clustering is grouping things into “natural” categories when no classlabel is available Clustering is unsupervised learning. Need to automatically decide on the grouping structure.
What is clustering? In classification, we have a labeled set of training points and we learnthe grouping structure in a supervised way. Classification tries to predict the label of (unlabeled) data. Clustering is grouping things into “natural” categories when no classlabel is available Clustering is unsupervised learning. Need to automatically decide on the grouping structure.
What is clustering? In classification, we have a labeled set of training points and we learnthe grouping structure in a supervised way. Classification tries to predict the label of (unlabeled) data. Clustering is grouping things into “natural” categories when no classlabel is available Clustering is unsupervised learning. Need to automatically decide on the grouping structure.
What is clustering? In classification, we have a labeled set of training points and we learnthe grouping structure in a supervised way. Classification tries to predict the label of (unlabeled) data. Clustering is grouping things into “natural” categories when no classlabel is available Clustering is unsupervised learning. Need to automatically decide on the grouping structure.
What is clustering? In classification, we have a labeled set of training points and we learnthe grouping structure in a supervised way. Classification tries to predict the label of (unlabeled) data. Clustering is grouping things into “natural” categories when no classlabel is available Clustering is unsupervised learning. Need to automatically decide on the grouping structure.
Why clustering? Labeling a large set of sample patterns can be costly. The contents of the database may not be known. Clustering can be used for finding features that will later be useful forcategorization. It may help to gain insight into the nature of the data. It may lead to discovery of distinct subclasses or similarities amongpatterns.
Why clustering? Labeling a large set of sample patterns can be costly. The contents of the database may not be known. Clustering can be used for finding features that will later be useful forcategorization. It may help to gain insight into the nature of the data. It may lead to discovery of distinct subclasses or similarities amongpatterns.
ClusteringGeneral approach for learning For a given set of points, xi , i {1, . . . , N } learn a class assignmentyi {1, . . . , K} for each data point. Describe each cluster c using a set of parameters θc . Use an objective (cost) function to measure the quality of clustering.‣ A function of model parameters and assignment variables.f (θ, Y ) Clustering is the process of optimizing the objective function.argmin f (θ, Y )θ, Y
ClusteringChallenges What cost function to use? What underlying structure to assume? How to measure similarity? How to decide on the number of clusters? Different answers to these questions may lead to different clusteringalgorithms and different clustering outcomes. Common objective: generalize well.
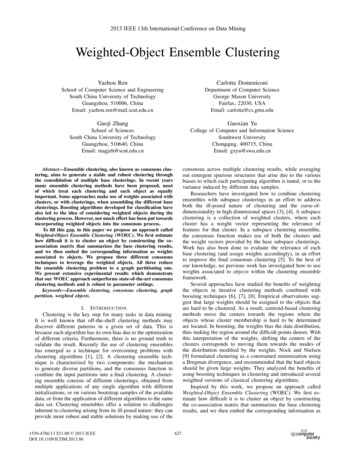
Diffusion Tensor Imaging Cluster brain fiber tracts toremove clutter from images. Group anatomically similarfibers into bundles.Klein et al., “Improving perception of brain structure using fiber clustering” SPIE Newsroom, 71/0771-2007-07-25.pdf
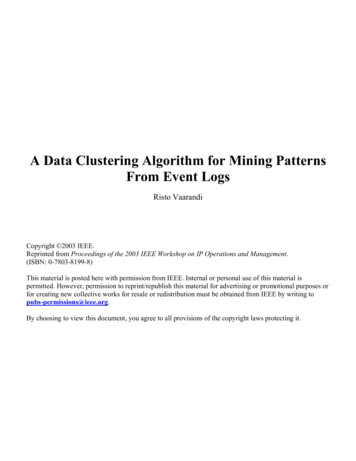
Software dependency structure Group related nodes together. Make bundles out of edges of thesame cluster.Telea and Ersoy, “Image-Based Edge Bundles: Simplified Visualization of LargeGraphs.” Computer Graphics Forum, 2010http://www.cs.rug.nl/ alext/PAPERS/EuroVis10/paper.pdf
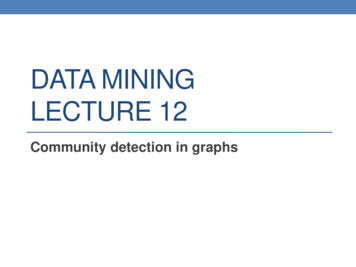
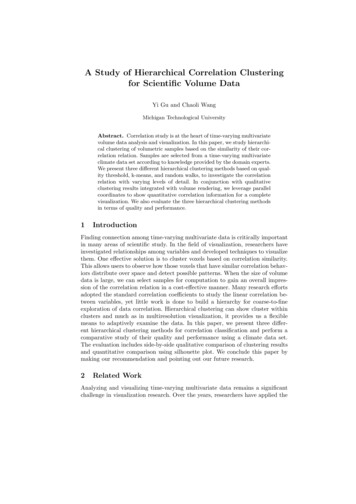
US migrationsTelea and Ersoy, “Image-Based Edge Bundles: Simplified Visualization of LargeGraphs.” Computer Graphics Forum, 2010http://www.cs.rug.nl/ alext/PAPERS/EuroVis10/paper.pdf
Document browsing Search for relevant documents.http://search.carrot2.org
Topic analysisWang and McCallum. “Topics over Time: A Non-Markov Continuous-Time Model of Topical Trends, KDD 2006http://www.cs.umass.edu/ mccallum/papers/tot-kdd06.pdf
Language families
Spike sortingGorur et al. “Modelling spikes with mixtures of factor analysers.” DAGM, 2004http://www.gatsby.ucl.ac.uk/ dilan/papers/pdf2646.pdf
Categorizing images1.7 1.1 0.6 0.0 1e 31.6 1.1 0.5 0.0 1e 31.4 1.0 0.5 0.0 1e 31.5 1.0 0.5 0.0 1e 31.9 1.3 0.6 0.0 1e 31.8 1.2 0.6 0.0 1e 3
Discovering states of differentiationData from Cinquin Lab
Many More Applications Marketing: finding groups of customers with similar behavior given a largedatabase of customer data containing their properties and past buying records; Biology: classification of plants and animals given their features; Libraries: book ordering; Insurance: identifying groups of motor insurance policy holders with a highaverage claim cost; identifying frauds; City-planning: identifying groups of houses according to their house type, valueand geographical location; Earthquake studies: clustering observed earthquake epicenters to identifydangerous zones; WWW: document classification; clustering weblog data to discover groups ofsimilar access patterns.
Why clustering? Labeling a large set of sample patterns can be costly. The contents of the database may not be known. Clustering can be used for finding features that will later be useful forcategorization. It may help to gain insight into the nature of the data. It may lead to discovery of distinct subclasses or similarities amongpatterns.
ClusteringGeneral approach for learning For a given set of points, xi , i {1, . . . , N } learn a class assignmentyi {1, . . . , K} for each data point. Describe each cluster c using a set of parameters θc . Use an objective (cost) function to measure the quality of clustering.‣ A function of model parameters and assignment variables.f (θ, Y ) Clustering is the process of optimizing the objective function.argmin f (θ, Y )θ, Y
ClusteringChallenges What cost function to use? What underlying structure to assume? How to measure similarity? How to decide on the number of clusters? Different answers to these questions lead to different clusteringalgorithms. Common objective: generalize well.
ClusteringDifferences in algorithmsAccording to the resulting structure: Flat clustering. Hierarchical clustering.According to the modeling framework: Deterministic clustering. Probabilistic models. Bayesian models.
K-means A flat clustering technique. A prototype-based approach. The samples come from a known number of clusters with prototypesµc , c {1, . . . , K} Each data point belongs to exactly one cluster.ric 1if xi belongs to cluster c,0otherwise.{ Alternative notation: yi {1, . . . , K} Task: find good prototypes and and good assignments of data points toprototypes.
K-meansAssigning data points to clusters Say we are given good prototypes. How should we assign data points to clusters? For each data point,‣ Calculate the distance of the data point to each of the prototypes.‣ Assign the point to its closest prototype.yi argmin xi µc c
K-meansAssigning data points to clusters Say we are given good prototypes. How should we assign data points to clusters? For each data point,‣ Calculate the distance of the data point to each of the prototypes.‣ Assign the point to its closest prototype.yi argmin xi µc c
K-meansLearning good prototypes Say we have good assignments of data points to clusters. How can we find good prototypes? Define the prototypes to be the mean of each cluster.µc !Ni:yi cncxi !Ni 1 ric xi!Ni 1 ric
K-meansLearning good prototypes Say we have good assignments of data points to clusters. How can we find good prototypes? Define the prototypes to be the mean of each cluster.µc !Ni:yi cncxi !Ni 1 ric xi!Ni 1 ric
K-meansLearning good prototypes Say we have good assignments of data points to clusters. How can we find good prototypes? Define the prototypes to be the mean of each cluster.µc !Ni:yi cncxi !Ni 1 ric xi!Ni 1 ric
K-meansUpdates We neither have good assignments nor good prototypes to start with. Solution: iterate to find a good fit to both.argminR, µN !K!i 1 c 1ric xi µc Convergence: when the cluster assignments do not change anymore.
Implementation DetailsK-means Each data point belongs to one cluster only. Need assignment variablesto remember the cluster membership of each data point. Need to remember the prototype vectors. Calculate distances between prototype vectors and data points. Find which prototype is the closest to each data point. Average over data points assigned to a cluster to find its prototypevector.
Implementation DetailsK-means Initialize cluster assignments:r ceil ( rand(1, N ) K) Initialize prototype vectors:µc mean(X(Y c, :)) Repeat until convergence:‣ Remember current assignments: oldY Y‣ Update cluster assignments:- for i 1 : Ndd(k) !d(xid µcd )2- [d1 r(i)] min(dd)‣ Update prototype vectors:- µc mean (X(Y k, :)) Converged if old assignments is the same as the new assignments.
Affinity Propagation Similar idea to k-means:‣ Find prototype vectors to represent clusters.‣ Assign each data point to the cluster with closest prototype.‣ Update prototype vectors. Difference: Prototypes are chosen from the dataset.
Hierarchical Clustering
Hierarchical clusteringMotivation Shorter search time More intuitive relationships between groups of data points More structure in the representation, varying degrees of similarity Easier and nicer to visualizeUses of hierarchical clustering: recover underlying structure: we believe that the data hasan underlying tree structure visualize data: understand relationship among data items summarize data: a way to partition data into different(possibly unrelated) groups
Hierarchical clusteringDifferent approaches Top-down divisive.‣ Start with assigning all data points to one (or a few coarse) cluster.‣ Recursively split each cluster.‣ Uses a flat clustering algorithm as a subroutine. Bottom-up agglomerative.‣ Start with assigning each data point to its own cluster.‣ Iteratively find pairs of clusters to merge.‣ Clusters found by finding pairs with maximum similarity. Dominant approach is bottom-up: better search landscape, moreflexible algorithms, but is more myopic.
Hierarchical clusteringLinkage algorithm Choose a distance measure‣ between pairs of points: e.g. Euclidian, Hamming‣ between pairs of clusters of points: e.g. average linkage, minimum linkage Start with each data point in its own cluster at the leaf nodes‣ compute distance of each pair of nodes‣ merge the closest pair into a new node‣ repeat
Hierarchical clusteringLinkage algorithm Choose a distance measure‣ between pairs of points: e.g. Euclidian, Hamming‣ between pairs of clusters of points: e.g. average linkage, minimum linkage Start with each data point in its own cluster at the leaf nodes‣ compute distance of each pair of nodes‣ merge the closest pair into a new node‣ repeat
Hierarchical clusteringLinkage algorithm Choose a distance measure‣ between pairs of points: e.g. Euclidian, Hamming‣ between pairs of clusters of points: e.g. average linkage, minimum linkage Start with each data point in its own cluster at the leaf nodes‣ compute distance of each pair of nodes‣ merge the closest pair into a new node‣ repeat
Hierarchical clusteringLinkage algorithm Choose a distance measure‣ between pairs of points: e.g. Euclidian, Hamming‣ between pairs of clusters of points: e.g. average linkage, minimum linkage Start with each data point in its own cluster at the leaf nodes‣ compute distance of each pair of nodes‣ merge the closest pair into a new node‣ repeat
Hierarchical clusteringLinkage algorithm Choose a distance measure‣ between pairs of points: e.g. Euclidian, Hamming‣ between pairs of clusters of points: e.g. average linkage, minimum linkage Start with each data point in its own cluster at the leaf nodes‣ compute distance of each pair of nodes‣ merge the closest pair into a new node‣ repeat
Hierarchical clusteringLinkage algorithm Choose a distance measure‣ between pairs of points: e.g. Euclidian, Hamming‣ between pairs of clusters of points: e.g. average linkage, minimum linkage Start with each data point in its own cluster at the leaf nodes‣ compute distance of each pair of nodes‣ merge the closest pair into a new node‣ repeat
Hierarchical clusteringLinkage algorithm Choose a distance measure‣ between pairs of points: e.g. Euclidian, Hamming‣ between pairs of clusters of points: e.g. average linkage, minimum linkage Start with each data point in its own cluster at the leaf nodes‣ compute distance of each pair of nodes‣ merge the closest pair into a new node‣ repeat
Hierarchical clusteringLinkage algorithm Choose a distance measure‣ between pairs of points: e.g. Euclidian, Hamming‣ between pairs of clusters of points: e.g. average linkage, minimum linkage Start with each data point in its own cluster at the leaf nodes‣ compute distance of each pair of nodes‣ merge the closest pair into a new node‣ repeat
Hierarchical clusteringLinkage algorithm Choose a distance measure‣ between pairs of points: e.g. Euclidian, Hamming‣ between pairs of clusters of points: e.g. average linkage, minimum linkage Start with each data point in its own cluster at the leaf nodes‣ compute distance of each pair of nodes‣ merge the closest pair into a new node‣ repeat Use distance in the representation.
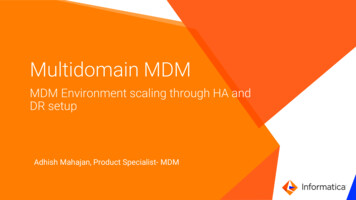
Linkage AlgorithmsDistance between clusters Single (or minimum) linkage:dist(A, B) mindist(xi , xj )maxdist(xi , xj )xi A,xj B Complete (or maximum) linkage:dist(A, B) xi A,xj B Average linkage:1dist(A, B) A B !xi A,xj Bdist(xi , xj )
Implementation DetailsLinkage Initialize a list of clusters with each data point in its own cluster. At each iteration, merge two clusters (nodes): there will be a total of N-1iterations and 2N-1 nodes. Compute distances between every pair of nodes. Pick the pair of nodes with smallest distance. Merge the pair:‣ Remove these nodes from representation.‣ Include the new node in the representation. Repeat until a single node remains in the representation.
ClusteringCell-Cycle Phase and Differentiation
Cell-cycle phase and differentiation clusteringData and task descriptionOriginal ImagePreprocessingAutomatic SeedingSegmentation
Cell-cycle phase and differentiation clusteringProcess detailsSegmented ImageVisualizationValidationFeature ExtractionFeature SelectionClustering
Cell-cycle phase and differentiation clusteringResults
Cell-cycle phase and differentiation clusteringResults
Machine learning Machine learning provides methods that automatically learn from data. Extract the underlying structure in the data to summarize information. Accurately predict future data based on what we learn from current observations: generalization. Typically need a large collection of data or strong prior information.