Transcription
(2022) 22:378Kim et al. BMC en AccessRESEARCHPredictive biomarkers for the efficacyof nivolumab as 3rd‑line therapy in patientswith advanced gastric cancer: a subset analysisof ATT RAC TION‑2 phase III trialJwa Hoon Kim1,2†, Min‑Hee Ryu1†, Young Soo Park3, Jungeun Ma1, Sun Young Lee1,4, Deokhoon Kim3,4 andYoon‑Koo Kang1*AbstractPurpose: The phase 3 ATT RAC TION-2 study demonstrated that nivolumab monotherapy improved survival com‑pared to placebo in patients with pretreated advanced gastric cancer (AGC). However, the efficacy of nivolumabseems to be limited to a subset of patients.Materials and methods: The predictive values of blood neutrophil–lymphocyte ratio (NLR), serum Na, PD-L1 expres‑sion, MSI status, tumor EBV infection, and tumor mutation burden (TMB) were investigated in patients with AGCrefractory to 2 lines of chemotherapy enrolled from Asan Medical Center in ATT RAC TION-2 study.Results: All 45 patients were analyzed; nivolumab (n 28) and placebo (n 17) groups. The objective response rate,median progression-free survival (PFS), and overall survival (OS) were 16.7%, 1.6 months, and 8.1 months in nivolumabgroup and 0%, 1.6 months and 6.5 months in placebo group. When comparing nivolumab with the placebo group,tumor PD-L1 expression, blood NLR, and serum Na were significant predictive factors of PFS and OS. A multivari‑ate analysis revealed that PD-L1 ( ) and low NLR ( 2.9, median) were associated with better PFS. In the nivolumabgroup, PD-L1 ( ), low NLR, and normal Na ( 135 mmol/L) were associated with higher response and disease controlrates, while tumor EBV infection and TMB were not.Conclusion: Tumor PD-L1 expression, blood NLR, and serum Na could be predictive biomarkers for the efficacy ofnivolumab in previously treated cases of AGC.Keywords: Advanced gastric cancer, Nivolumab, Predictive biomarkers, SurvivalIntroductionImmune checkpoint inhibitors increase antitumor T cellactivity by inhibiting immune checkpoints including programmed death-1 (PD-1)/PD ligand 1 (PD-L1) [1]. The*Correspondence: ykkang@amc.seoul.kr†Jwa Hoon Kim and Min-Hee Ryu contributed equally to this work.1Department of Oncology, Asan Medical Center, University of UlsanCollege of Medicine, 88 Olympic‑ro 43‑gil, Songpa‑gu, Seoul 05505,Republic of KoreaFull list of author information is available at the end of the articleoverexpression of immune checkpoints is associated withthe escape mechanism of host immunity and has beenobserved in various types of cancer [1]. Nivolumab andpembrolizumab are human IgG4 monoclonal antibodiestargeting PD-1 that are well established to improve survival in multiple solid tumors with a durable response[2–5]. In this aspect, several phase I/II trials [6–8] havereported the antitumor activity of nivolumab or pembrolizumab in advanced gastric or gastroesophagealjunction cancer (G/GEJ cancer). The Author(s) 2022. Open Access This article is licensed under a Creative Commons Attribution 4.0 International License, whichpermits use, sharing, adaptation, distribution and reproduction in any medium or format, as long as you give appropriate credit to theoriginal author(s) and the source, provide a link to the Creative Commons licence, and indicate if changes were made. The images orother third party material in this article are included in the article’s Creative Commons licence, unless indicated otherwise in a credit lineto the material. If material is not included in the article’s Creative Commons licence and your intended use is not permitted by statutoryregulation or exceeds the permitted use, you will need to obtain permission directly from the copyright holder. To view a copy of thislicence, visit http:// creat iveco mmons. org/ licen ses/ by/4. 0/. The Creative Commons Public Domain Dedication waiver (http:// creat iveco mmons. org/ publi cdoma in/ zero/1. 0/) applies to the data made available in this article, unless otherwise stated in a credit line to the data.
Kim et al. BMC Cancer(2022) 22:378The ATT R AC TION-2 study was the first randomizedphase III trial demonstrating the efficacy of nivolumab vs.placebo in patients with advanced G/GEJ cancer refractory to 2 lines of chemotherapy (median overall survival [OS], 5.26 vs. 4.14 months; hazard ratio [HR], 0.63,P 0.001 and median progression-free survival [PFS],1.61 vs. 1.45 months; HR, 0.60, P 0.001) [9]. Althoughthe primary endpoint of OS was met, the objectiveresponse rate (ORR) was only 11.2% and no benefit incases of rapid progression was observed in half of thestudy patients. These findings indicated that the efficacyof nivolumab may be limited to a certain population ofpatients, raising a need to identify predictive markers toselect patients who can benefit from nivolumab.Recently, the post hoc analysis from the ATT R AC TION-2 study has been reported. This study exploredthe baseline clinical characteristics of the patients andextracted double factor combinations (serum Na andwhite blood cell count or neutrophil–lymphocyte ratio[NLR]) for prediction of benefit from nivolumab [10].The triple factor combination, including age, peritonealmetastasis, and serum Na, also showed the significantassociation with benefit from nivolumab [10]. A highblood NLR has been reported as a poor prognostic factor in a variety of cancers treated with chemotherapy[11] and also with immune checkpoint inhibitors [12].Hyponatremia (hypoNa, serum Na 135 mmol/L),although relatively obscure, has been suggested as apoor prognostic factor in many cancer types [13–15].This clinical classification is meaningful because theseare easily available to clinicians in daily practice. However, it would be more valuable if these factors wereanalyzed together with potential biomarkers, includingtumor PD-L1 expression, tumor microsatellite instability(MSI) status, tumor Epstein-Barr virus (EBV) infection,and tumor mutation burden (TMB), which were previously reported as promising biomarkers in immunological perspective. Higher ORRs with pembrolizumab wereobserved in PD-L1 positive (combined positive score[CPS] 1%) or MSI-high gastric cancer [7] and othervarious solid tumors [1, 16]. According to The CancerGenome Atlas [1], EBV-positive tumors are associatedwith a high level of PD-L1 expression, suggesting thatEBV infection could be a potential biomarker for immunotherapy. TMB has also been investigated as a predictorof immunotherapy response [17], and a high TMB in thetumor has been associated with a favorable response toimmunotherapy [18].To date, clear standards for selecting patients expectedto exhibit optimal efficacy with nivolumb remain unelucidated. Tissues required for the molecular analyses werecollected only in 40% of the patients in the ATT R AC TION-2 study, thereby limiting the evaluation of tumorPage 2 of 10tissue-based biomarkers for predicting the efficacy ofnivolumab. This study is a subset analysis with patientsenrolled in the ATT R AC TION-2 study from a singleinstitution, Asan Medical Center (AMC). Given theadvantages of available tissues, consistent management,well-controlled data quality by continuous involvementof investigators throughout the study as a single institution study and an optimal two-armed design by includinga control group for evaluating the predictive values, thisstudy aimed to investigate the predictive values of potential biomarkers such as tumor PD-L1 expression, tumorMSI status, tumor EBV infection, TMB, blood NLR, andserum Na to provide objective guidance in identifyingpatients with clinical benefits to nivolumab.Materials and methodsPatientsThe ATT R AC TION-2 phase III trial was previouslyreported as a randomized, double-blind, placebo-controlled study at 49 clinical sites in Asia and enrolledpatients with advanced G/GEJ cancer refractory to 2lines of chemotherapy [9]. The eligibility criteria and trialdesign were previously described [9]. AMC participatedin the ATT R AC TION-2 phase III trial as one of thestudy sites, and the present study includes these 45 AMCpatients. The study protocol was approved by the Institutional Review Board of the AMC and was conductedin accordance with the Declaration of Helsinki and goodclinical practice.Laboratory values at baselineBlood tests were performed prior to the patient receivingnivolumab or placebo treatment. The baseline blood NLRwas calculated by dividing the absolute neutrophil countby the absolute lymphocyte count. The cut-off value forlow vs. high NLR was the median value of the AMCpatients (2.9). The cut-off value for hypoNa vs. normalserum Na at baseline was the lower limit of the referencevalue ( 135 mmol/L).Tumor tissue collectionPrimary or metastatic tumor tissues that were obtainedfrom endoscopic or other biopsy or surgery before thenivolumab or placebo treatment were used to analyzePD-L1 expression, MSI status, EBV infection, and TMB.Identical whole-slide sections were used for PD-L1 andMSI immunohistochemistry (IHC) staining, EBV in situhybridization (ISH), and next-generation sequencing(NGS). Insufficient or inadequate tissues were substituted with other available tissues prior to the nivolumabor placebo treatment.
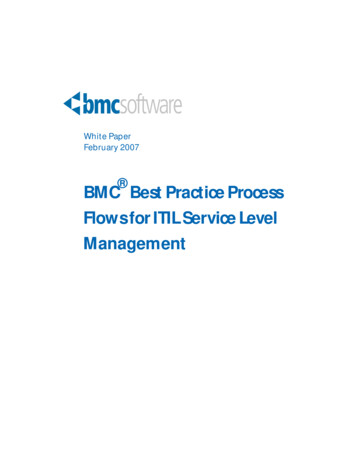
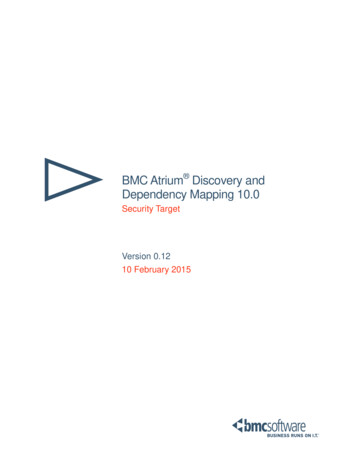
Kim et al. BMC Cancer(2022) 22:378PD‑L1 immunohistochemistryIHC staining was performed on a Dako AutostainerLink 48 system (Agilent Technologies) using a DakoPD-L1 IHC 22C3 pharmDx kit (Agilent Technologies).The level of PD-L1 protein expression was determinedusing the CPS, which was calculated as the numberof PD-L1-stained cells (tumor cells, lymphocytes, andmacrophages) divided by the total number of viabletumor cells and multiplied by 100. Tumor PD-L1 positivity was defined as CPS 1%.MSI immunohistochemistry and EBV in situ hybridizationMSI status was determined by IHC for mismatch repair(MMR) proteins (MLH-1, MSH-2, PMS-2, and MSH6) in formalin-fixed paraffin-embedded (FFPE) tissues.MSI-high was defined as negative staining for at leastone of the MMR proteins. EBV ISH was performedin FFPE tissues using the Bench Mark XT autostainer(Ventana Medical Systems) and ISH iVIEW Blue Detection Kit (Ventana Medical Systems), according to themanufacturer’s instructions.Targeted next‑generation sequencingTargeted NGS was performed using the NextSeq 550platform (Illumina) with OncoPanel AMC version 3(OP AMCv3; Aglient Technologies) for capturing theexons of 199 cancer-related genes, 184 hotspots, andpartial introns from eight genes often rearranged incancer. The TMB was calculated as the number of nonsynonymous single nucleotide variants, insertions, anddeletions in the tumor exome data.Statistical analysisCategorical and quantitative data were comparedusing the Chi-square test or Fisher’s exact test andMann–Whitney U-test, respectively. Survival rateswere estimated using the Kaplan–Meier method withthe log-rank test and predictive values were evaluatedby testing the interaction between each biomarker andnivolumab treatment. Cox’s proportional hazard modelwas used for multivariate analysis. The multivariateanalysis included factors with statistical significance(defined as P 0.15) in the univariate analysis. A twosided P 0.05 was considered significant.ResultsPatient characteristicsBetween November 2014 and February 2016, 493patients were enrolled and randomly assigned toreceive either nivolumab (n 330) or placebo (n 163)in the ATT R AC TION-2 phase III trial [9]. The AMC, asingle tertiary center, registered 45 patients; 28 in thePage 3 of 10nivolumab group and 17 in the placebo group, and thisexploratory analysis included these 45 AMC patients.Baseline laboratory, tissue, and NGS analyses were performed in patients with available data (Fig. 1). The cutoff value of baseline blood NLR was 2.9 (median valueof the AMC patients) and 135 mmol/L for baselineserum Na (reference value lower limit). Table 1 showsthe baseline characteristics comparing the nivolumaband placebo groups. There were no significant differences between the nivolumab and placebo groups.Furthermore, the baseline characteristics were similarbetween the AMC patients and the overall patients inATT R AC TION-2 study.Analysis of potential biomarkersBaseline blood NLR and serum Na were examined in all45 patients (Fig. 1). Low baseline blood NLR ( 2.9) andhypoNa at baseline serum were observed in 23 (51.1%)and 7 (15.6%) patients, respectively (Table 1). Of the 45patients, tissue analysis was performed in 36 patientswith sufficient and adequate tissues (Fig. 1), which wereall obtained before the nivolumab or placebo treatment.Of the 36 tissues, 19 were acquired from endoscopicor other biopsy and 17 from surgery. The tissues wereobtained from primary tumors of the stomach (n 30)and metastatic lesions (n 6). There were 13 patients(36.1%) with tumor PD-L1 CPS ( 1%) and 4 (11.2%) withtumor PD-L1 CPS ( 10%). Six patients (16.7%) wereconfirmed to have EBV ( ) gastric cancer, and MSI-highgastric cancer was not observed (Table 1). Additionally,36 tissues passed the quality control for NGS, and 3 tissues were substituted with others due to insufficiencyor inadequacy. These other 3 tissues were acquired fromendoscopic biopsy of the primary stomach lesion (n 1)and surgery of metastatic lesions (n 2). Following exclusion due to insufficient or inadequate tissue, NGS analysis was performed on a final of 29 patients (Fig. 1). Themedian TMB value was 8.2 (range, 0.0–21.3) mutations/megabase (Table 1). No significant differences in baselinecharacteristics according to each predictive marker wereobserved, except for a low proportion of human epidermal growth factor receptor 2 (HER2)-positive status inpatients with low baseline blood NLR.Predictive value of potential biomarkers in PFS and OSWith a median follow-up duration of 28.3 months in surviving patients, 43 patients (95.6%) experienced diseaseprogression and 41 (91.1%) died from the gastric cancer.The ORR, median PFS, and OS were 16.7%, 1.6 months,and 8.1 months, respectively, in the nivolumab groupand 0%, 1.6 months, and 6.5 months, respectively, inthe placebo group. There were no significant differences
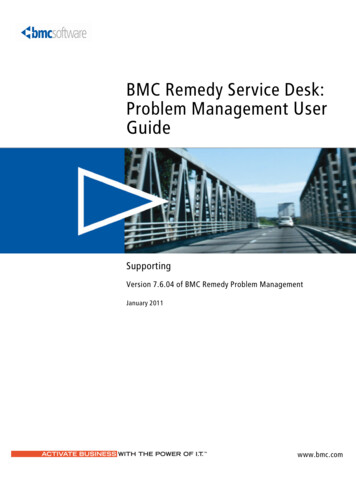
Kim et al. BMC Cancer(2022) 22:378Page 4 of 10Fig. 1 Consort flow diagrambetween the AMC and overall patients in the ATT R AC TION-2 study (Table S1).In patients with tumor PD-L1 CPS ( 1%), the medianPFS was 9.6 months in the nivolumab group and1.6 months in the placebo group (P 0.028), and themedian OS was 19.2 months in the nivolumab groupand 8.3 months in the placebo group (P 0.070). Inpatients with tumor PD-L1 CPS ( 1%), the median PFSwas 1.4 months in the nivolumab group and 2.6 monthsin the placebo group (P 0.897), and the median OS was5.9 months in the nivolumab group and 5.5 months in theplacebo group (P 0.681) (Fig. 2) (Pfor interaction 0.003).In patients with low baseline blood NLR, the medianPFS was 3.7 months in the nivolumab group and1.6 months in the placebo group (P 0.020), and themedian OS was 11.2 months in the nivolumab group and6.5 months in the placebo group (P 0.037). In patientswith high baseline blood NLR ( 2.9), the median PFSwas 1.4 months in the nivolumab group and 1.4 monthsin the placebo group (P 0.901), and the median OS was5.5 months in the nivolumab group and 4.2 months in theplacebo group (P 0.679) (Fig. 2) (Pfor interaction 0.007).In patients with normal baseline serum Na( 135 mmol/L), the median PFS was 2.8 months in thenivolumab group and 1.6 months in the placebo group(P 0.070), and the median OS was 9.8 months in thenivolumab group and 6.5 months in the placebo group(P 0.018). In patients with hypoNa at baseline serum,the median PFS was 0.8 months in the nivolumab groupand 1.4 months in the placebo group (P 0.706), and themedian OS was 1.4 months in the nivolumab group and2.7 months in the placebo group (P 0.221) (Fig. 2) (Pforinteraction 0.026).Univariate and multivariate analyses for PFS and OSTable S2 summarizes the univariate and multivariateanalyses for PFS and OS. After multivariate analysis forPFS, low baseline blood NLR was associated with betterPFS (HR 0.56, 95% confidence interval [CI] 0.30–1.04,P 0.067). After multivariate analysis for OS, HER2 status (positive vs. negative) (HR 0.12, 95% CI 0.04–0.37,P 0.001), treatment line (3rd line vs. 4th line) (HR 0.31,95% CI 0.14–0.66, P 0.003), baseline blood NLR ( 2.9vs. 2.9) (HR 0.34, 95% CI 0.17–0.70, P 0.003), andbaseline serum Na ( 135 vs. 135 mmol/L) (HR 0.16,95% CI 0.05–0.45, P 0.001) remained as significantfactors.In the 36 patients where tissue was available for analysis (Table 2), baseline blood NLR ( 2.9 vs. 2.9) (HR0.46, 95% CI 0.22–0.95, P 0.037) and tumor PD-L1 CPS( 1% vs. 1%) (HR 0.32, 95% CI 0.14–0.72, P 0.006)remained as significant factors after multivariate analysis for PFS. For OS, age ( 65 years vs. 65 years) (HR0.33, 95% CI 0.14–0.78, P 0.012) and tumor PD-L1 CPS
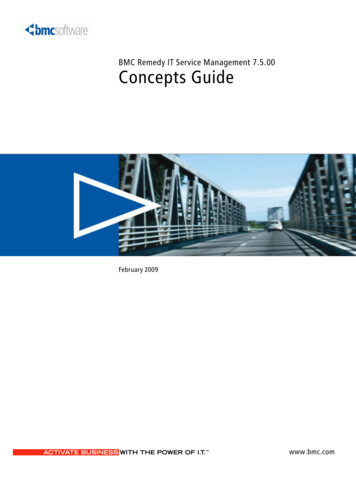
Kim et al. BMC Cancer(2022) 22:378Page 5 of 10Table 1 Baseline characteristics of the 45 AMC patientsBaseline characteristicsTotal (n 45), %Nivolumab (n 28), %Placebo (n 17), %Age (median, range)60 (23–76)60 (23–76)59 (33–74)Sex (Male)34 (75.6)21 (75.0)13 (76.5)Metastatic organsLiver13 (29.5)10 (35.7)3 (18.8)Peritoneum14 (31.8)8 (28.6)6 (37.5)Lymph node27 (60.0)17 (60.7)10 (58.8)Others7 (15.9)5 (17.8)2 (12.5)19 (42.2)13 (46.4)6 (35.3)Prior gastrectomyNumber of metastatic organs 226 (57.8)14 (50.0)12 (70.6)HER2 positive10 (22.2)6 (21.4)4 (23.5)Treatment line 3rd line24 (53.3)13 (46.4)11 (64.7) 4th line21 (46.7)15 (56.6)6 (35.3)Baseline blood NLR 2.9Baseline serum Na 135 mmol/LTissue analysisPD-L123 (51.1)13 (46.4)10 (58.8)38 (84.4)24 (85.7)14 (82.4)Total (n 36), %Nivolumab (n 22), %Placebo (n 14), %CPS 1%23 (63.9)14 (63.6)9 (64.3)CPS 1%13 (36.1)8 (36.4)5 (35.7)CPS 10%MSI-high4 (11.2)2 (9.1)2 (14.3)0 (0.0)0 (0.0)0 (0.0)EBV-positive6 (16.7)5 (22.7)1 (7.1)Next-generation sequencing analysisTotal (n 29), %Nivolumab (n 15), %Placebo (n 14), %TMB (/Mb)8.2 (0.0–21.3)9.8 (0.0–21.3)8.2 (1.6–16.4)AMC Asan Medical Center, NLR Neutrophil–lymphocyte ratio, MSI Microsatellite instability, EBV Epstein-Barr Virus, TMB Tumor mutation burden( 1% vs. 1%) (HR 0.44, 95% CI 0.20–0.97, P 0.040)remained as significant factors after multivariate analysis.Evaluation of response and PFS with nivolumab accordingto predictive biomarkersTable 3 presents the ORR and DCR with nivolumab inpatients with measurable disease and tissue analysiscompared according to the potential biomarkers. Whencomparing the ORR and DCR with nivolumab according to each potential biomarker to their counterparts, alow baseline blood NLR, normal baseline serum Na, andtumor PD-L1 CPS ( 1%) were associated with a higherORR and DCR, whereas tumor EBV infection and a highTMB in the tumor were not.In Fig. 3, response and PFS following nivolumab administration are shown according to baseline blood NLR,serum Na, and tumor PD-L1 in 21 patients with available tissue analysis in the nivolumab group. Seven out ofthe eight (87.5%) patients with tumor PD-L1 CPS ( 1%)showed more than stable disease with a durable PFS.Three patients with all 3 predictive biomarkers (low baseline blood NLR, normal baseline serum Na, and tumorPD-L1 CPS [ 1%]) exhibited approximately 2 years ofPFS, with one of them showing a complete response. Twopatients with tumor PD-L1 CPS ( 1%) but high NLR andhypoNa at baseline serum showed shorter PFS, and earlyprogressive disease was observed in one of these patients,with a high NLR of 12 and hypoNa at baseline serum. Inthe 13 patients with tumor PD-L1 CPS ( 1%), 10 (76.9%)showed progressive disease. Still, two patients withlow baseline blood NLR and normal baseline serum Nashowed a partial response and stable disease with a durable PFS ( 6 months) despite tumor PD-L1 CPS ( 1%).Treatment‑related adverse events with nivolumabTreatment-related adverse events (TRAE) withnivolumab are shown in Table S3. The most commonTRAE of any grade was pruritis (n 9, 32.1%) and therewere two grade 3 or 4 TRAE; fatigue (n 1, 3.6%) andanorexia (n 1, 3.6%). Common TRAE ( 5%) of anygrade included flu-like syndrome (n 5, 17.9%), AST orALT elevation (n 5, 17.9%), anorexia or nausea (n 5,17.9%), diarrhea (n 4, 14.3%), skin rash (n 3, 10.7%),and hyperglycemia (n 3, 10.7%). One patient (3.6%) hadhypothyroidism.
Kim et al. BMC Cancer(2022) 22:378Page 6 of 10Fig. 2 PFS (a) and OS (b) in nivolumab vs. placebo group according to each potential predictive biomarkerTable 2 Univariate and multivariate analyses for PFS and OS in the 36 patients with available tissue analysis resultsProgression-free survivalUnivariate analysisHR (95% CI)Overall survivalMultivariate analysisP-value HR (95% CI)Univariate analysisP-value HR (95% CI)P-value HR (95% CI)Age ( 65 years vs. 65 years)0.78 (0.36–1.70) 0.5340.39 (0.17–0.92) 0.032Sex (male vs. female)0.76 (0.35–1.67) 0.5010.60 (0.28–1.30) 0.1970.79 (0.36–1.74) 0.561Multivariate analysisTx. (nivolumab vs. placebo)0.57 (0.27–1.22) 0.149Prior gastrectomy (yes vs. no)0.98 (0.48–1.99) 0.9480.82 (0.40–1.69) 0.5940.51 (0.25–1.05) 0.069HER2 (positive vs. negative)0.77 (0.35–1.73) 0.5320.57 (0.24–1.34) 0.198Number of metastatic organs ( 2vs. 2)0.69 (0.35–1.39) 0.3030.85 (0.42–1.72) 0.657P-value0.33 (0.14–0.78) 0.0120.62 (0.30–1.29) 0.201Treatment line (3rd line vs. 4th line)0.69 (0.33–1.42) 0.311Baseline blood NLR ( 2.9 vs. 2.9)0.57 (0.28–1.15) 0.1150.46 (0.22–0.95) 0.0370.60 (0.30–1.22) 0.160Baseline serum Na ( 135 mmol/Lvs. 135 mmol/L)0.39 (0.16–0.93) 0.0330.50 (0.19–1.30) 0.1560.39 (0.17–0.92) 0.0310.82 (0.28–2.39) 0.721Tumor PD-L1 CPS ( 1% vs. 1%)0.37 (0.17–0.83) 0.0160.32 (0.14–0.72) 0.0060.56 (0.26–1.20) 0.1360.44 (0.20–0.97) 0.040Tumor EBV (positive vs. negative)0.61 (0.24–1.60) 0.3120.57 (0.26–1.24) 0.1580.89 (0.37–2.18) 0.803HR Hazard ratio, CI Confidence interval, Tx Treatment, NLR Neutrophil–lymphocyte ratio, EBV Epstein-Barr VirusDiscussionThe current study evaluated the predictive values ofpotential biomarkers for the efficacy of nivolumab inadvanced G/GEJ cancer that had been heavily treatedwith chemotherapy. A significant efficacy of nivolumabcompared to placebo was observed in patients withtumor PD-L1 (CPS 1%), low baseline blood NLR, andnormal baseline serum Na in terms of PFS and OS, whileno differences in efficacy were observed under the opposite conditions (tumor PD-L1 CPS 1%, high NLR, and
Kim et al. BMC Cancer(2022) 22:378Page 7 of 10Table 3 Response to nivolumab in 24 patients with measurabledisease according to the potential predictive biomarkersObjective responserate (n, %)Diseasecontrol rate(n, %)1 (7.1)5 (35.7)3 (30)6 (60.0)Baseline blood NLR 2.9 (n 14) 2.9 (n 10)Baseline serum Na 135 mmol/L (n 4) 135 mmol/L (n 20)0 (0.0)1 (25.0)4 (20.0)10 (50.0)Tumor PD-L1CPS 1% (n 10)CPS 1% (n 8)CPS 10% (n 2)1 (10.0)2 (20.0)3 (37.5)7 (87.5)1 (50.0)2 (100.0)Tumor EBVNegative (n 13)Positive (n 5)3 (23.1)6 (46.2)1 (20.0)3 (60.0)1 (16.7)3 (50.0)2 (33.3)3 (50.0)Tumor mutation burden 8.2/Mb (n 6) 8.2/Mb (n 6)NLR Neutrophil–lymphocyte ratio, EBV Epstein-Barr VirushypoNa at baseline serum). After multivariate analysis, low baseline blood NLR was revealed as a significant factor for better PFS and OS, and normal baselineserum Na were also significant factors for OS. In the 36AMC patients where tissue analysis results were available, tumor PD-L1 (CPS 1%) and low baseline bloodNLR were significantly associated with better PFS in themultivariate analysis. In 24 AMC patients with measurable lesion and available tissue analysis results, PD-L1(CPS 1%) as well as low blood NLR and normal serumNa at baseline were associated with higher ORR andDCR, while tumor EBV infection and high TMB in thetumor were not. This study is a worthy study, despite asubgroup study, to complement the limitation of thepost-hoc analysis of the ATT R AC TION-2 study [10],which did not include tumor-tissue based biomarkersanalysis. The predictive value of both baseline blood NLRand serum Na, which were extracted as double-factorcombination for prediction of benefit from nivolumab inthe post-hoc analysis [10], was confirmed and could beconsidered to be robust, given these factors remainedsignificant after multivariate analysis with tumor tissuebased biomarkers. Furthermore, the predictive values oftumor tissue-based biomarkers, previously explored aspromising, could be validated in this study.PD-L1 as an immune checkpoint is a reasonable biomarker for predicting the treatment response to antiPD-1 or anti-PD-L1 therapies. In the KEYNOTE-059phase II study, patients with PD-L1 positive (CPS 1%)gastric cancer had a higher ORR of 15.5% than patientswith PD-L1 negative (CPS 1%) gastric cancer, withan ORR of 6.4% when treated with pembrolizumab asFig. 3 PFS of individual patients in the nivolumab group according to tumor PD-L1 expression, baseline blood NLR, and serum Na
Kim et al. BMC Cancer(2022) 22:378 3rd-line therapy [7]. Similarly, in the post-hoc analysis of the KEYNOTE-061 phase III study, pembrolizumab significantly improved OS compared withpaclitaxel as 2nd-line therapy in patients with PD-L1positive (CPS 10%) advanced gastric cancer, whereasPFS and OS curves between pembrolizumab and paclitaxel groups crossed in patients with PD-L1 positive(CPS 1%) gastric cancer [19]. These results suggestedthat although pembrolizumab was not superior to paclitaxel as a 2 nd-line therapy in the overall patients, it exhibited better survival in patients with higher tumor PD-L1expression (CPS 10%) compared with paclitaxel [19].In line with these findings, our results demonstrated thatPD-L1 positive (CPS 1%) gastric cancer was associatedwith an improved survival outcome with nivolumab, confirming the predictive value of tumor PD-L1 expression.The PD-L1 positive (CPS 1%) gastric cancer wasreported in approximately 60% in the KEYNOTE-059and KEYNOTE-061 studies using the same CPS with22C3 pharmDx assay and 18.2% of the KEYNOTE-061study was PD-L1 positive (CPS 10%) gastric cancer.Although these rates do not match thoroughly withthat of this study, survival benefit with immunotherapyaccording to the intensity of tumor PD-L1 expression wasconsistent. Notably, however, no difference in OS wasobserved according to tumor PD-L1 expression status inthe previous analysis of ATT R AC TION-2 phase III trialsin less than half of the subset of patients with availabletissue (approximately 40%). The difference in methodology may contribute to this discordance. The tumor proportion score (TPS) method with a 28–8 pharmDx assaywas used in the analysis of the ATT R AC TION-2 phaseIII trial, whereas the CPS method with a 22C3 pharmDxassay was used in this study. Our study also could notobserve significant predictive value of tumor PD-L1expression using TPS ( 1%) with a 22C3 pharmDx assayfor the response of nivolumab (Figure S1). Since the CPSmethod can detect the PD-L1-staining immune cells,which play a crucial role in the tumor microenvironment,this method may exhibit more robust and reproducibleresults to predict the response to immune checkpointinhibitors in patients with G/GEJ cancer [20].Along with tumor PD-L1 expression, a low baselineblood NLR was also associated with higher ORR andDCR and was noted as a significant factor for better PFSand OS in multivariate analyses. Despite many reportsconcerning the prognostic value of baseline blood NLR inadvanced gastric cancer treated with chemotherapy [11]or immune checkpoint inhibitors [12], most of the studieswere designed as single-arm studies, assessing its prognostic value within patients receiving anti-cancer treatmentonly. This limits the adequate evaluation of its predictiverole compared with other treatments or placebo. In thisPage 8 of 10study, by comparing the nivolumab group with the placebogroup, the predictive role of NLR was clearly shown, asnivolumab significantly improved PFS and OS in patientswith low baseline blood NLR, while no such differenceswere detected in patients with high baseline blood NLR.Moreover, when the PFS was examined in the nivolumabgroup, some distinct features were noted according to thebaseline blood NLR level (Fig. 3). Despite patients withtumor PD-L1 CPS ( 1%) showing a relatively long PFS,one patient with a high baseline blood NLR of 12 showeda very short PFS of 0.95 months, whereas in two patientswith low baseline blood NLR (2.7 and 1.2), a relatively longPFS with a durable response was observed despite tumorPD-L1 CPS ( 1%). These results may further support thevalue of baseline blood NLR in predicting the responsewith nivolumab along with other markers.This study revealed that hypoNa significantly loweredthe efficacy of nivolumab. The incidence of hypoNa inin gastrointestinal cancers is approximately 10% and isassociated with poor survival in various cancers [13, 15].However, the cause of hypoNa and its association withsurvival outcomes are unclear. HypoNa may simply beregarded to represent poor general condition and thismay explain, at least in part, its association with unfavorable clinical outcomes. However, a more specific roleof Na in the immune system has also been investigated.A high concentration of Na can enhance inflammatoryM1-associated macrophages and T helper-17 cells andreduce regulatory T cells and M2 macrophages [21–23].This impact of Na on the function of immune cells cansubsequently influence the onset and progression ofmany disease including cancers [21–23]. Although stillelusive, we suggest that low baseline serum Na levels cancontribute to a poor response to nivolumab.Tumor EBV infection is characterized by tumor PD-L1expression and intra- or peritumoral immune cell infiltration. EBV ( ) tumors can be considered as candidates forimmunotherapy. To date, however, clinical data regarding the response of EBV ( ) tumors to immunotherapyis lacking. One study in advanced gastric cancer treatedwith pe
Results: All 45 patients were analyzed; nivolumab (n 28) and placebo (n 17) groups. The objective response rate, median progression‑free survival (PFS), and overall survival (OS) were 16.7%, 1.6 months, and 8.1 months in nivolumab group and 0%, 1.6 months and 6.5 months in placebo group. When comparing nivolumab with the placebo group,