Transcription
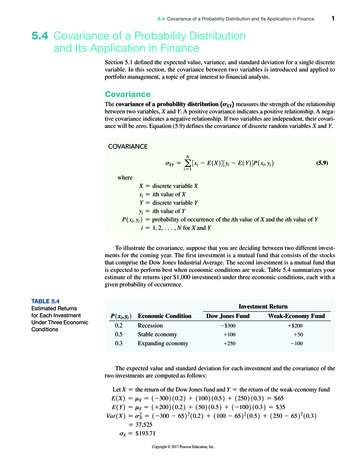
15.4 Covariance of a Probability Distribution and Its Application in Finance5.4 C ovariance of a Probability Distributionand Its Application in FinanceSection 5.1 defined the expected value, variance, and standard deviation for a single discretevariable. In this section, the covariance between two variables is introduced and applied toportfolio management, a topic of great interest to financial analysts.CovarianceThe covariance of a probability distribution 1SXY 2 measures the strength of the relationshipbetween two variables, X and Y. A positive covariance indicates a positive relationship. A negative covariance indicates a negative relationship. If two variables are independent, their covariance will be zero. Equation (5.9) defines the covariance of discrete random variables X and Y.CovariancesXY a 3xi - E1X243yi - E1Y24P1xi, yi 2N(5.9)i 1whereXxiYyiP1xi, yi 2i discrete variable Xith value of Xdiscrete variable Yith value of Yprobability of occurrence of the ith value of X and the ith value of Y1, 2, c, N for X and YTo illustrate the covariance, suppose that you are deciding between two different investments for the coming year. The first investment is a mutual fund that consists of the stocksthat comprise the Dow Jones Industrial Average. The second investment is a mutual fund thatis expected to perform best when economic conditions are weak. Table 5.4 summarizes yourestimate of the returns (per 1,000 investment) under three economic conditions, each with agiven probability of occurrence.Table 5.4Estimated Returnsfor Each InvestmentUnder Three EconomicConditionsInvestment ReturnP1xi, yi 20.20.50.3Economic ConditionDow Jones FundWeak-Economy FundRecessionStable economyExpanding economy- 300 200 100 50 250-100The expected value and standard deviation for each investment and the covariance of thetwo investments are computed as follows:Let XE1X2E1Y2Var1X2 sX the return of the Dow Jones fund and Y the return of the weak@economy fundmX 1 - 3002 10.22 11002 10.52 12502 10.32 65mY 1 2002 10.22 1502 10.52 1 - 1002 10.32 35s2X 1 - 300 - 652 2 10.22 1100 - 652 2 10.52 1250 - 652 2 10.3237,525 193.71Copyright 2017 Pearson Education, Inc.
2chapter 5 Discrete Probability Distributionsstudent tipThe covariancediscussed in this sectionmeasures the strengthof the linear relationshipbetween the probabilitydistributions of twovariables, while thesample covariancediscussed in Chapter 3measures the strengthof the linear relationshipbetween two numericalvariables.s2Y 1200 - 352 2 10.22 150 - 352 2 10.52 1 - 100 - 352 2 10.3211,025 105.001 - 300 - 652 1200 - 352 10.22 1100 - 652 150 - 352 10.52 1250 - 652 1 - 100 - 352 10.32 - 12,045 262.5 - 7,492.5 - 19,275Var1Y2 sY sXY Thus, the Dow Jones fund has a higher expected value (i.e., larger expected return) than theweak-economy fund but also has a higher standard deviation (i.e., more risk). The covarianceof - 19,275 between the two investment returns indicates a negative relationship in which thereturn of two investments are varying in the opposite direction. Therefore, when the return onone investment is high, typically, the return on the other investment is low.Expected Value, Variance, and Standard Deviationof the Sum of Two VariablesEquations (5.1) through (5.3) define the expected value, variance, and standard deviation of aprobability distribution, and Equation (5.9) defines the covariance between two variables, Xand Y. The expected value of the sum of two variables is equal to the sum of the expectedvalues. The variance of the sum of two variables is equal to the sum of the variances plustwice the covariance. The standard deviation of the sum of two variables is the square rootof the variance of the sum of two variables.Expected Value of the Sum of Two VariablesE1X Y2 E1X2 E1Y2(5.10)Variance of the Sum of Two VariablesVar1X Y2 s2X Y s2X s2Y 2sXY(5.11)Standard Deviation of the Sum of Two VariablessX Y 2s2X Y(5.12)To illustrate the expected value, variance, and standard deviation of the sum of two variables, consider the two investments previously discussed. If X return of the Dow Jones fundand Y return of the weak@economy fund, using Equations (5.10), (5.11), and (5.12),E1X Y2 E1X2 E1Y2 65 35 100s2X Y s2X s2Y 2sXY 37,525 11,025 122 1 - 19,2752 10,000sX Y 100The expected value of the sum of the return of the Dow Jones fund and the return ofthe weak-economy fund is 100, with a standard deviation of 100. The standard deviation ofthe sum of the two investments is less than the standard deviation of either single investmentbecause there is a large negative covariance between the investments.Copyright 2017 Pearson Education, Inc.
5.4 Covariance of a Probability Distribution and Its Application in Finance3Portfolio Expected Return and Portfolio RiskThe covariance and the expected value and standard deviation of the sum of two random variables can be applied to analyzing portfolios, or groupings of assets made for investment purposes. Investors combine assets into portfolios to reduce their risk (see references 1 and 2).Often, the objective is to try to maximize the return while making the risk as small as possible.For such portfolios, rather than study the sum of two random variables, the investor weightseach investment by the proportion of assets assigned to that investment. Equations (5.8) and(5.9) define the portfolio expected return and portfolio risk.Portfolio Expected ReturnThe portfolio expected return for a two-asset investment is equal to the weight assignedto asset X multiplied by the expected return of asset X plus the weight assigned to asset Ymultiplied by the expected return of asset Y.whereE1P2 wE1X2 11 - w2E1Y2(5.13)E1P2 portfolio expected returnw portion of the portfolio value assigned to asset X11 - w2 portion of the portfolio value assigned to asset YE1X2 expected return of asset XE1Y2 expected return of asset YPortfolio RiskThe portfolio risk for a two-asset investment is equal to the square root of the sum of thesethree products: w2 multiplied by the variance of X, 11 - w2 2 multiplied by the variance ofY, and 2 multiplied by w multiplied by 11 - w2 multiplied by the covariance.sp 2w2s2X 11 - w2 2s2Y 2w11 - w2sXY(5.14)In the previous section, you evaluated the expected return and risk of two different investments, a Dow Jones fund and a weak-economy fund. You also computed the covariance of the two investments. Now, suppose that you want to form a portfolio of these twoinvestments that consists of an equal investment in each of these two funds. To computethe portfolio expected return and the portfolio risk, using Equations (5.13) and (5.14), withw 0.50, E1X2 65, E1Y2 35, s2X 37,525, s2Y 11,025, and sXY - 19,275,E1P2 10.52 1652 11 - 0.52 1352 50sp 210.52 2 137,5252 11 - 0.52 2 111,0252 210.52 11 - 0.52 1 - 19,2752 22,500 50Thus, the portfolio has an expected return of 50 for each 1,000 invested (a return of 5%) anda portfolio risk of 50. The portfolio risk here is smaller than the standard deviation of eitherinvestment because there is a large negative covariance between the two investments. The factthat each investment performs best under different circumstances reduces the overall risk ofthe portfolio.Copyright 2017 Pearson Education, Inc.
4chapter 5 Discrete Probability DistributionsCollapses in the financial marketplace that have occurred in the recent past havecaused some investors to consider the effect of outcomes that have only a small chance ofoccurring but that could produce extremely negative results. (Some, including the authorof reference 6, have labeled these outcomes “black swans.”) Example 5.1 considers suchan outcome by examining the expected return, the standard deviation of the return, and thecovariance of two investment strategies—one that invests in a fund that does well whenthere is an extreme recession and the other that invests in a fund that does well under positive economic conditions.Example 5.6Computing theExpected Return,the Standard Deviation of the Return,and the Covarianceof Two InvestmentStrategiesYou plan to invest 1,000 in one of two funds. Table 5.5 shows the annual return (per 1,000)of each of these investments under different economic conditions, along with the probabilitythat each of these economic conditions will occur.Table 5.5Estimated Returns of Two FundsProbability0.010.090.150.350.300.10Economic ConditionExtreme recessionRecessionStagnationSlow growthModerate growthHigh growthBlack Swan FundGood Times Fund400- 303050100100- 200- 1005090250225For the Black Swan fund and the Good Times fund, compute the expected return and standarddeviation of the return for each fund, and the covariance between the two funds. Would youinvest in the Black Swan fund or the Good Times fund? Explain.Solution Let X Black Swan fund and Y Good Times fund.(continued)E1X2 mX 14002 10.012 1 - 302 10.092 1302 10.152 1502 10.352 11002 10.302 11002 10.102 63.30E1Y2 mY 1 - 2002 10.012 1 - 1002 10.092 1502 10.152 1902 10.35212502 10.302 12252 10.102 125.50Var1X2 s2X 1400 - 63.302 2 10.012 1 - 30 - 63.302 2 10.092 130 - 63.302 2 10.152150 - 63.302 2 10.352 1100 - 63.302 2 10.32 1100 - 63.302 2 10.12 2,684.11sX 51.81Var1Y2 s2Y 1 - 200 - 125.502 2 10.012 1 - 100 - 125.502 2 10.092 150 - 125.502 2 10.152 190 - 125.502 2 10.352 1250 - 125.502 2 10.32 1225 - 125.502 2 10.12 12,572.25sY 112.13sXY 1400 - 63.302 1 - 200 - 125.502 10.012 1 - 30 - 63.302 1 - 100 - 125.502 10.092 130 - 63.302 150 - 125.502 10.152 150 - 63.302 190 - 125.502 10.352 1100 - 63.302 1250 - 125.502 10.32 1100 - 63.302 1225 - 125.502 10.12sxy 3,075.85Copyright 2017 Pearson Education, Inc.
55.4 Covariance of a Probability Distribution and Its Application in FinanceThus, the Good Times fund not only has a much higher expected value (i.e., larger expectedreturn) than the Black Swan fund ( 125.50 as compared to 63.30 per 1,000) but also has amuch higher standard deviation ( 112.13 vs. 51.81). Deciding which fund to invest in is amatter of how much risk you are willing to tolerate. Although the Good Times fund has a muchhigher expected return, many people would be reluctant to invest in a fund where there is achance of a substantial loss.The covariance of 3,075.85 between the two investments indicates a positive relationshipin which the two investments are varying in the same direction. Therefore, when the return onone investment is high, typically, the return on the other is also high. However, from Table 5.5,you can see that the magnitude of the return varies, depending on the economic condition thatactually occurs. Therefore, you might decide to include both funds in your portfolio. The percentage allocated to each fund would be based on your tolerance of risk balanced by your desire formaximum return (see Problem 5.53).Problems for Section 5.4Learning the BasicsApplying the Concepts5.45 Given the following probability distributions for variables Xand Y:5.48 The process of being served at a bank consists of two independent parts—the time waiting in line and the time it takes to beserved by the teller. Suppose that the time waiting in line has anexpected value of 4 minutes, with a standard deviation of 1.2 minutes, and the time it takes to be served by the teller has an expectedvalue of 5.5 minutes, with a standard deviation of 1.5 minutes.Compute thea. expected value of the total time it takes to be served at thebank.b. standard deviation of the total time it takes to be served at thebank.P1x, y2XY0.41002000.6200100Computea. E1X2 and E1Y2.b. sX and sY.c. sXY.d. E1X Y2.5.46 Given the following probability distributions for variables Xand Y:P1x, y2XY0.2- 100500.450300.3200200.1300205.49 In the portfolio example in this section (see page 192), halfthe portfolio assets are invested in the Dow Jones fund and half ina weak-economy fund. Recalculate the portfolio expected returnand the portfolio risk ifa. 30% of the portfolio assets are invested in the Dow Jones fundand 70% in a weak-economy fund.b. 70% of the portfolio assets are invested in the Dow Jones fundand 30% in a weak-economy fund.c. Which of the three investment strategies (30%, 50%, or 70% inthe Dow Jones fund) would you recommend? Why?5.50 You are trying to develop a strategy for investing in two different stocks. The anticipated annual return for a 1,000 investment in each stock under four different economic conditions hasthe following probability distribution:Computea. E1X2 and E1Y2.b. sX and sY.c. sXY.d. E1X Y2.5.47 Two investments, X and Y, have the following characteristics:ReturnsE1X2 50, E1Y2 100, 9,000,2sY 15,000, and sXY 7,500.Probability0.1Recession0.3Slow growthIf the weight of portfolio assets assigned to investment X is 0.4,compute thea. portfolio expected return.b. portfolio risk.0.3Moderate growth0.3Fast growths2XCopyright 2017 Pearson Education, Inc.Economic ConditionStock XStock Y-10050015080- 20150- 100
6chapter 5 Discrete Probability Distributions5.54 You plan to invest 1,000 in a corporate bond fund or in acommon stock fund. The following table presents the annual return (per 1,000) of each of these investments under various economic conditions and the probability that each of those economicconditions will occur. Compute theCompute thea. expected return for stock X and for stock Y.b. standard deviation for stock X and for stock Y.c. covariance of stock X and stock Y.d. Would you invest in stock X or stock Y? Explain.5.51 Suppose that in Problem 5.50 you wanted to create a portfolio that consists of stock X and stock Y. Compute the portfolioexpected return and portfolio risk for each of the following percentages invested in stock X:a. 30%b. 50%c. 70%d. On the basis of the results of (a) through (c), which portfoliowould you recommend? Explain.5.52 You are trying to develop a strategy for investing in two different stocks. The anticipated annual return for a 1,000 investment in each stock under four different economic conditions hasthe following probability distribution:ReturnsProbabilityEconomic Condition0.1Recession0.3Slow growthStock XStock Y- 50-10020500.4Moderate growth1001300.2Fast growth150200Compute thea. expected return for stock X and for stock Y.b. standard deviation for stock X and for stock Y.c. covariance of stock X and stock Y.d. Would you invest in stock X or stock Y? Explain.5.53 Suppose that in Example 5.1, you wanted to create a portfolio that consists of the Black Swan fund and the Good Times fund.Compute the portfolio expected return and portfolio risk for eachof the following percentages invested in the Black Swan fund:a. 30%b. 50%c. 70%d. On the basis of the results of (a) through (c), which portfoliowould you recommend? Explain.EconomicConditionCorporateBond FundCommonStock Fund0.01Extremerecession-200- 9990.09Recession-70- 3000.15Stagnation30- 100Probability0.35Slow growth801000.30Moderate growth1001500.10High growth120350a. expected return for the corporate bond fund and for the common stock fund.b. standard deviation for the corporate bond fund and for the common stock fund.c. covariance of the corporate bond fund and the common stockfund.d. Would you invest in the corporate bond fund or the commonstock fund? Explain.e. If you chose to invest in the common stock fund in (d), what doyou think about the possibility of losing 999 of every 1,000invested if there is an extreme recession?5.55 Suppose that in Problem 5.54 you wanted to create a portfolio that consists of the corporate bond fund and the common stockfund. Compute the portfolio expected return and portfolio risk foreach of the following situations:a. 300 in the corporate bond fund and 700 in the common stockfund.b. 500 in each fund.c. 700 in the corporate bond fund and 300 in the common stockfund.d. On the basis of the results of (a) through (c), which portfoliowould you recommend? Explain.Copyright 2017 Pearson Education, Inc.
EG5.4 Covariance of a ProbabilityDistribution and its Application inFinanceKey Technique Use the SQRT and SUMPRODUCTfunctions (see Appendix Section F) to help compute theportfolio analysis statistics.Example Perform the portfolio analysis for the Section 5.2investment example.The worksheet (shown below) already contains the data forthe example. Overwrite the X and P1X2 values and the weight assigned to the X value when you enter data for other problems.If a problem has more or fewer than three outcomes, first selectrow 5, right-click, and click Insert (or Delete) in the shortcutmenu to insert (or delete) rows one at a time. If you insert rows,select the cell range B4:J4 and copy the contents of this rangedown through the new table rows.PHStat Use Covariance and Portfolio Analysis.For the example, select PHStat Decision-Making Covariance and Portfolio Analysis. In the procedure’s dialog box (shown below):1. Enter 6 as the Number of Outcomes.2. Enter a Title, check Portfolio Management Analysis,and click OK.In the new worksheet (shown below):1. Enter the probabilities and outcomes in the table that begins in cell B3.2. Enter 0.5 as the Weight assigned to X.The worksheet also contains a Calculations Areathat contains various intermediate calculations. Open theCOMPUTE FORMULAS worksheet to examine all theformulas used in this area.Workbook Use the COMPUTE worksheet of the Portfolio workbook as a template.7Copyright 2017 Pearson Education, Inc.
Dow Jones Fund Weak-Economy Fund 0.2 Recession- 300 200 0.5 Stable economy 100 50 0.3 Expanding economy 250 -100 The expected value and standard deviation for each investment and the covariance of the two investments are computed as follows: Let X the return of the Dow Jones fund and Y the