Transcription
Clinical Trial DesignStatistical Approaches and ConsiderationsMichael J. Pencina, PhD
Disclosures- Industry grants to Duke Clinical Research Institute- Consulting fees from Pamlab Inc2
Outline Numerous statistical and design approaches exist toincrease trial efficiency Many have been tried in cardiology, oncology andother areas We review a selection here including––––––Event driven trialsComposite outcomeAdaptive designsEnrichment designsBorrowing of controlsOpportunities in era of big data3
Event driven trials In time-to-event outcome studies power depends onthe number of events observed Efficiency is increased by stopping when minimumnecessary number of events is reached All follow-up is included in the analysis Blinded interim monitoring of event count allowsincreasing or decreasing planned study duration orincrease in enrolled sample4
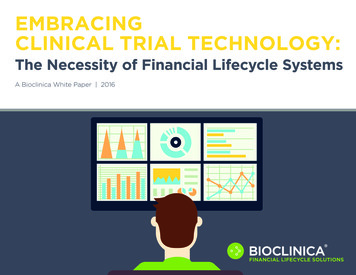
Composite Outcomes Number of primary outcome events can beincreased by combining different outcome types For example, major adverse cardiovascular events(MACE) consist of cardiovascular death, myocardialinfarction and stroke Time to first event or hierarchical composite used They should be of similar severity Analysis of individual components always conductedas sensitivity5
Example: Time to MACE composite1. Scirica BM et al. N Engl J Med 2013; 369: 1317–13262. White WB et al. N Engl J Med 2013; 369: 1327–13353. Green JB et al. NEJM 2015; DOI: 10.1056/NEJMoa15013526
Example: TAVI in aortic stenosis The Placement of Aortic Trans-catheter Valves(PARTNER) trial used Finkelstein-Schoenfeldhierarchical composite All-cause mortality first in hierarchy, hospitalizationfor heart failure second Multiple pairwise comparisons performed for allpatient pairs, first with respect to time to death andthen with respect to time to repeat hospitalization Method more powerful if some outcomes continuous1. Leon MB et al. N Engl J Med 2010; 363:1597-16072. Finkelstein DM, Schoenfeld DA. Stat Med 1999;18:1341-13547
Adaptive Designs Key study features (sample size, study duration,number of treatment arms) can be adapted based oninformation obtained at interim Blinded interim looks focus on combined parameters(event rate, overall mean, variance) and usually donot trigger alpha penalty Unblinded interim looks incorporate effect sizeobserved at interim and usually trigger alpha penalty Decision often based on conditional power8
Example: drop-the-losers design In stage A, k experimental and one control treatmentadministered Data unblinded and analyzed and only the besttreatment or any treatment exceeding pre-specifiedthreshold proceed to stage B along with control Final summary statistic based on sample sizeweighted combination of effect versus placebo fromstages A and BSampson and Sill, Biometrical Journal 2005 47(3): 257–2689
Biomarkers FDA’s Qualification process for drug development tools: A prognostic biomarker is a baseline patient or diseasecharacteristic that categorizes patients by degree of risk fordisease occurrence or progression. A prognostic biomarkerinforms about the natural history of the disorder in that particularpatient in the absence of a therapeutic intervention A predictive biomarker is a baseline characteristic that categorizespatients by their likelihood for response to a particular treatment. Apredictive biomarker is used to identify whether a given patient islikely to respond to a treatment intervention in a particular way(favorable or not)10
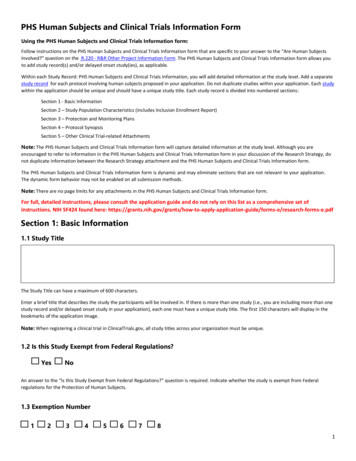
Example: Predictive biomarkersEffect of l-Methylfolate 15 mg/d vs Placebo on Pooled Mean ChangeFrom Baseline for HDRS-28 Stratified by Baseline Level of Plasma MarkerMarkerNPooled MeanChange vs. Placebo95% CIP-value 2.71 mg/L360.07-3.33, 3.480.966 2.71 mg/L37-4.57-7.73, -1.410.005 3.28 µg/mL37-4.55-7.61, -1.500.003 3.28 µg/mL36-0.11-3.67, 3.460.953SAM/SAHratio4-HNEPapakostas et al. J Clin Psychiatry 2014; 75:811
Adaptive Enrichment Designs G0 – all eligible subjects G1 – subset of all eligible subjects who possess non-wildtype alleles on either genotype A and B G2 – subset of eligible subjects who possess non-wild-typealleles on both genotype A and B Conditional power calculated at interim based on effectsize in each set Opportunity to enrich by recruiting only to subset G1 or G2Sampson and Sill, Biometrical Journal 2005 47(3): 257–26812
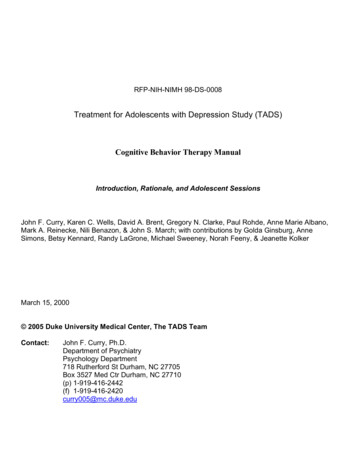
Sequential Parallel Comparison Design Developed to reduce impact of placebo response In stage A, individuals randomized to treatmentversus placebo (usually more to placebo) Stage A placebo non-responders re-randomized totreatment versus placebo Final summary statistic based on weightedcombination of effects from stages A and B Particular choice of weights enables interpretation aseffect after accounting for placebo responseFava M et al. Psychother. Psychosom. 72 (2003): 115-227.Doros G et al. Statistics in Medicine 32 (2013): 2767–2789.Chi G. Contemporary Clinical Trials Communications 2 (2016): 34-5313
ADAPT-A: Aripiprazole Augmentation of SSRIsSource: Fava et al, Psychotherapy and Psychosomatics 2012Response rateDrugPlaceboDifferenceSPCD Phase 118.5%17.4%1.1%SPCD Phase 218.0%7.9%10.1%Randomizen 2211Phase 1:DrugResponse 18.5%2PlaceboResponse 17.4%3NonResponders4Phase 2:DrugDrugResponse 18.0%PlaceboResponse 17.4%NonResponders5PlaceboResponse 7.9%
Borrowing Controls All or some controls are borrowed from “historical” data Numerous options:– Pooling: adds historical controls to randomized controls– Performance criterion: uses historical data to defineperformance criterion for current, treated-only trial to beat– Test then pool: test if controls sufficiently similar for pooling– Power priors: historical control discounted when added torandomized controls– Hierarchical modeling: variation between current vs.historical data is modeled in Bayesian fashionVeele K, Pharmaceutical statistics 201315
Opportunities in era of big data We might be able to run very large simple trials forfraction of cost– EHR-enabled trials pcornet ADAPTABLE – trial of aspirin doing in secondaryprevention with 20,000 patients with EHR as primary sourceof data capture– Registry-based trials SAFE-PCI in women – comparing access site (radial vs.femoral) in 1800 PCI or angiography with possible PCIwomen Several ongoing Registry-RCTs in Sweden16
ADAPTABLE Study DesignPatients with known ASCVD 1 “Enrichment Factor”Identified through EHR screening and electronic patient contact by CDRNs/PPRNs(PPRN patients would need to connect through a CDRN to participate)Patients contacted electronically with trial information and e-consent via web portalTreatment assignment will be provided directly to patient*Enrichment FactorsASA 81 mg QDASA 325 mg QD Age 65 years Creatinine 1.5 mg/dL Diabetes mellitus (type 1 or 2)Randomized Electronic Follow-Up: 3 vs 6 monthsSupplemented with EHR/CDM Data Queries Known 3-vessel CAD Current CVD or PAD Known EF 50% by echo, cath,nuclear study Current smokerDuration: Enrollment over 24 months;maximum follow up of 30 monthsPrimary Endpoint: Composite of all-cause mortality, hospitalizationfor MI, or hospitalization for strokePrimary Safety Endpoint: Hospitalization for major bleeding17
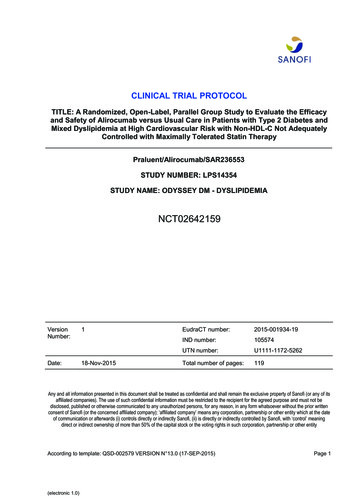
Methods - SAFE-PCI for Women WorkflowRandomizationDemographicsMedical HistoryProcedural dataAutopopulate trialdatabase with registry“big” dataUnique pages for trialAnalyticDatabase
Conclusions Numerous study designs and statistical approachesintend to approve trial efficiency Different approaches at different stages of adoption anddifferent potential for application in neuroscience studies In general, regulators more open to innovativeapproaches in smaller studies and/or earlier stages ofdevelopment (II vs. III) Careful consideration and appropriate statisticalexpertise in the planning stage needed to identifyapproaches most likely to succeed19
versus placebo (usually more to placebo) Stage A placebo non- responders re-randomized to treatment versus placebo Final summary statistic based on weighted combination of effects from stages A and B Particular choice of weights enables interpretation as effect after accounting for placebo response