Transcription
Journal of Hunger & Environmental NutritionISSN: 1932-0248 (Print) 1932-0256 (Online) Journal homepage: http://www.tandfonline.com/loi/when20A systematic review of food insecurity among USstudents in higher educationAydin Nazmi, Suzanna Martinez, Ajani Byrd, Derrick Robinson, StephanieBianco, Jennifer Maguire, Rashida M. Crutchfield, Kelly Condron & LorreneRitchieTo cite this article: Aydin Nazmi, Suzanna Martinez, Ajani Byrd, Derrick Robinson, StephanieBianco, Jennifer Maguire, Rashida M. Crutchfield, Kelly Condron & Lorrene Ritchie (2018): Asystematic review of food insecurity among US students in higher education, Journal of Hunger &Environmental Nutrition, DOI: 10.1080/19320248.2018.1484316To link to this article: https://doi.org/10.1080/19320248.2018.1484316View supplementary materialPublished online: 22 Jun 2018.Submit your article to this journalView related articlesView Crossmark dataFull Terms & Conditions of access and use can be found tion?journalCode when20
JOURNAL OF HUNGER & ENVIRONMENTAL 4316A systematic review of food insecurity among US studentsin higher educationAydin Nazmia, Suzanna Martinez b, Ajani Byrdc, Derrick Robinsond,Stephanie Biancoe, Jennifer Maguiref, Rashida M. Crutchfieldg, Kelly Condrona,and Lorrene RitchiehaFood Science and Nutrition Department, California Polytechnic State University, San Luis Obispo, USA;Nutrition Policy Insitute, University of California, Oakland, USA; cExtended Opportunity Programs &Services, Mission College, Santa Clara, USA; dDivision of Agriculture and Natural Resources, Universityof California, San Diego, USA; eCalifornia State University Chico, Department of Nutrition and FoodScience, Center for Healthy Communities, Chico, USA; fDepartment of Social Work, Humboldt StateUniversity, Arcata, USA; gSchool of Social Work, California State University Long Beach, Long Beach,USA; hNutrition Policy Institute, University of California, Berkeley, USAbABSTRACTKEYWORDSAccumulating evidence suggests that food insecurity in UScolleges and universities is higher than in US households,making this a new public health priority. We conducted asystematic review of food insecurity among US studentsattending higher education institutions. A total of eight studiesmet inclusion criteria, representing data from 52,085 students.Unweighted mean food insecurity prevalence among this sample was 41.4% (SD 12.2), significantly higher than the 13%reported for US national households in 2015. Higher educationinstitutions must critically examine the problem of food insecurity and take creative policy and programmatic steps tomitigate its consequences. Short-term emergency solutions,such as food pantries, may be useful, but upstream solutionsto address basic needs are imperative.Food insecurity; hunger;higher education; collegeIntroductionFood insecurity is defined as the inability to acquire sufficient or appropriatefood in a socially acceptable manner. The United States Department ofAgriculture (USDA) Economic Research Service (ERS) has been trackingfood security status among US households annually since 1995. From 1997to 2007, food insecurity fluctuated moderately between 10% and 12% andrapidly increased to 14–15% between 2008 and 2014 as a result of the GreatRecession.1 In 2015, the rate nearly returned to pre-recession levels; with12.7% of US households, or 42.2 million people, experiencing food insecurityat some point during that year. Although food insecurity declined, itCONTACT Aydin Nazminazmi@calpoly.eduFood Science and Nutrition Department, 1 Grand Avenue, SanLuis Obispo, CA 93401Color versions of one or more of the figures in the article can be found online at www.tandfonline.com/when.Supplemental data for this article can be accessed at the publisher’s website. 2018 Taylor & Francis Group, LLC
2A. NAZMI ET AL.continues to disproportionately affect low-income households below 185% ofthe poverty threshold (33–38%), households headed by a single woman(30%) or man (22%), Black (22%) and Hispanic (19%) households, andhouseholds with children (17%).2Food insecurity is associated with poor nutritional,3,4 and physical5–8and psychosocial9–11 well-being. Among children and adolescents who arein a period of learning and social development, cognitive and behavioraloutcomes have also been investigated. In a nationally representative sample, Alaimo et al. found that after adjusting for a range of socioeconomicindicators, compared to school-aged children from households with foodsecurity, those from households that were food insecure had significantlylower math scores and were more likely to have repeated a grade. Inaddition, both school-aged children and adolescents from households withfood insecurity had more externalizing behavior and conduct problems,such as not getting along with others and school suspension, than theirpeers from food secure households.12 In a prospective study of schoolaged children, Howard found significant impairments in self-control,interpersonal relations, and learning among children with food insecurityat home.13 Jyoti et al. reported longitudinal deficits in developmental andsocial skills in addition to reading performance, among children living inhouseholds experiencing food insecurity.14 Moreover, Winicki andJemison (2003) found that children from households with even marginalfood insecurity displayed diminished learning over the school year.15Whereas the food security literature representing adults and children is relatively well established,4,8,10,12,14,16–19 there is limited research on college students.More than 20 million US students, including 40% of all 18–24 year olds, areenrolled in higher education (National Center for Education Statistics) and emerging evidence suggests that this population is at elevated risk for food insecurity,despite the notion that this population is in a protected environment. Competingfinancial obligations, such as tuition and housing (which continue to rise), andeducational expenses (e.g., textbooks, computers), which have disproportionatelyaffected low- and middle-class families, have been implicated in the rise in hungerand homelessness among college students across the country,20,21 and possiblymore so after the Great Recession. It has been posited that students with unmetbasic needs, such as food and/or housing, have difficulty learning and are less likelyto achieve academic success.22 Cook et al. have suggested that the impact of foodinsecurity on health in young adults is underestimated because “marginal” foodsecurity may be more akin to “low” versus “high” food security.17 However, little isknown about the negative behavioral and academic impacts that food insecuritymay have on young adults.Food insecurity among college students was first documented as publichealth issue almost 10 years ago, but did not appear in the literature until2009 when Chapparo et al. published their 2006 data from the University
JOURNAL OF HUNGER & ENVIRONMENTAL NUTRITION3of Hawaii, Manoa.23 The media, however, did not start spotlighting theproblems of basic needs insecurity among college students until May 2010(Google News search October 11, 2016 with media key words “collegefood security”),24 which coincided with the economic turmoil of the GreatRecession. Post-recession recovery coinciding with rising costs of tuitionover the past decade and the increasing gap between financial aidpackages and actual costs of higher education are likely reasons basicneeds (food and housing) security has come to the forefront of the collegestudent experience.22,25Because studies on college food security have been published in a rangeof disciplines, including nutrition and dietetics, consumer studies, andhigher education, it is difficult to gain a clear impression of the extent ofthe food insecurity issue in higher education, which makes this systematicreview timely, as this information is necessary to inform policies and designeffective programs to ensure basic needs, which includes food security,among all students. Therefore, the objectives of this systematic reviewwere to: 1) document and describe the number of studies to date and themethodologies used to estimate food security and 2) synthesize availablefood security prevalence data from US higher education settings.MethodsInvestigators (AN and SM) searched peer-reviewed and publicly availabledata sources for food insecurity prevalence in higher education in the USGoogle, Google scholar, Web of Science, and PubMed using the followingkeywords: food security, food insecurity, hunger, university, students, andcollege. Inclusion criteria included analyses that collected primary data onfood security prevalence, utilized random or representative sampling strategies, and utilized any of the three standardized, validated USDA foodsecurity assessment tools. Data were required to be drawn from undergraduate or graduate students from 2- or 4-year US institutions of highereducation; dates were not specified. Experts in the field were also contacted for in-progress or recently completed studies. Study authors werecontacted to provide clarification on methods or results when necessary.In supplemental analyses, we expanded inclusion criteria to studies utilizing any sampling strategies and any food security assessment tools for studiesconducted in the US. Microsoft Excel was used to calculate unweighted andweighted mean (SD) food insecurity prevalence by taking into account studysample sizes and this approach was repeated for supplemental data.
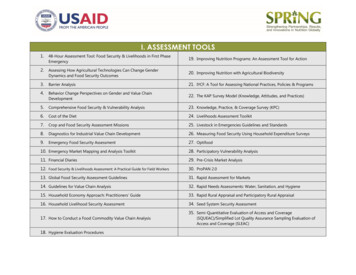
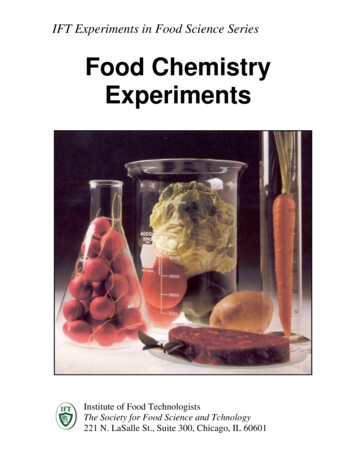
Goldrick- 10 community colleges in 7 statesRab(LA, PA, NY, CA, NJ, WI, WY), mostlysmall town, approx. 3-20k students/campus (Winter-Spring 2015)2015Census of UG/G 6-item ShortstudentsForm of theFood SecuritySurveyModule4,312, 9% Random6-item Shortsample, UG, at Form of the9 institutionsFood Securityand census at 1 SurveyinstitutionModuleCensus of UG at AFSSM4 universitiesAFSSM39% inpast12 months58.8% inpast12 months35% inpast9 months21% inpast12 monthsRandomlyselected UG/Gnon-freshmanclasses410,33%4 public universities in small-town1,882,rural settings; Northern, Eastern,3.87%Southern, and Western IL Universities,approx. 7-30k students/campus (AprMay 2013)6-ITEM SHORT FORM FOOD SECURITY MODULE2014Patton- Western Oregon University, small354, 7%Lopeztown rural, approx. 6k students (May2011)Morris2016Year1stpublished AuthorSetting (data collection period)10-ITEM USDA ADULT FOOD SECURITY MODULE (AFSSM)2009Chaparro University of Hawaii Manoa, flagshipcampus of UH system, urban publicresearch university, approx. 20kstudents (Oct-Nov 2006)FoodFood security insecurityDesign, ed )Food insecurity among White (35%), Black Report(54%), Latino (45%), Southeast Asian (37%);among food insecure students: 73%housing insecurity, 38% used food-relatedpublic assistance; 91% depressed, 84%severe anxiety, 34% suicidal ideationHigher prevalence among poor selfreported health, low GPA, employedstudents, low incomeSignificant differences in food insecurityamong Native HI/Pacific Islander (38%),Filipino (33%), White (24%), Mixed (24%),and Japanese (8%); those living on campus(38%), off campus with roommates (31%),off campus with parents (11%); Increasedodds of food insecurity among Hawaiian/Pacific Islander, Filipino, and students ofmixed race/ethnicityHigher prevalence among AfricanAmericans, those with lower GPA, thoseliving off campus independently, those onstudent aid, lower risk among those livingwith parentsOther key findingsTable 1. Description of the eight data sources meeting inclusion criteria examining prevalence of food insecurity at US higher education institutions, organizedby food security assessment method and year of publication. (Abbreviations: AFSSM: Adult Food Security Survey Module, UG: Undergraduate students, G:Graduate students).4A. NAZMI ET AL.
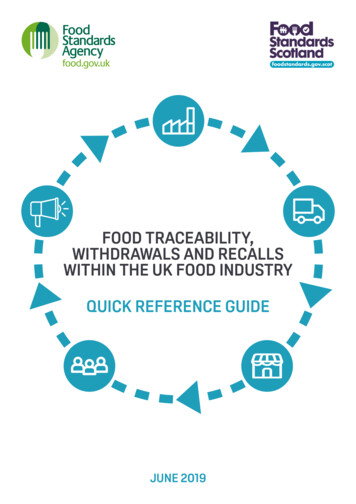
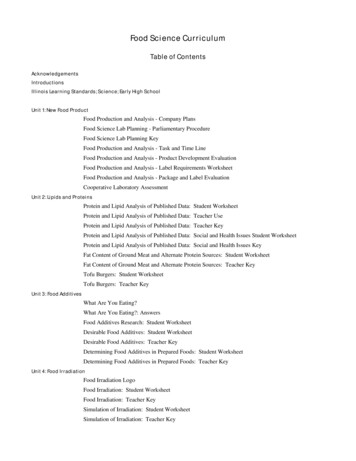
Goldrick- 70 community colleges in 24 states, 33,934,Rabdiverse settings, approx. 75k students 4.5%total (Fall 2016)20178,932,14%Martinez University of California system,diverse settings, approx. 5–45kstudents per campus (Spring 2015)2016California State University Humboldt, 1,554,small town rural, approx. 9k students 19%(Nov 2015)MaguireSetting (data collection period)California State University Chico,suburban setting, approx. 18kstudents (May-June 2016)42% inpast12 months57% new to food insecurity. HigherReportprevalence among African-American andLatino students, students with child historyof food insecurity, longer time as anundergraduate, receiving financial aid, andother living situation including homeless orliving temporarily with friendFood insecurity among Pell Grant recipients Report(65%), students who had been in fostercare (75%),US citizens/permanent residents (56% vs.non-citizen/resident 51%), student parents(63%)29% of food insecure students utilizedSNAPFoodinsecurityprevalencereportedOther key findingsSource43.1% in46.4% of students eligible for CalFreshMaster’spast28.6% of students identified as both food thesis12 months insecure and CalFresh eligibleUSDA guidelines for food insecurity statusdo not accurately reflect CalFresh eligibility53% in19% utilized CalFresh, 27% used campusReportpastpantry, freshmen least food insecure30 daysCensus of6-item Short 56% instudent body at Form of the pastall institutions Food Security 12 monthsSurveyModuleFood securityscreeningtool6-item ShortForm of theFood SecuritySurveyModuleCensus of UG/G 6-item ShortstudentsForm of theFood SecuritySurveyModuleRandom6-item Shortsample of UG/G Form of thestudents at 10 Food SecuritycampusesSurveyModuleSamplesize,response Design, sampleratedetails707, 13% Randomsample of allUG/G2016Year1stpublished Author2016BedoreTable 1. (Continued).JOURNAL OF HUNGER & ENVIRONMENTAL NUTRITION5
6A. NAZMI ET AL.ResultsA total of 28 studies were identified. Of these, eight studies met the inclusioncriteria (Table 1), representing data collected between 2006 and 2016 from 52,085students in 27 states at more than 100 US institutions. Three sources were frompeer-reviewed journals23,26,27, four were reports28-31, and one was a Master’sthesis.32 Of these eight studies, sample sizes ranged from 35427 to 33,93429 andfive of these studies included both undergraduate and graduate students.23,27,30–32Two studies presented data solely from community colleges.28,29 Response ratesranged from 4% at Illinois public universities26 to 33% at University of Hawaii,23with an average of 8.3%.SamplingFour studies collected data from a single campus, representing studies fromHawaii, Oregon, and California (two separate studies).23,27,30,32 The other fourstudies collected data from two or more campuses; one study in Illinois collectedat four campuses, another collected data at the 10 campuses of the University ofCalifornia system, and two studies focused on community college campuses(10 and 70, respectively) in several states (seven and 24, respectively).26,28,29,31Studies differed on sampling techniques. Four studies employed randomsampling23,28,31,32 and four26,27,29,30 employed census sampling. Most studiesused individual students as sampling units,26–32 but one used classes asaggregate-level (classroom clusters) sampling units23 that involved invitingall students in those classes to take part in data collection.Three studies26,28,29 examined food insecurity among undergraduates only(including community college students), whereas five studies23,27,30–32 includeddata on graduate students as well. Studies examining solely undergraduate samplesranged from N 1,882–33,394. The graduate student samples were relatively small,with the proportion of graduate students ranging from 8–37% (n 58–147,respect
A systematic review of food insecurity among US students in higher education Aydin Nazmia, Suzanna Martinez b, Ajani Byrdc, Derrick Robinsond, Stephanie Biancoe, Jennifer Maguiref, Rashida M. Crutchfieldg, Kelly Condrona, and Lorrene Ritchieh aFood Science and Nutrition Department, California Polytechnic State University, San Luis Obispo, USA; bNutrition Policy Insitute, University of .