Transcription
Derivation and Testing of theWater Poverty Index Phase 1.Final Report May 2002Volume 1- OverviewDr C. A Sullivan, Dr J.R Meigh & Mr T.S Fediw
Derivation and Testing of the Water PovertyIndex Phase 1.Final Report May 2002Contract Number:C24Project Manager:Dr Caroline SullivanCEH WallingfordMaclean Building,Wallingford,Oxon.OX10 8BBTel: 01491 692457Email: csu@ceh.ac.ukThis report is an official document prepared under contract between theDepartment for International Development and the Natural EnvironmentResearch Council. It should not be quoted without the permission ofboth the Centre for Ecology and Hydrology (CEH), Wallingford and theDepartment for International Development, London.
ContentsSummary11.Introduction22.Theoretical Background23.4.2.1:The Sustainable Livelihoods Framework52.2:Indicators as Policy Tools62.3:Political & Institutional Issues72.4:Hydrological Aspects of the WPI92.5:Addressing the Needs of the Environment112.6:Participation and Empowerment of Local Communities122.7:Climate Change and Population Impacts on Future Water Resources13Conceptual Development of the WPI3.1: Identification of Key Concepts to be Included in a Holistic WPI Measure153.2: Overview and Scales of Application153.3: Development of the test-bed dataset from Three Countries16Practical Application of the WPI Methodologies4.1: Composite Index Approach5.6.1417174.1.1:Local Scale Application184.1.2:Applying Weights to the WPI Structure204.1.3:The Impacts of Using a Different Mathematical Structure for the Processof addition of sub-components214.1.4:Cost Effective Water Data Collection224.1.5:National Scale Application244.1.6:Expressing Composite WPI Values for Use by Policy Makers254.2:Time Analysis Approach264.3:A “Gap” Approach264.4:Other Approaches27Evaluation & Discussion of the Methods Tested285.1:Evaluation of Methods Tested285.2:Evaluation of Methods by Key Stakeholders in Pilot Countries335.3:Evaluation of Project Achievements335.4:Evaluation of Capacity Building36Scope for Implementation of the WPI376.1:Implementation in Pilot Countries376.2:Implementation in Untested Countries387.Conclusion & Recommendations398.Bibliography41
AppendicesAppendix 1:1.1:1.2:1.3:1.4:1.5:Data AnalysisData used for WPI CalculationsCalculation of the Composite Index ApproachThe Time Analysis ApproachThe Gap ApproachThe Water Poverty Index, A National ApproachAppendix 2:2.1:Developing the Test-bed Dataset for the Pilot SitesPilot Country & Site Characteristics2.1.1: South Africa2.1.2: Tanzania2.1.3: Sri LankaIllustration of Key Variables in the Pilot Sites2.2.1: South Africa2.2.2: Tanzania2.2.3: Sri LankaWealth Distributions in the Pilot SitesHousehold Surveys2.4.1: Household Survey Methodology Report2.4.2: Example of Household Survey Questionnaire (Tanzania)2.4.3: Examining the Potential for Using a Shortened Survey Instrument2.4.4: Possible Short Form Questionnaire2.4.5: Comparing the Composite Index Approach with a WPI Constructed from aShortened Survey InstrumentLocal Background Reference Material Collected from the Study Sites2.5.1: South Africa2.5.2: Tanzania2.5.3: Sri Lanka2.2:2.3:2.4:2.5:Appendix 3:Assessing Water Resources at Pilot Sites (Jeremy Meigh & Jude Cobbing)Appendix 4:Integration of Socio-Economic and Environmental Data within GIS for theWater Poverty IndexAppendix 5:5.1:The WPI Consultation ProcessThe Arusha conceptualisation workshop, May 2001 in Tanzania.5.1.1. Conceptualisation Meeting Participants5.1.2: Conceptualisation Meeting Agenda5.1.3: Summary of WPI conceptualisation meeting, Arusha, May 20015.2 Second conceptualisation meeting, Wallingford, December 10, 20015.2.1: List of Participants5.2.2: Agenda5.2.3: Notes on Short Presentations5.3:Dissemination/Consultation Meetings with Policy Makers & Stakeholders5.3.1: South Africa5.3.2: Tanzania5.3.3: Sri Lanka5.4:Dissemination/ Consultation Workshops in Pilot Countries5.4.1: South Africa5.4.2: Tanzania5.4.3: Sri Lanka5.4.4: Certificate of AppreciationAppendix 6:Dissemination of the WPI Concept6.1:WPI Management Primer6.2:WPI Workbook and Workshop Materials6.3:WPI Poster6.4:Calculating the Water Poverty Index for Tanzania Presentation by Stephen Mlote(AWEC Conference, Jan. 2002)
6.5:6.6:6.7:Journal PapersWWDR ContributionFuture Dissemination of the WPIAppendix 7:7.1:7.2:Feedback from WPI Consultation ProcessSummaryFeedback Documentation7.2.1: WPI Management Primer, Comments7.2.2: Comments on WPI Workshops7.2.3: AWEC post meeting report, Steven Mlote7.2.4: Letters of supportAppendix 8:8.1:8.2:WPI Contract DeliverablesDeliverable TableEvaluation of DeliverablesAppendix 9:9.1:Background PapersAcreman , M & King ,J (2002): Defining the Ecosystem Component of a WaterPoverty IndexAllan ,J.A (2002): Which Water are we Indexing and Which Poverty?Allan ,J.A (2002) Resource & Socio-Economic Contexts- Contribution to TrainingMaterialClark .M (2002): A Water Deficiency Index for Primary Water UseFediw , T (2002): Poverty & Indicators- Literature Review9.5.1: Definitions of Poverty9.5.2: Indicators & Techniques of Creating ThemGiacomello, A and Sullivan, C.A (2002):9.6.1: Taking the WPI Further9.6.2: Calculation of the Composite Index Approach at the Micro LevelGleick, P.H (2002): Water & Conflict, Background Notes for the WPI AssessmentHunt ,C & Cairncross , S (2002): Water, Poverty & HealthJackson, C.R & Sullivan, C.A (2002): Object Orientated Approaches Applied tothe Water SectorLawrence, P, Meigh, J and Sullivan, C.A (2002): The Water Poverty Index; ANational ApproachMalomo, S & Mapuranga, S (2002): Derivation & Testing of a Water PovertyIndex- Contribution of the Commonwealth Science CouncilSection 1: Water Poverty Index ModelsSection 2: The Jarman IndexSection 3: Gender & Water PovertyMorton, J (2002): Agricultural Production & LivestockPrudhomme ,C and Meigh, J (2002): Assessing the Water Poverty Index in aContext of Climatic ChangesSchulze, R.E and Dlamini ,D.J.M (2002) Meso-Scale Indicators of Water Povertyin the Thukela Catchment South Africa, Under Baseline Land Cover ConditionsSimon, S (2002): Towards the sustainable management of water. The contribution ofresearch in Green Accounting to the construction of a Water poverty Index.Sullivan, C.A (2002): Poverty & Development, Laying the Foundations for theCapture of Natural CapitalVan Koppen, B (2002): Gender.& Water Index DevelopmentWalker, I, Giacomello ,A.M, Sullivan, C.A (2002): Water & PovertyAn Econometric 9.12:9.13:9.14:9.15:9.16:9.17:9.18:Appendix 10:ReferencesAppendix 11:11.1:11.2:11.3:Further DocumentationEvaluating Your Water; A Management Primer for the Water Poverty IndexWater Poverty Index Implementation; An IntroductionDeveloping a Water Poverty Index, Poster
Project TeamThis project has been managed by the Centre for Ecology and Hydrology (CEH),Wallingford, UK, on behalf of the UK Department for International Development,under contract number IUDDC24. The views here do not necessarily represent thoseof DFID. The project participants are:Core GroupDr Caroline SullivanDr Jeremy MeighDr Mike AcremanMs Anna-Maria GiacomelloMr Tim FediwMs. Emma TateDr Christel PrudhommeMr Dermot O’ReganCEH Wallingford (Project Manager)CEH WallingfordCEH WallingfordCEH WallingfordCEH WallingfordCEH WallingfordCEH WallingfordCEH WallingfordMr Roger CalowMr Jude CobbingMr Jeff DaviesBritish Geological SurveyBritish Geological SurveyBritish Geological SurveyProfessor Mike ClarkDr Craig HuttonMs IlseSteylGeoData Institute, SouthamptonGeoData Institute, SouthamptonGeoData Institute, SouthamptonDr Tony AllanSchool of Oriental and African StudiesUniversity of LondonHR Wallingford LtdLondon School of Hygiene and Tropical Medicine, UKSouthern Waters Ecological Research and ConsultancyKeele University, Department of EconomicsCommonwealth Science CouncilCommission for Science and Technology(Costech)TanzaniaInternational Water Management Institute, Sri LankaSchool of Bioresources, Engineering & EnvironmentalHydrology, University of Natal, South AfricaInternational Water Management Institute, Sri LankaMr Alan HallDr Caroline HuntDr Jackie KingDr Peter LawrenceDr Siyan MalomoMr Steven MloteDr Madar SamadProfessor Roland SchulzeDr Barbara van KoppenExternal Advisory CommitteeDr Sandy CairncrossLondon School of Hygiene and Tropical Medicine, UKDr Bill CosgroveEcoconsult, CanadaDr Peter GleickPacific Institute, USADr Athar HussainAsia Research Centre, London School of EconomicsMs Sue MilnerIndependent Consultant, UKDr Jerome PriscoliInstitute for Water Resources,US Army Corps of EngineersMr Ian SmoutLoughborough University
AcknowledgementsIn addition to the above, contributions have been made by many others, particulary,3Prof. Yadon Kohi1, Prof. Ndalahwa F. Madulu 2, Mr A. Aconaay , Mr Mohd. B4Loisenget , Mr Joshua Mgeyekwa 5, Mr Asil A. Munisi, 6. Special thanks are due toDr John Gash8 for his stimulating suggestions in the early stages of development andto Mr. Ian Curtis of DFID for his encouragement and support. Contributions from Dr9Sandrine Simon7, Dr. Matthew McCartney8,.Mr. John Griffin8 and Prof. Ian Walkerare also much appreciated. Thanks also must be given to many others in the studycountries who have supported the work, and in particular this would include Mr10Dennis Dlamini1 , Mr Mark Horan10, Mr K.K. Premanath11, Mr D.S Seneviratne11,Mr Upali Dahanayaka12, Dr. Barbara Schreiner13, Dr. George Green14, Dr. SizweMkhize14, and Dr. Steven Mitchell14, who have all made important contributions tothe process of developing and testing the Water Poverty Index.In addition to those listed above, appreciation must be given to the hundreds ofresidents in Sri Lanka, South Africa and Tanzania who participated in the 1521household surveys conducted in conjunction with the development of the WaterPoverty Index. Thanks must also go to the numerous institutions that took part in theworkshops and the consultation process, a list of which can be found in Appendix 5.2,and to those many people who took part in the original scoping study carried out in2000, which laid the foundation for this work.1.2.3.4.5.6.7.8.9.10.11.12.13.14.Director General, Commission of Science and Technology, TanzaniaUniversity of Dar es Salaam, TanzaniaRegional Water Engineer, Arusha, TanzaniaArumeru District Water Engineer, Arusha, TanzaniaArusha Urban Water Supply & Sewerage Authority, TanzaniaArusha Urban Water Supply & Sewerage Authority/ Pangani Basin Authority, TanzaniaOpen University, Milton Keynes, UKCentre for Ecology and Hydrology, Wallingford, UKDept. of Economics, University of Warwick, UKSchool of Bioengineering and Natural Resources, University of Natal, South AfricaNational Water Supply & Drainage Board, Sri LankaDirector (Economic Infrastructure), National Planning Dept, Sri LankaDept of Water Affairs and Forestry, South AfricaWater Research Commission, South Africa.
Phase 1 Final ReportSummaryThe project ‘The Development and Testing of a Water Poverty Index’ has beendesigned to identify and evaluate a tool for assessing poverty in relation to waterresource availability. The Water Poverty Index is an interdisciplinary managementtool, which integrates outputs from both the physical and social sciences, within astructured framework. It takes existing monitoring programmes further by explicitlylinking socio-economic indicators of poverty drivers with water resource assessments,enabling the identification of those communities where poverty may be closely tied towater stress. As a result, the links between poverty, social deprivation, health,environmental integrity and water availability become more explicit, enabling policymakers to identify appropriate mechanisms to deal with the causes of these problems.A number of different approaches have been considered, with a view to producing anevaluation tool relating water resources to the demands placed upon them. By linkingthis work to that which gave rise to the development of the Human DevelopmentIndex, it is anticipated that the WPI will sit neatly within the suite of policy toolsavailable for both water management and poverty alleviation.In the long run, the development and implementation of the WPI will promote:1. community empowerment, through provision of better informationon local water availability and demand,2. potential for self-calculation of water stress by communities,3. integrated datasets and a transparent methodology on which waterdevelopment projects can be prioritised,4. a comprehensive capacity building programme to enablecalculation of the WPI by individual communities andcountries,5. more explicit identification of the natural capital entitlements ofcommunities, and6. linkages between cross-sectoral themes such as education,sustainability, ecological water demand, etc.During this phase of the project, a number of approaches to calculating the WaterPoverty Index have been developed. Following a wide process of consultation, it wasconcluded that a composite index approach is preferred. Using data generated throughhousehold surveys and from other sources, a testbed dataset has been created fortwelve sites in three pilot countries1, and this has served as a means by which we havebeen able to test and compare the methods at the local level. For application at thenational level, we have used data from publicly available datasets, and from this, wehave been able to generate WPI scores for 141 countries.In order to facilitate a wide level of participation in the design of the WPI tool, wehave consulted with a range of water professionals at all levels. We have also tried toensure that this approach promotes some sense of ‘ownership’ of the tool in theparticipating countries.1Tanzania, Sri Lanka and South Africa1 CEH Wallingford 2002
Phase 1 Final ReportOn completion of the testing of the methods and the generation of the WPI scores, wehave presented the information to representatives of the relevant authorities, throughworkshops held in each of the three pilot countries. We have also produced and testedtraining materials designed for the purpose of putting in place the appropriate capacitybuilding that may be needed if the WPI were to be implemented. Samples of thesematerials are provided with this report.The results of this phase of the WPI development process are encouraging. We havefound that the WPI scores generated at the study sites were in keeping with what isknown about those sites by local water managers. In each case, local water officialsagreed that the generated values accurately reflected real differences between thevarious sites. In all locations, local and national water professionals stated that theWPI would be of use in improving management decisions, and in each country,government departments have clearly stated that they would like to see work on theWPI taken further in their countries.The work done to calculate national level WPI scores has also been productive, andthe WPI framework provides a means by which standardised assessments can bemade in different countries. While such coarse evaluations at a country level cansometimes be of little use at the local level, they are of use to national policy makers,and to national and international donor organisations. Material on the WPI is to beincluded in the forthcoming United Nations World Water Development Report, andthis is testimony to the fact that the tool is of interest to those seeking to promotemore informed and equitable water management practices.Representatives of countries not included in the pilot testing process have alsoexpressed interest in using the WPI tool to improve water management. In addition,various research groups working on climate change and water security have expressedinterest in using the WPI in their work. Amongst those consulted, there was a widelyheld view that the achievement of the type of integrated monitoring incorporated inthe WPI will improve decisions in the water sector. There still remains, nevertheless,more work to do. It is certain that improvements can be made in the methodology, andthe data on which it is based, but we do believe that many of these improvements willbe achieved in the second phase of the project, when refinements in both methods anddata can be made. In the longer term, such refinements will mean that the use of theWPI will enable us to explicitly take account of inequities in both the costs andbenefits of water use, and of the need to maintain ecosystem integrity as a way ofsecuring future livelihood opportunities.1. IntroductionThis report attempts to summarise the very comprehensive work which has beencarried out to develop and test the Water Poverty Index. This has involved a largeteam from some 20 local, national and international institutions working together overa 12 month period. The findings reflect the work of this team, and the ideas representa consensus of opinion on what the Water Poverty Index is, and what it can do. Themethodologies developed aim to be relatively simple to calculate and easy to use andexplain. The vast majority of the many stakeholders consulted during thisdevelopment process have been very enthusiastic about the work, and its relevance totheir water management problems. The format of this report is as follows:2 CEH Wallingford 2002
Phase 1 Final Report1. The WPI Phase 1 Final Report - Volume 1, Overview.2. The WPI Phase 1 Final Report - Technical Appendices.3. The WPI Phase 1 Final Report - Documentation.4. The WPI Phase 2 Outline proposal documentIn this Volume 1, Overview, an outline of the work and what has been achieved isdescribed. Preliminary WPI values for the study sites are provided, as well as nationallevel application of the WPI to 140 countries worldwide. Detailed technicalinformation is attached in the appendices, and the reader is directed towards thesewhere necessary. Suggestions are provided of how achievements reached so far canbe extended, and what steps can be taken to promote the uptake of the tool.Dissemination conducted widely so far has been successful, and a future workshop topromote information about the WPI methodology will be carried out on June 26th2002, at the Commonwealth Secretariat, London. The audience for this workshop willrepresent a wide range of countries where the need to address both poverty and waterissues is most pressing. Dissemination of the WPI concept will continue in the future,with presentations of the work planned to take place at the UNESCO/InternationalHydrological Programme’s HELP conference in August, 2002, and the ClimateChange Workshop being held in Colorado, also in August 2002.While a significant start has been made on the work to develop and test the WPI, thereis little doubt that there is much left to do. What we have achieved here is ademonstration of the possibility of applying a holistic decision-making framework towater management options. This reveals a richer reflection of the factors whichinfluence the water sector than has been available before, but it must be regarded as afirst step in the long process needed to influence the lifestyle choices and behaviour ofindividual people and institutions.This report begins with an explanation of the theoretical background on which thework is based, followed by an outline of the methodologies that have been developed.An explanation of how and why data has been collected is provided, followed byvarious types of data analysis, testing the methodologies, both at a micro (community)and macro (national) scale. An account is provided of the consultation process whichhas been embodied throughout the life of the WPI project, and examples of materialsused for capacity building for the WPI are included as hard copies. The projectactivities and outputs are evaluated, and recommendations for further developmentare made. A comprehensive Appendix to the report is provided, and must be taken asbeing an essential part of this Final Technical Report.The progress achieved during the first phase of the Development and Testing of theWater Poverty Index has been good, since not only have methodologies now beendeveloped, but they also have been tested in real field-conditions, and with realcountry-level data. A comprehensive range of water professionals from bothmunicipal and national level offices have participated in WPI workshops in each ofthe pilot countries, and in each case government organisations have confirmed inwriting that they would be keen to see the WPI developed further in their countries.There still remains much work to be done to refine the tool and its application, but ithas already generated such interest that it seems likely that it has great potential forwide uptake. As an annex to this report, an outline proposal is provided to give someidea of what direction future work may take.3 CEH Wallingford 2002
Phase 1 Final Report2. WPI theoretical backgroundThe purpose of the project to develop and test a Water Poverty Index (WPI) is ‘todevelop an evaluation tool for assessing poverty in relation to water resourceavailability’. In keeping with this objective, the project needs to be embedded in anappropriate theoretical framework. With respect to a theoretical understanding ofpoverty, the approach put forward by Townsend (1979) Sen (1981, 1983, 1995) andextended by Desai (1995) is adopted, and as such, poverty is defined as capabilitydeprivation. Building on the basic needs approach first outlined by Pigou (1920), Senhas shown that poverty is the result of a lack of at least one of the basic skills andconditions that characterise a society, and as such, is a relative concept. Theoccurrence of poverty therefore not only depends on the conditions of life on which aperson depends, but on the existence of a combination of circumstances or‘functioning’ which gives rise to capabilities on which an individual can build. (Seealso Appendix 9.5.1 and 9.16).These ideas have more recently been developed and Desai (1995) has attempted toshow that such capability deprivation can be more clearly defined, and to some extent,can be quantified. As Desai puts it, ‘as far as the measurement of poverty isconcerned, we are interested in guaranteeing that people have certain capabilities i.e.they have the resources required to function in any of the several alternative wayspossible’(Desai, 1995 P198). To some extent at least, this reduces the need toconsider socio-cultural factors which may influence what activities people actuallyengage in, and leaves us free to consider what are the factors which enable people tohave an equitable access to viable livelihood choices.To maintain effective livelihood choices, five basic capabilities have been identifiedby Desai (1995, P193): Capability to stay alive/enjoy prolonged lifeCapability to ensure biological reproductionCapability for healthy livingCapability for social interactionCapability to have knowledge and freedom of expression and thought.Having access to adequate water supplies for domestic and productive use can clearlybe linked to most of these capabilities. Not only are the first 3 addressed directlythrough better water management, but also the last 2 are incorporated within anyparticipatory management structure that provides empowerment for communities tounderstand their own resource management problems. The conceptual structure of theWPI itself tries to incorporate some dimension of each of these livelihood capabilities,providing a holistic perspective on how poverty may be alleviated through moreefficient and equitable water management.When considering the economic development process, and how a tool such as theWater Poverty Index can contribute to this, we need to consider how developmentitself should be evaluated. It is no longer acceptable to think in terms of changes inper capita values of GDP, as it is now recognised that the development processimpacts in various ways upon a place and a society, and attempts to assess all of theseimpacts must be made. In the conceptualisation process through which the WPI hasbeen derived, attempts have been made to capture these dimensions through4 CEH Wallingford 2002
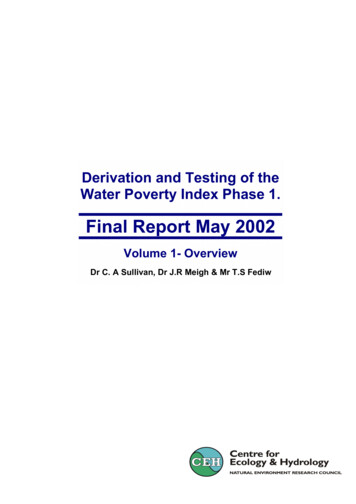
Phase 1 Final Reportincorporation of the concepts of capital types as outlined in the sustainable livelihoodsframework (Scoones, 1998 Carney, 1998).2.1: The Sustainable Livelihoods FrameworkThis approach provides a framework for analysis in which livelihoods provide thecentral core. The generation of livelihoods, and thus the alleviation of poverty, areanalysed in terms of capital entitlements. These capital entitlements have beenidentified as: Natural capitalPhysical capitalFinancial capitalHuman capitalSocial capital.In one sense, these capital entitlements can be equated to the factors of production,and these equally have to be combined to generate livelihood support. Fordevelopment to take place that provides opportunities for continued welfare growth,these capital types must be utilised without bringing about their irreversible depletion.Different combinations can produce similar outcomes, and a certain amount of capitalsubstitution is possible, but to ensure a sustainable future, the constraints ofearthsystem capacity must be respected.Impoverished communities are by definition short of some or all of the livelihoodcapital types. Their local environmental, human and social capital have not beenmobilised to create adequate physical (manufactured) and financial capital. Asdevelopment occurs over time, there will be inevitable changes in the extent andavailability of these livelihood capitals, and such changes can be illustrated as shownin Figure 1. To address any kind of poverty, access to these capital types must beredistributed to ensure that a more equitable outcome for all.Figure 1 How livelihood capital entitlements can changeThe impact of development,and its influence on livelihood capitalsAs development occurs, capital availabilities changeACCESS:Social capital,Financial capitalProportion ofeach capital type20USE:Physical Capital,Financial capital15CAPACITY:Human Capital105RESOURCE:NaturalCapital, Water resources012Time periodENVIRONMENT: NaturalcapitalFigure 1 shows how the development process (shown as a shift from time period 1 to2), can result in changes in the availability of different capital types. Developing toolsto quantify these capitals will facilitate a better understanding, not only of the extentof developmental impacts, but also their distribution. Since the WPI has been5 CEH Wallingford 2002
Phase 1 Final Reportdesigned to incorporate these concepts, it will be able to contribute to this improvedunderstanding.By taking this more holistic approach to the evaluation of development progress, weare better able to appreciate the wider dimensions of developmental impacts, and as aresult, promote a more equitable distribution of both its benefits, and its costs. In thisway, it becomes much more likely that all sectors of society, including the poor, willbenefit from the development process (Sen, 1999). In the past, this has not alwaysbeen the case, and there are many examples where development has favoured the richand powerful groups in society, at the expense of the poor. It is hoped that thedevelopment of the WPI will contribute to this process by providing more equitableoutcomes from water sector developments.2.2: Indicators as policy toolsIndicators provide the means of measuring some aspect of performance orachievement. They have become important policy tools, providing guidance on issueswhich are difficult to represent or assess in other ways. The have also becomeimportant politically, by providing the opportunity for people to evaluate theeffectiveness of resource allocation decisions. While there is some debate on their rolein influencing government policy, indicators do offer a relative measure ofachievement which can serve to direct policy towards the improvement ofperformance.An indicator is usually constructed by combining information from a range ofavailable data, with the resulting measure facilitating a comparison of performancerelative to previous time periods, or to the performance of others. Some of the betterknown indices which are regularly used for government policy include the consumerprice index and the index of industrial output, both of which measure some economicchange over time. The Human Development Index and the Human Poverty Index arealso composite indices which evaluate the performance of countries relative to eachother, and over time.Indices by their nature are not without problems. As time passes, the relativeimportance of various components can change, external factors can come into forceand political priorities may change, but nevertheless, the use of indices as policy toolshas become widespread. An example of this is provided by the Human DevelopmentIndex, which has been created in response to dissatisfaction which has arisen with theuse of per capita measures of Gross Domestic Product (GDP) as a measure ofdevelopment, since this captures nothing about the quality of that development, or thedistribution of its impacts. The HDI gives a measure of social and economic progresswhich is built from an average of three separate indicators: life expectancy at birth,educational attainment and GDP per capita at purchasing power parity (PPP) values.The individual indices which make up the HDI are also published, so that it ispossible to see what is driving any changes which are taking place. Publishing thecomponent parts of such an index can show where progress needs to be prioritised.There is little doubt that the creation of the HDI has led to a re-evaluation of thedevelopment process, and to a change in the way donor organisations operate.Nevertheless, the HDI has been criticised because it lumps together in one index quitedifferent elements with no common measure. A second criticism of the HDI is thatmost of its components are highly correlated with each other
Email: csu@ceh.ac.uk This report is an official document prepared under contract between the Department for International Development and the Natural Environment Research Council. It should not be quoted without the permission of both the Centre for Ecology and Hydrology (CEH), Wallingford and the Department for International Development, London.