Transcription
2018DEFINING ACCESS:How Test-Optional WorksCo-Authors: Steven T. Syverson, Valerie W. Franks, William C. HissTo be hosted electronically by the National Association for College Admission Counseling
THIS REPORT IS EMBARGOED UNTIL RELEASED BY THEAUTHORSAUTHORS’ NOTEThis is a continuation into the investigation on test-optional policies, started by conducting individual case studies on28 public and private colleges and universities in the United States. In every instance that we have presented anobservation or comparison that sheds light on the use of test-optional admission policies, we have included everyinstitution that provided reliable data for the particular comparison.But unlike a study which captures a single database and conducts a series of analyses on that data, we have collecteddata from institutions that became test-optional more than a decade and a half ago, and others that adopted testoptional policies within the last few years. As a result, only a minority of our analyses draw on the full 28 institutions.We have tried to provide as wide a framework of findings as possible, while identifying for each analysis the number ofinstitutions and student records that were included.Please look for the explanation in the figure description of each chart on how that subset of institutions was selected.Though we’ve provided connecting narrative, this report can best be considered an anthology of short reports designedto provide insights into the use of test-optional college admissions policies in the nation in the past decade.Though the participating institutions may choose to remain anonymous, we wish to publicly thank the deans ofadmission and particularly the Institutional Research staff at each of these colleges for their extraordinarycommitments in helping us to assemble and interpret this massive amount of data in an effort to better understandhow test-optional policies are working at their institutions.DEFINING ACCESS: HOW TEST-OPTIONAL WORKS SPRING 20181
EXECUTIVE SUMMARY . 3OBSERVATIONS ON THE TEST-OPTIONAL MOVEMENT . 5STUDY DESIGNWhat are the principal research questions? . 8What types of institutions and policies are represented in the study? . 9What data was collected and how was it used? . 12What is the sample size and composition? . 14How was data analyzed and summarized? . 14What are limitations of this research? . 15PRINCIPAL FINDINGSDOES A TEST-OPTIONAL POLICY Encourage more students to apply? . 18Enroll more traditionally URM and low-SES students? . 20Negatively impact the patterns seen in admissions, from selectivity to enrollment rates? . 24“NON-SUBMITTER” PROFILEDo Non-Submitters and Submitters exhibit different admission funnel patterns? . 28Who are Non-Submitters of testing? . 32How is “Expanded Diversity” represented among Non-Submitters?. 38ACADEMIC OUTCOMESDoes adopting a Test-Optional Policy lower the academic quality of the enrolled student body? . 41How do Non-Submitters and Submitters compare academically at each stage of the funnel? . 42How do the academic outcomes compare with those of “Defining Promise”? . 44Under TOP, how well does the High School GPA correlate with college success? . 46THE FINANCIAL SIDE OF THE POLICYDo TOPs place greater financial aid demands on the institution? . 51Do institutions aid Non-Submitters differently than Submitters? . 54Are needy Non-Submitters treated differently than Submitters in gift allocation? . 57Are no-need Non-Submitters treated differently than Submitters in gift allocation? . 58How does aid allocation relate to graduation rates? . 60How does aid allocation relate to any gains in diversity? . 62SUMMARY AND IMPLICATIONSWhat can we summarize about the workings of a Test-Optional Policy?. 66What did TOP deans say about their experience with the policy? . 68What are the authors’ ideas for future research? . 69APPENDIXCO-AUTHORS AND ADVISORS . 70DATA FIELDS DEFINED . 73REFERENCES . 85DEFINING ACCESS: HOW TEST-OPTIONAL WORKS SPRING 20182
“This Commission wishes to emphasize at the outset that a “one-size-fits-all”approach for the use of standardized tests in undergraduate admission does notreflect the realities facing our nation’s many and varied colleges and universities.These institutions differ greatly in size, selectivity and mission. At some, standardizedtests are important predictors of students’ academic success, while at others, theyadd little compared to high school grades.”NACAC Commission on the Use of Standardized Tests inUndergraduate Admission, 2008EXECUTIVE SUMMARYThe number of colleges using Test Optional Policies (TOPs) in higher education admissions has dramatically expandedin recent years. And these colleges have avoided “one-size-fits-all,” finding varied ways to administer TOPs andexperiencing varied outcomes. Much of the momentum around Test-Optional admission is focused on whether theuse of standardized tests (specifically SAT and ACT) unnecessarily truncates the admission of otherwise well-qualifiedstudents. In particular, there is concern about whether widespread reliance on the use of these tests in the admissionprocess tends to replicate the status quo in social class and opportunity in our American society.In this study, we collected student-record level data from 28 institutions that illustrate the variety among institutionsthat have adopted a TOP. They ranged in undergraduate enrollments from 1,500 to 20,000 and 15%-90% in admissionselectivity, and included long-time users of TOP as well as recent adopters of the policy. In most instances we receivedfour cohorts of student data, in total representing a dataset of 955,774 individual applicant records. We focused oninterpreting the data using practical significance rather than experimental statistical techniques.A TOP was described by many of the admission deans of the participating institutions as a tool they employed in thehope of increasing applications from a more diverse range of students, so this report focuses great attention ontraditionally under-represented populations in American higher education. To do so, we used our record-level data toidentify the intersectionality of these underserved populations: First-Generation College Bound, students from lowerSES backgrounds (Pell recipients as proxy), and students from racial and ethnic groups that have traditionally beenunderrepresented in college populations (URM). We identified students associated with any of these three groups anddesignated them as a single category of “Expanded Diversity,” and when possible, used it in our explorations.The experiences of institutions in this study provide evidence that the adoption of a well-executed test-optionaladmission policy can lead to an increase in overall applications as well as an increase in the representation of URMstudents (both numeric and proportionate) in the applicant pool and the freshman class. Roughly two-thirds of ourTOP institutions experienced URM growth above that of a matched test-requiring peer institution. A similar but smallermagnitude increase was seen among Pell recipients.Approximately one quarter of the students in this study did not submit standardized test scores with their collegeapplication (henceforth to be referred to as “Non-Submitters”). As noted in earlier studies, URM, First-Generation-to-DEFINING ACCESS: HOW TEST-OPTIONAL WORKS SPRING 20183
College, and Pell recipients were more strongly represented among Non-Submitters. For instance, 35% of Black orAfrican-American students chose to be Non-Submitters (12 percentage points higher than the overall non-submittingrate), as compared to 18% of white students. Similarly, women chose to be Non-Submitters at higher rates than men.We also found that Non-Submitters were often admitted at lower rates than Submitters, but, on average, enrolled(yielded) at substantially higher rates. Their HSGPAs were modestly lower than the Submitters, and, upon enteringcollege, their First Year GPAs and Cumulative GPAs were comparably lower. However, they ultimately graduated atrates equivalent to, or marginally higher than, Submitters, the ultimate proof of success.Furthermore, our data indicated that high school GPA had a stronger correlation with college success for NonSubmitters than the ACT/SAT (for the 27% of Non-Submitters for whom we had test scores) -- both in terms ofcollege cumulative GPA and graduation rate. While test scores had a generally stronger relationship with collegeGPAs for the Submitters, for the Non-Submitters they tended to show a weaker relationship, essentially underpredicting the college GPA. The test scores continued to most strongly correlate with family income.A financial analysis, though inconclusive, suggested that some degree of financial investment was required to supportthe success of a TOP policy. While the proportion of students with need did not necessarily increase after policyadoption, average demonstrated need and gift aid per capita did. Non-Submitters were generally needier thanSubmitters. They also, however, included a sizable proportion of No-Need students, only modestly lower than that ofSubmitters. We noted that well over half of all No-Need students were offered some gift aid, but No-Need NonSubmitters were less likely than Submitters to receive gift awards, in spite of the fact that these two groups wereshown to graduate at comparable rates.We cannot lay claim to definitive conclusions about the workings of a test-optional admission policy. However, ourfindings suggest that a TOP works well for many types of institutions. It appears to offer a less obstructed path tohigher education for this population of students who feel that their scores do not match their ability. We do not arguethat institutions should entirely eliminate consideration of the ACT and SAT for all their students, however, we docontinue to question whether the value-add of testing is large enough to justify the price—time spent, financial cost,and emotional drain—being paid by students due to societal preoccupation with these tests.We find that there is plenty of room in American higher education for diversity of process, allowing test-optionaladmission to contribute to that diversity. Some have asked, ‘Why ignore a piece of information if it is available?” Andwe agree. Indeed, when a student chooses to be a Non-Submitter, that, too, is a valuable piece of information.“We have great pride drawn from how well TOP worksfor first gen and diversity, and kids with special talents.For us, removing the testing was a big help in looking ateverything else.”Dean from a small private collegeDEFINING ACCESS: HOW TEST-OPTIONAL WORKS SPRING 20184
OBSERVATIONS ON THE TEST-OPTIONAL MOVEMENTA rapidly increasing number of colleges and universities have adopted test-optional admission policies, or TOPs, thatallow some or all of their applicants to refrain from submitting standardized test scores. The institutions that officiallydeemphasize standardized tests in admission now total more than 1,000, including over 100 more not-for-profitinstitutions1 in the past four years (FairTest List, 2018). From early adopter TOP institutions (Bowdoin in 1969, andBates in 1984) to those recently adopting a TOP (Wesleyan and Bryn Mawr, both in 2014, George WashingtonUniversity in 2016), some of the institutions choosing a TOP have national reputations for excellence. But TOP is notused just by highly selective private institutions—the FairTest list covers a range of public, regional private, and alsofor-profit institutions. A wide variety of institutions have found TOPs to be workable, productive tools to support theirenrollment planning.The momentum of the Test-Optional movement appears to be fed in part by several overlapping changes in howacademic promise and outcomes are being evaluated. Collectively these changes are moving admission decisions awayfrom heavy reliance on measures increasingly deemed to provide a narrow assessment of human potential. Many K12 schools are moving toward proficiency and standards-based evaluations. Thousands of high schools have stoppedproviding Class Rank, as a false or misleading measure. Many colleges and universities are broadly moving to “holistic”admissions philosophies, using TOPs, and versions of “portfolio” admissions with new technologies like the MasterTranscript that encourage students to provide evidence of individual talents and commitments. Collectively, thesechanges are decreasing the reliance on test scores and class rank to guide college admission decisions and guidebookrankings. Experiments are drawing on the findings of Admissions reform groups like the Institute on Character andAdmission, or several on-going research projects: the “Turning the Tide” Project at Harvard, the Character SkillsSnapshot from the Enrollment Planning Consortium, or the Master Transcript Consortium.As this policy has become more pervasive, researchers have investigated its relative success. A 2015 study out of theUniversity of Georgia (Belasco, 2014) found that, at the aggregate level, selective liberal arts colleges that adopted aTOP (in comparison with those that continued to require SAT or ACT scores) had not increased their enrollment ofURM students or Pell recipients. But in focusing on these high-level, averaged outcomes, that study may not have beenable to discern impact at the institutional level.There has also been a proliferation of research on standardized testing in admission focused on the predictive value oftesting and its fairness relative to various subpopulations of students. Much of the research affirming the value of theSAT and ACT has been conducted by the testing organizations. One such study, a synthesis of recent test score validitystudies (Mattern and Patterson, 2014), states that the SAT provides incremental validity above and beyond HSGPA inthe prediction of cumulative GPA, retention and graduation. Their conclusion: the combination of HSGPA and testingwill produce the most accurate predictions of college success. Another recent release, a just-published volume ofessays, Measuring Success: Testing, Grades and the Future of College Admissions (Buckley, Letukas, and Wildavsky,2018) is principally a response by the College Board and ACT to the rapid growth of TOPs.1The FairTest list includes many colleges that are “For Profit,” and others that are “Test Flexible” -- allowing applicants to choose which form oftesting to submit. The 28 institutions in this study, all Not-for-Profit and none using a “Test Flexible” policy, are drawn from two groups on theFairTest lists: the 129 National Liberal Arts Colleges and National Universities, and the 174 Regional Colleges and Universities.DEFINING ACCESS: HOW TEST-OPTIONAL WORKS SPRING 20185
Challenges to the pervasive use of these tests, their actual value, and their negative impact on students have come ina number of books (Crossing the Finish Line: Completing College at America's Public Universities (Bowen, Chingos,McPherson, 2009); SAT Wars: The Case for Test Optional Admissions (Soares, 2012), the work and recommendationsof the NACAC Commission on the Use of Standardized Testing in Undergraduate Admissions, the ongoing work ofFairTest, a thoughtful documentary film released in early 2018, "The Test and the Art of Thinking" (Davis, 2018), and avariety of articles and smaller research projects.In particular, the exhaustive research available in Crossing the Finish Line has been centrally important in thisdiscussion. The authors, the late William Bowen and Michael McPherson, the former Presidents of Princeton andMacalester, respectively, with their research colleague Matthew Chingos, addressed what characteristics predictedgraduation at a group of large public universities. Their data was drawn from institutions that required standardizedtests from all students; none of the universities they studied had adopted a “threshold” admissions policy, withautomatic admission granted to students who meet cut-off requirements for HSGPA. In the chapter which examinedthe predictive value of test scores and high school grades, they reported that:The findings are dramatic. the coefficients for SAT/ACT scores are always less than 0.02, which means that an increasein test scores of one standard deviation is associated with an increase of less than 2 percentage points in six-yeargraduation rates; this relationship is even negative at the historically black colleges and universities (HBCU’s) . Theconsistency of the results is extraordinary: In all but one of these more than 50 public universities, high school GPA remainsa highly significant predictor of six-year graduation rates after taking account of the effects of test scores. Test scores,on the other hand, routinely fail to pass standard tests of statistical significance when included with high school GPA inregressions predicting graduation rates, especially when we leave the realm of the most highly selective publicuniversities the remaining incremental predictive power of the SAT/ACT scores disappears entirely when we addcontrols for the high school attended, whereas the predictive value of the high school GPA increases. (Bowen, Chingos,McPherson, 2009)In 2014, William Hiss and Valerie Franks —two of the three co-authors of this study—released Defining Promise:Optional Standardized Testing Policies in American College and University Admission (Hiss, Franks, 2014). It was thefirst large-scale, multi-institution assessment of the outcomes of optional testing, and extended the research done in2010 by Hiss and his co-author Kate Doria, in a 25-year look-back study on the outcomes of the policy at Bates College(Hiss, Doria, 2010).The 2014 research revealed that—when given the option at one of those 33 TOP institutions —roughly a third ofenrolled students chose to apply without standardized test scores (Non-Submitters). These Non-Submitters went onto graduate at virtually the same rates (a 0.6% difference) and with nearly the same college GPA (0.05 of a Cum GPApoint) as the Submitters whose test scores were considered in the admission process. Their research also concludedthat Non-Submitters were more likely to be first-generation-to-college, underrepresented minority students, women,Pell Grant recipients, and students with Learning Differences. And, using large volumes of HSGPA data, their findingsunderscored the sturdiness of the HSGPA as a predictor of college performance.This research highlighted an interesting intersection between the testing agencies and that of the counter views. Ameta-analysis of studies of “discrepant performance” revealed that “a quarter to a third of tested students exhibitsome degree of mismatch between their grades and their test scores.” Within this group, approximately half of themhave high school grades that are higher than what the tests would predict. Across the studies cited, the range appearsto be between 11% and 18% of the sample population (Sanchez & Mattern [Making the Case for Standardized Testing]in Buckley, 2018).DEFINING ACCESS: HOW TEST-OPTIONAL WORKS SPRING 20186
Another related study identified the students most likely to have strong HSGPAs and low testing: women, FirstGeneration to college, low income students, and students who speak a second language at home. Furthermore, thosemost likely to be discordant with weaker HSGPAs and stronger testing are males, whites, and those of higher income(Sanchez and Edmunds, 2015).We would emphasize that the results only include those students who took the tests. It is quite plausible that thereare other students who might have succeeded in college, had they been encouraged, found the right mentor, or werenot so discouraged by the costs. If so, the real “discrepancies” may be even higher.And it is worth noting the parallels between the proportions noted in the above studies and the median percentage(23%) of students choosing to be Non-Submitters at the institutions in this study. Does TOP indeed serve this“discrepant” population of students? Does it reduce admission barriers for underserved populations? The followingstudy design continues with the full list of research questions and explains how we went about answering them.DEFINING ACCESS: HOW TEST-OPTIONAL WORKS SPRING 20187
STUDY DESIGNWe began this study by reviewing the FairTest list of 1000 colleges and universites with one form or another of optionaltesting. In contrast to our 2014 study, we eliminated any highly-specialized institutions (e.g., art institutes). We triedto achieve a balance of institutional types, sizes, selectivity, and geography, as well as to have representation frominstitutions with different approaches to TOP. We approached about one hundred institutions to discuss whether theywould consider joining the study. We launched the study with 28 interested institutions that felt they could providereliable data for the multiple cohorts needed for the study.To give us context, we interviewed the Dean of Admissions or Enrollment VP at each institution in the study abouttheir rationale for adopting a test-optional admission policy as well as commentary about how well they felt it wasworking at their institutions. In many instances, the current dean had not been at the institution at the time ofadoption, so they relayed their best understanding of the circumstances at the time of adoption.We received a large set of data: from the 28 colleges and universities, we received 955,744 student records, with upto 40 data items in each student record. With any dataset of this size, there will be elements that require carefulexamination and decisions about clarity and reliability. However, all data in this study comes from participatingcolleges and universities or from IPEDS. All data was carefully checked and cleaned for consistency and accuracy,leading in almost every case to clarifying follow-up communications with Institutional Research or Admissions researchdirectors. In some instances, new coding schema or changes in computer systems interfered with the institution’sabililty to provide comprehensive information across the span of the study.We use commonly accepted statistical methologies (descriptive statistics, t-tests, chi-squares, Cohen's d) to presentdata and highlight statistical significance, but we have avoided highly complex "semi-experimental" statisticalmethodologies. Rather, we try to present the data in a straightforward fashion: Which students were drawn to beingNon-Submitters of testing? How did Submitters and Non-Submitters compare in high school achievement, andsubsequently in college performance? Did adoption of a TOP have an impact on the institution’s applicant pool orenrolled classes? Did these institutions treat Submitters and Non-Submitters differently in their admission and aidpolicies?The study was not designed to come to a single conclusion about the use of test-optional admission policies, but toexplore as many dimensions around the policy as possible. We began by conducting individual case-study analyses forthe 28 public and private colleges and universities. They have all been guaranteed anonymity, so this report usesaggregated data from subsets of institutions and avoids institutionally-identifiable information. Below each chart ordiagram is a description of the number of institutions and records included, along with a brief profile. In every case wehave included all the institutions that had reliable data for the analysis being presented. This report is a series ofobservations, rather than a series of parallel findings on a single set of data.DEFINING ACCESS: HOW TEST-OPTIONAL WORKS SPRING 20188
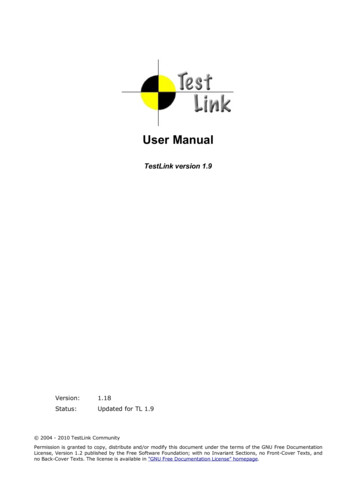
What are the principal research questions?In an effort to shed additional light on the impact of a test-optional admission policy, this report explores severalpertinent questions about test-optional admission: If an institution adopts a test-optional admission policy, does it reduce admission barriers, therebyencouraging more students to apply? Does adopting a test-optional admission policy help an institution attract and enroll more traditionally underrepresented minority (URM), first-generation-to-college, and low-SES students? How do institutions “treat” students who have chosen to withhold their scores from the admission process –in both their admission decisions and their aid decisions? Are there institutional financial implications to adopting a test-optional admission policy? Who are the Non-Submitters -- the students who use a test-optional policy? How do they performacademically in college compared to students who do not use the policy? This portion of the study is a retesting of the findings from "Defining Promise", with a largely different group of institutions, but a parallelmethodology.We are conscious of, and accept, the responsibility to have this study examine both the ethical issues like access anddiversity, and the strategic issues of yields, changing classes and potential financial impact on the institution.What types of institutions and policies are represented in this study?We focused our participant recruitment on 4-year, degree-granting, IPEDS-submitting, public and private not-forprofit institutions in the United States. We then investigated the breadth of test-optional (TOP) policy typesemployed by institutions in the U.S. There is no standard definition of “test-optional admission,” leaving institutionsto define and implement a variety of policies. We organized the various versions of the policy in common categories,and we found, in approximate numbers, the primary types of TOP used by institutions (in rank order of frequencythey were observed): Academic Threshold, Optional for All, Optional Plus, Optional for Some, and Test Flexible. Themost commonly used policies—Optional for All and Academic Threshold—were of particular interest, as was theOptional Plus policy. Institutions with Test Blind and Test Flexible policies were not considered for inclusion in thisstudy. While considered, no Optional for Some institutions were included in the study due to small numbers of NonSubmitters. Figure 1, below, describes each policy in more detail, estimates the proportion of that policy typerepresented in the U.S., and then counts those represented in the present study.DEFINING ACCESS: HOW TEST-OPTIONAL WORKS SPRING 20189
Figure 1. Test-Optional Policy Types, as of Spring 2016This investigation and categorization focused on IPEDS Reporting, Degree granting, 4-year Public and Private Not-for-Profit Institutions on theFairTest List.Some institutions (including many public universities) have a required HSGPA or class rank for Non-Submitters, oftena requirement from a state education agency or the legislature. We have referred to this form of TOP as “academicthreshold,” in that the students must meet the required HSGPA for automatic admission. Shaped largely by the abilityof particular threshold institutions to provide data, our research in the 2014 study had more of these “threshold” publicinstitutions than this 2018 study. The best known of these are the Texas “Top 10%” policy at all Texas publicuniversities, and the GPA requirement at the California State University system. Those requirements often become aself-fulfilling prophecy of student success in college. While sometimes contentious, a number of these policies havebeen in place for many years and seem to work successfully to open these public universities to a wider pool ofapplicants.It should be noted that some institutions could fit the definitions of a couple of categories and/or have migrated fromone to another. For instan
experiencing varied outcomes. Much of the momentum around Test-Optional admission is focused on whether the use of standardized tests (specifically SAT and ACT) unnecessarily truncates the admission of otherwise well-qualified students. In particular, there is concern about whether widespread reliance on the use of these tests in the admission