Transcription
MIXED METHODS APPRAISAL TOOL (MMAT)VERSION 2018User guidePrepared byQuan Nha HONGa, Pierre PLUYEa,, Sergi FÀBREGUESb, Gillian BARTLETTa, Felicity BOARDMANc,Margaret CARGOd, Pierre DAGENAISe, Marie‐Pierre GAGNONf, Frances GRIFFITHSc, Belinda NICOLAUa,Alicia O’CATHAINg, Marie‐Claude ROUSSEAUh, & Isabelle VEDELaaMcGill University, Montréal, Canada; bUniversitat Oberta de Catalunya, Barcelona, Spain; cUniversity of Warwick, Coventry, England;dUniversity of Canberra, Canberra, Australia; eUniversité de Sherbrooke, Sherbrooke, Canada; fUniversité Laval, Québec, Canada;gUniversity of Sheffield, Sheffield, England; hInstitut Armand‐Frappier Research Centre, Laval, CanadaLast update: August 1st, 2018
What is the MMAT?The MMAT is a critical appraisal tool that is designed for the appraisal stage ofsystematic mixed studies reviews, i.e., reviews that include qualitative, quantitative andmixed methods studies. It permits to appraise the methodological quality of fivecategories to studies: qualitative research, randomized controlled trials, non-randomizedstudies, quantitative descriptive studies, and mixed methods studies.How was the MMAT developed?The MMAT was developed in 2006 (Pluye et al., 2009a) and was revised in 2011 (Paceet al., 2012). The present version 2018 was developed on the basis of findings from aliterature review of critical appraisal tools, interviews with MMAT users, and an eDelphi study with international experts (Hong, 2018). The MMAT developers arecontinuously seeking for improvement and testing of this tool. Users’ feedback is alwaysappreciated.What the MMAT can be used for?The MMAT can be used to appraise the quality of empirical studies, i.e., primaryresearch based on experiment, observation or simulation (Abbott, 1998; Porta et al.,2014). It cannot be used for non-empirical papers such as review and theoretical papers.Also, the MMAT allows the appraisal of most common types of study methodologiesand designs. However, some specific designs such as economic and diagnostic accuracystudies cannot be assessed with the MMAT. Other critical appraisal tools might berelevant for these designs.What are the requirements?Because critical appraisal is about judgment making, it is advised to have at least tworeviewers independently involved in the appraisal process. Also, using the MMATrequires experience or training in these domains. For instance, MMAT users may behelped by a colleague with specific expertise when needed.How to use the MMAT?This document comprises two parts: checklist (Part I) and explanation of the criteria(Part II).1. Respond to the two screening questions. Responding ‘No’ or ‘Can’t tell’ to one orboth questions might indicate that the paper is not an empirical study, and thuscannot be appraised using the MMAT. MMAT users might decide not to use thesequestions, especially if the selection criteria of their review are limited to empiricalstudies.2. For each included study, choose the appropriate category of studies to appraise. Lookat the description of the methods used in the included studies. If needed, use thealgorithm at the end of this document.3. Rate the criteria of the chosen category. For example, if the paper is a qualitativestudy, only rate the five criteria in the qualitative category. The ‘Can’t tell’ responsecategory means that the paper do not report appropriate information to answer ‘Yes’or ‘No’, or that report unclear information related to the criterion. Rating ‘Can’t tell’could lead to look for companion papers, or contact authors to ask more informationor clarification when needed. In Part II of this document, indicators are added forsome criteria. The list is not exhaustive and not all indicators are necessary. Youshould agree among your team which ones are important to consider for your fieldand apply them uniformly across all included studies from the same category.How to score?It is discouraged to calculate an overall score from the ratings of each criterion. Instead,it is advised to provide a more detailed presentation of the ratings of each criterion tobetter inform the quality of the included studies. This may lead to perform a sensitivityanalysis (i.e., to consider the quality of studies by contrasting their results). Excludingstudies with low methodological quality is usually discouraged.How to cite this document?Hong QN, Pluye P, Fàbregues S, Bartlett G, Boardman F, Cargo M, Dagenais P, GagnonM-P, Griffiths F, Nicolau B, O’Cathain A, Rousseau M-C, Vedel I. Mixed MethodsAppraisal Tool (MMAT), version 2018. Registration of Copyright (#1148552), CanadianIntellectual Property Office, Industry Canada.For dissemination, application, and feedback: Please contact mixed.methods.appraisal.tool@gmail.comFor more information: /1
Part I: Mixed Methods Appraisal Tool (MMAT), version 2018Category of studydesignsScreening questions(for all types)1. Qualitative2. Quantitativerandomized controlledtrials3. Quantitative nonrandomized4. Quantitativedescriptive5. Mixed methodsMethodological quality criteriaYesNoResponsesCan’t tellCommentsS1. Are there clear research questions?S2. Do the collected data allow to address the research questions?Further appraisal may not be feasible or appropriate when the answer is ‘No’ or ‘Can’t tell’ to one or both screening questions.1.1. Is the qualitative approach appropriate to answer the research question?1.2. Are the qualitative data collection methods adequate to address the research question?1.3. Are the findings adequately derived from the data?1.4. Is the interpretation of results sufficiently substantiated by data?1.5. Is there coherence between qualitative data sources, collection, analysis and interpretation?2.1. Is randomization appropriately performed?2.2. Are the groups comparable at baseline?2.3. Are there complete outcome data?2.4. Are outcome assessors blinded to the intervention provided?2.5 Did the participants adhere to the assigned intervention?3.1. Are the participants representative of the target population?3.2. Are measurements appropriate regarding both the outcome and intervention (or exposure)?3.3. Are there complete outcome data?3.4. Are the confounders accounted for in the design and analysis?3.5. During the study period, is the intervention administered (or exposure occurred) as intended?4.1. Is the sampling strategy relevant to address the research question?4.2. Is the sample representative of the target population?4.3. Are the measurements appropriate?4.4. Is the risk of nonresponse bias low?4.5. Is the statistical analysis appropriate to answer the research question?5.1. Is there an adequate rationale for using a mixed methods design to address the research question?5.2. Are the different components of the study effectively integrated to answer the research question?5.3. Are the outputs of the integration of qualitative and quantitative components adequately interpreted?5.4. Are divergences and inconsistencies between quantitative and qualitative results adequately addressed?5.5. Do the different components of the study adhere to the quality criteria of each tradition of the methods involved?2
Part II: Explanations1. Qualitative studiesMethodological quality criteria“Qualitative research is an approach for exploring and understanding themeaning individuals or groups ascribe to a social or human problem”(Creswell, 2013b, p. 3).1.1. Is the qualitative approach appropriate to answer the research question?Common qualitative research approaches include (this list if notexhaustive):ExplanationsThe qualitative approach used in a study (see non-exhaustive list on the left side of this table) should be appropriate for theresearch question and problem. For example, the use of a grounded theory approach should address the development of atheory and ethnography should study human cultures and societies.EthnographyThe aim of the study is to describe and interpret the shared culturalbehaviour of a group of individuals.This criterion was considered important to add in the MMAT since there is only one category of criteria for qualitative studies(compared to three for quantitative studies).1.2. Are the qualitative data collection methods adequate to address the research question?PhenomenologyThe study focuses on the subjective experiences and interpretations of aphenomenon encountered by individuals.ExplanationsThis criterion is related to data collection method, including data sources (e.g., archives, documents), used to address theresearch question. To judge this criterion, consider whether the method of data collection (e.g., in depth interviews and/orgroup interviews, and/or observations) and the form of the data (e.g., tape recording, video material, diary, photo, and/or fieldnotes) are adequate. Also, clear justifications are needed when data collection methods are modified during the study.1.3. Are the findings adequately derived from the data?Narrative researchThe study analyzes life experiences of an individual or a group.Grounded theoryGeneration of theory from data in the process of conducting research (datacollection occurs first).Case studyIn-depth exploration and/or explanation of issues intrinsic to a particularcase. A case can be anything from a decision-making process, to a person,an organization, or a country.Qualitative descriptionThere is no specific methodology, but a qualitative data collection andanalysis, e.g., in-depth interviews or focus groups, and hybrid thematicanalysis (inductive and deductive).ExplanationsThis criterion is related to the data analysis used. Several data analysis methods have been developed and their use depends onthe research question and qualitative approach. For example, open, axial and selective coding is often associated with groundedtheory, and within- and cross-case analysis is often seen in case study.1.4. Is the interpretation of results sufficiently substantiated by data?ExplanationsThe interpretation of results should be supported by the data collected. For example, the quotes provided to justify the themesshould be adequate.1.5. Is there coherence between qualitative data sources, collection, analysis and interpretation?ExplanationsThere should be clear links between data sources, collection, analysis and interpretation.Key references: Creswell (2013a); Sandelowski (2010); Schwandt (2015)3
2. Quantitativerandomizedcontrolled trialsMethodological quality criteriaRandomized controlledclinical trial: A clinicalstudy in which individualparticipants are allocatedto intervention or controlgroups by randomization(intervention assigned byresearchers).2.1. Is randomization appropriately performed?Key references: Higginsand Green (2008);Higgins et al. (2016);Oxford Centre forEvidence-basedMedicine (2016); Portaet al. (2014)ExplanationsIn a randomized controlled trial, the allocation of a participant (or a data collection unit, e.g., a school) into the intervention or control group is based solely on chance.Researchers should describe how the randomization schedule was generated. A simple statement such as ‘we randomly allocated’ or ‘using a randomized design’ is insufficientto judge if randomization was appropriately performed. Also, assignment that is predictable such as using odd and even record numbers or dates is not appropriate. At minimum,a simple allocation (or unrestricted allocation) should be performed by following a predetermined plan/sequence. It is usually achieved by referring to a published list of randomnumbers, or to a list of random assignments generated by a computer. Also, restricted allocation can be performed such as blocked randomization (to ensure particular allocationratios to the intervention groups), stratified randomization (randomization performed separately within strata), or minimization (to make small groups closely similar withrespect to several characteristics). Another important characteristic to judge if randomization was appropriately performed is allocation concealment that protects assignmentsequence until allocation. Researchers and participants should be unaware of the assignment sequence up to the point of allocation. Several strategies can be used to ensureallocation concealment such relying on a central randomization by a third party, or the use of sequentially numbered, opaque, sealed envelopes (Higgins et al., 2016).2.2. Are the groups comparable at baseline?ExplanationsBaseline imbalance between groups suggests that there are problems with the randomization. Indicators from baseline imbalance include: “(1) unusually large differencesbetween intervention group sizes; (2) a substantial excess in statistically significant differences in baseline characteristics than would be expected by chance alone; (3) imbalancein key prognostic factors (or baseline measures of outcome variables) that are unlikely to be due to chance; (4) excessive similarity in baseline characteristics that is notcompatible with chance; (5) surprising absence of one or more key characteristics that would be expected to be reported” (Higgins et al., 2016, p. 10).2.3. Are there complete outcome data?ExplanationsAlmost all the participants contributed to almost all measures. There is no absolute and standard cut-off value for acceptable complete outcome data. Agree among your teamwhat is considered complete outcome data in your field and apply this uniformly across all the included studies. For instance, in the literature, acceptable complete data valueranged from 80% (Thomas et al., 2004; Zaza et al., 2000) to 95% (Higgins et al., 2016). Similarly, different acceptable withdrawal/dropouts rates have been suggested: 5% (deVet et al., 1997; MacLehose et al., 2000), 20% (Sindhu et al., 1997; Van Tulder et al., 2003) and 30% for a follow-up of more than one year (Viswanathan and Berkman, 2012).2.4. Are outcome assessors blinded to the intervention provided?ExplanationsOutcome assessors should be unaware of who is receiving which interventions. The assessors can be the participants if using participant reported outcome (e.g., pain), theintervention provider (e.g., clinical exam), or other persons not involved in the intervention (Higgins et al., 2016).2.5 Did the participants adhere to the assigned intervention?ExplanationsTo judge this criterion, consider the proportion of participants who continued with their assigned intervention throughout follow-up. “Lack of adherence includes imperfectcompliance, cessation of intervention, crossovers to the comparator intervention and switches to another active intervention.” (Higgins et al., 2016, p. 25).4
3. Quantitative non-randomized studiesMethodological quality criteriaNon-randomized studies are defined as any quantitativestudies estimating the effectiveness of an intervention orstudying other exposures that do not use randomization toallocate units to comparison groups (Higgins and Green,2008).3.1. Are the participants representative of the target population?Common designs include (this list if not exhaustive):ExplanationsIndicators of representativeness include: clear description of the target population and of the sample (inclusion and exclusion criteria), reasonswhy certain eligible individuals chose not to participate, and any attempts to achieve a sample of participants that represents the targetpopulation.3.2. Are measurements appropriate regarding both the outcome and intervention (or exposure)?Non-randomized controlled trialsThe intervention is assigned by researchers, but there is norandomization, e.g., a pseudo-randomization. A nonrandom method of allocation is not reliable in producingalone similar groups.ExplanationsIndicators of appropriate measurements include: the variables are clearly defined and accurately measured; the measurements are justified andappropriate for answering the research question; the measurements reflect what they are supposed to measure; validated and reliability testedmeasures of the intervention/exposure and outcome of interest are used, or variables are measured using ‘gold standard’.3.3. Are there complete outcome data?Cohort studySubsets of a defined population are assessed as exposed,not exposed, or exposed at different degrees to factors ofinterest. Participants are followed over time to determine ifan outcome occurs (prospective longitudinal).ExplanationsAlmost all the participants contributed to almost all measures. There is no absolute and standard cut-off value for acceptable complete outcomedata. Agree among your team what is considered complete outcome data in your field (and based on the targeted journal) and apply thisuniformly across all the included studies. For example, in the literature, acceptable complete data value ranged from 80% (Thomas et al., 2004;Zaza et al., 2000) to 95% (Higgins et al., 2016). Similarly, different acceptable withdrawal/dropouts rates have been suggested: 5% (de Vet etal., 1997; MacLehose et al., 2000), 20% (Sindhu et al., 1997; Van Tulder et al., 2003) and 30% for follow-up of more than one year(Viswanathan and Berkman, 2012).3.4. Are the confounders accounted for in the design and analysis?Case-control studyCases, e.g., patients, associated with a certain outcome areselected, alongside a corresponding group of controls.Data is collected on whether cases and controls wereexposed to the factor under study (retrospective).Cross-sectional analytic studyAt one particular time, the relationship between healthrelated characteristics (outcome) and other factors(intervention/exposure) is examined. E.g., the frequency ofoutcomes is compared in different population subgroupsaccording to the presence/absence (or level) of theintervention/exposure.Key references for non-randomized studies: Higgins andGreen (2008); Porta et al. (2014); Sterne et al. (2016);Wells et al. (2000)ExplanationsConfounders are factors that predict both the outcome of interest and the intervention received/exposure at baseline. They can distort theinterpretation of findings and need to be considered in the design and analysis of a non-randomized study. Confounding bias is low if there isno confounding expected, or appropriate methods to control for confounders are used (such as stratification, regression, matching,standardization, and inverse probability weighting).3.5 During the study period, is the intervention administered (or exposure occurred) as intended?ExplanationsFor intervention studies, consider whether the participants were treated in a way that is consistent with the planned intervention. Since theintervention is assigned by researchers, consider whether there was a presence of contamination (e.g., the control group may be indirectlyexposed to the intervention) or whether unplanned co-interventions were present in one group (Sterne et al., 2016).For observational studies, consider whether changes occurred in the exposure status among the participants. If yes, check if these changes arelikely to influence the outcome of interest, were adjusted for, or whether unplanned co-exposures were present in one group (Morgan et al.,2017).5
4. Quantitative descriptive studiesMethodological quality criteriaQuantitative descriptive studies are “concerned with anddesigned only to describe the existing distribution ofvariables without much regard to causal relationships orother hypotheses” (Porta et al., 2014, p. 72). They are usedto monitoring the population, planning, and generatinghypothesis (Grimes and Schulz, 2002).4.1. Is the sampling strategy relevant to address the research question?Common designs include the following single-groupstudies (this list if not exhaustive):Incidence or prevalence study without comparisongroupIn a defined population at one particular time, what ishappening in a population, e.g., frequencies of factors(importance of problems), is described (portrayed).Survey“Research method by which information is gathered byasking people questions on a specific topic and the datacollection procedure is standardized and well defined.”(Bennett et al., 2011, p. 3).Case seriesA collection of individuals with similar characteristics areused to describe an outcome.Case reportAn individual or a group with a unique/unusual outcome isdescribed in detail.Key references: Critical Appraisal Skills Programme(2017); Draugalis et al. (2008)ExplanationsSampling strategy refers to the way the sample was selected. There are two main categories of sampling strategies: probability sampling(involve random selection) and non-probability sampling. Depending on the research question, probability sampling might be preferable. Nonprobability sampling does not provide equal chance of being selected. To judge this criterion, consider whether the source of sample isrelevant to the target population; a clear justification of the sample frame used is provided; or the sampling procedure is adequate.4.2. Is the sample representative of the target population?ExplanationsThere should be a match between respondents and the target population. Indicators of representativeness include: clear description of the targetpopulation and of the sample (such as respective sizes and inclusion and exclusion criteria), reasons why certain eligible individuals chose notto participate, and any attempts to achieve a sample of participants that represents the target population.4.3. Are the measurements appropriate?ExplanationsIndicators of appropriate measurements include: the variables are clearly defined and accurately measured, the measurements are justified andappropriate for answering the research question; the measurements reflect what they are supposed to measure; validated and reliability testedmeasures of the outcome of interest are used, variables are measured using ‘gold standard’, or questionnaires are pre-tested prior to datacollection.4.4. Is the risk of nonresponse bias low?ExplanationsNonresponse bias consists of “an error of nonobservation reflecting an unsuccessful attempt to obtain the desired information from an eligibleunit.” (Federal Committee on Statistical Methodology, 2001, p. 6). To judge this criterion, consider whether the respondents and nonrespondents are different on the variable of interest. This information might not always be reported in a paper. Some indicators of lownonresponse bias can be considered such as a low nonresponse rate, reasons for nonresponse (e.g., noncontacts vs. refusals), and statisticalcompensation for nonresponse (e.g., imputation).The nonresponse bias is might not be pertinent for case series and case report. This criterion could be adapted. For instance, complete data onthe cases might be important to consider in these designs.4.5. Is the statistical analysis appropriate to answer the research question?ExplanationsThe statistical analyses used should be clearly stated and justified in order to judge if they are appropriate for the design and research question,and if any problems with data analysis limited the interpretation of the results.6
5. Mixed methods studiesMethodological quality criteriaMixed methods (MM) research involves combining qualitative(QUAL) and quantitative (QUAN) methods. In this tool, to beconsidered MM, studies have to meet the following criteria (Creswelland Plano Clark, 2017): (a) at least one QUAL method and one QUANmethod are combined; (b) each method is used rigorously in accordanceto the generally accepted criteria in the area (or tradition) of researchinvoked; and (c) the combination of the methods is carried out at theminimum through a MM design (defined a priori, or emerging) and theintegration of the QUAL and QUAN phases, results, and data.5.1. Is there an adequate rationale for using a mixed methods design to address the research question?Common designs include (this list if not exhaustive):Convergent designThe QUAL and QUAN components are usually (but not necessarily)concomitant. The purpose is to examine the same phenomenon byinterpreting QUAL and QUAN results (bringing data analysis togetherat the interpretation stage), or by integrating QUAL and QUANdatasets (e.g., data on same cases), or by transforming data (e.g.,quantization of qualitative data).Sequential explanatory designResults of the phase 1 - QUAN component inform the phase 2 - QUALcomponent. The purpose is to explain QUAN results using QUALfindings. E.g., the QUAN results guide the selection of QUAL datasources and data collection, and the QUAL findings contribute to theinterpretation of QUAN results.Sequential exploratory designResults of the phase 1 - QUAL component inform the phase 2 - QUANcomponent. The purpose is to explore, develop and test an instrument(or taxonomy), or a conceptual framework (or theoretical model). E.g.,the QUAL findings inform the QUAN data collection, and the QUANresults allow a statistical generalization of the QUAL findings.Key references: Creswell et al. (2011); Creswell and Plano Clark,(2017); O'Cathain (2010)ExplanationsThe reasons for conducting a mixed methods study should be clearly explained. Several reasons can be invoked such as toenhance or build upon qualitative findings with quantitative results and vice versa; to provide a comprehensive and completeunderstanding of a phenomenon or to develop and test instruments (Bryman, 2006).5.2. Are the different components of the study effectively integrated to answer the research question?ExplanationsIntegration is a core component of mixed methods research and is defined as the “explicit interrelating of the quantitative andqualitative component in a mixed methods study” (Plano Clark and Ivankova, 2015, p. 40). Look for information on howqualitative and quantitative phases, results, and data were integrated (Pluye et al., 2018). For instance, how data gathered by bothresearch methods was brought together to form a complete picture (e.g., joint displays) and when integration occurred (e.g.,during the data collection-analysis or/and during the interpretation of qualitative and quantitative results).5.3. Are the outputs of the integration of qualitative and quantitative components adequately interpreted?ExplanationsThis criterion is related to meta-inference, which is defined as the overall interpretations derived from integrating qualitative andquantitative findings (Teddlie and Tashakkori, 2009). Meta-inference occurs during the interpretation of the findings from theintegration of the qualitative and quantitative components, and shows the added value of conducting a mixed methods studyrather than having two separate studies.5.4. Are divergences and inconsistencies between quantitative and qualitative results adequately addressed?ExplanationsWhen integrating the findings from the qualitative and quantitative components, divergences and inconsistencies (also calledconflicts, contradictions, discordances, discrepancies, and dissonances) can be found. It is not sufficient to only report thedivergences; they need to be explained. Different strategies to address the divergences have been suggested such as reconciliation,initiation, bracketing and exclusion (Pluye et al., 2009b). Rate this criterion ‘Yes’ if there is no divergence.5.5. Do the different components of the study adhere to the quality criteria of each tradition of the methods involved?ExplanationsThe quality of the qualitative and quantitative components should be individually appraised to ensure that no important threats totrustworthiness are present. To appraise 5.5, use criteria for the qualitative component (1.1 to 1.5), and the appropriate criteria forthe quantitative component (2.1 to 2.5, or 3.1 to 3.5, or 4.1 to 4.5). The quality of both components should be high for the mixedmethods study to be considered of good quality. The premise is that the overall quality of a mixed methods study cannot exceedthe quality of its weakest component. For example, if the quantitative component is rated high quality and the qualitativecomponent is rated low quality, the overall rating for this criterion will be of low quality.7
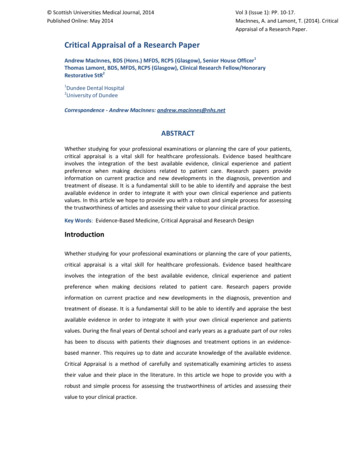
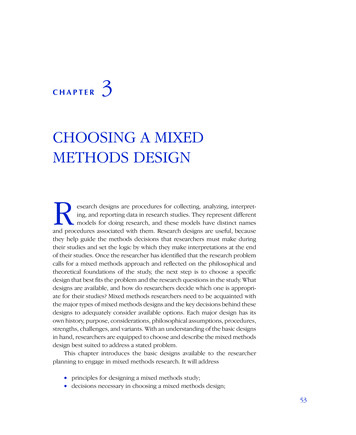
Algorithm for selecting the study categories to rate in the MMAT*.*Adapted from National Institute for Health Care Excellence. (2012). Methods for the development of nice public health guidance. London: National Institute for Health and Care Excellence; and Scottish IntercollegiateGuidelines Network. (2017). Algorithm for classifying study design for questions of effectiveness. Retrieved December 1, 2017, from http://www.sign.ac.uk/assets/study design.pdf.8
ReferencesAbbott, A. (1998). The causal devolution. Sociological Methods & Research, 27(2), 148-181.Bennett, C., Khangura, S., Brehaut, J. C., Graham, I. D., Moher, D., Potter, B. K., et al. (2011). Reporting guidelines for survey research: An analysis of published guidance and reporting practices. PLoSMedicine, 8(8), e1001069.Bryman, A. (2006). Integrating quantitative and qualitative research: How is it done? Qualitative Research, 6(1), 97-113.Creswell, J. W. (2013a). Qualitative inquiry and research design: Choosing among five approaches (3rd ed.). Thousand Oaks, CA: SAGE Publications.Creswell, J. W. (2013b). Research design: Qualitative, quantitative, and mixed methods approaches. Thousand Oaks, CA: SAGE Publications.Creswell, J. W., Klassen, A. C., Plano Clark, V. L., Smith, K. C. (2011). Best practices for mixed methods research in the health sciences. Bethesda, MD: Office of Behavioral and Social SciencesResearch, National Institutes of Health. http://obssr.od.nih.gov/mixed methods research.Creswell, J. W., & Plano Clark, V. (2017). Designing and conducting mixed methods research (3rd ed.). Thousand Oaks, CA: SAGE Publications.Critical Appraisal Skills Programme. (2017). CASP checklists. Retrieved December 1, 2017, from http://www.casp-uk.net/casp-tools-checklists.de Vet, H. C., de Bie, R. A., van der Heijden, G. J., Verhagen, A. P., Sijpkes, P., & Knipschild, P. G. (1997). Systematic reviews on the basis of methodological criteria. Physiotherapy, 83(6), 284-289.Draugalis, J. R., C
The study analyzes life experiences of an individual or a group. Grounded theory Generation of theory from data in the process of conducting research (data collection occurs first). theory, and within- and cross-case analysis is often seen in case study. Case study In-depth exploration and/or explanation of issues intrinsic to a particular case.