Transcription
Digital Culture:Consumption inLockdownInsights from the ConsumerTracking StudyTHEMATIC REPORT AUGUST 2020
Digital Culture - Consumer Tracking StudyContentsSection 1 – Introduction3About the Cultural Consumption Tracker4Timeline of Events5Section 2 – Summary & Conclusions6Section 3 – Thematic Analysis10Theme 1 - The Impact Of Lockdown On Cultural Consumption11Theme 2 - Content Creators13Theme 3 - Streaming vs. Downloading – Music, Film, TV15Theme 4 - Illegal vs Legal18Theme 5 - Non-traditional Consumption20Theme 6 - Physical Purchasing22Section 4 – Cultural Consumption – In Their Own Words24Section 5 – Appendix272
Digital Culture - Consumer Tracking StudySECTION 1Introduction3
Digital Culture - Consumer Tracking StudySECTION 1About the Cultural Consumption TrackerThe Creative Industries Policy and Evidence Centre(PEC) and the Intellectual Property Office (IPO)commissioned AudienceNet to design and conducta weekly nationally representative survey of 1000 consumers aged 16 on how they engage withdigital cultural content in the home.Six weeks of data were collected across sixconsecutive weeks across April and May 2020, withplans for further data collection in July, August andSeptember 2020.As well as asking many questions drawn from theIPO's Online Copyright Infringement (OCI) Tracker,conducted on 9 occasions since 2010, enablingsome historical comparisons, the survey asks abouttime spent engaging with different contentcategories and about impacts of the COVID-19pandemic, including wellbeing.BROADLY THE STUDY SOUGHT TO0102Uncover if/how factors such as thefollowing are impacting culturalconsumption habits:Provide creative businesses andcultural institutions with a detailedunderstanding of consumer needs inrelation to their content, to: More time in the home (as aresult of movement restrictions)Lower levels of mental wellbeing(as a consequence of socialdistancing)The economic effect of the crisisHelp minimise negativeconsequences (e.g. increasedinfringement) Offer insight into newopportunities and ways ofengaging with consumers duringthis period and beyond THE MAIN FOCUS OF THE STUDY WAS ON FIVE CONTENT CATEGORIES:MusicFilmTVVideo gamesE-publishingHowever, a range of additional cultural activities, such as streaming filmed performancesof theatre or watching art online, and other non-cultural activities were also investigatedin terms of engagement and uptake during lockdown.This is a final thematic report based on datafrom all six weeks. It investigates 6 key themes,making comparisons with OCI trend data,where relevant.See the detailed methodology in the Appendixfor more information on the data points usedand how to interpret comparisons.4
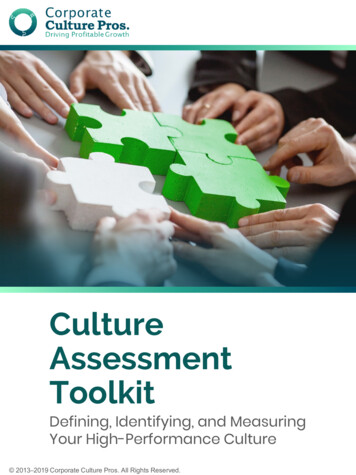
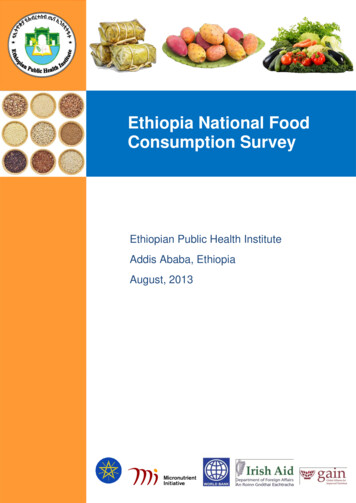
Digital Culture - Consumer Tracking StudySECTION 1Timeline of eventsThis timeline depicts key events that occurred during the time periods the sixweekly surveys were asking respondents about.5
Digital Culture - Consumer Tracking StudySECTION 1Timeline of events6
Digital Culture - Consumer Tracking StudySECTION 2Summary &Conclusions7
Digital Culture - Consumer Tracking Study8SECTION 2Executive SummaryTHEME #1THE IMPACT OF LOCKDOWNON CULTURAL CONSUMPTIONLockdown appears to have grown the audiencesfor digital cultural content. All core categories sawincreases in the proportions accessing them inWave 1 of this study, compared to 2019 levels. Thiswas especially high for those streaming. Overall,the category with the highest proportionalincreases (across both streaming anddownloading) was film.Looking at consumption across socio-economicdifferences, while the proportions consuminggenerally increased for all socio-economic groups,in some categories the rate of increase was loweramong those classified as C2DE (as opposed toABC11)). The result of this (for some categories) wasthe widening of the gap, which was alreadypresent, in digital cultural consumption betweenthese two groups. This was particularly the casefor TV streaming.Likelihood to consume content also differed basedon personal COVID-19-related circumstances (e.g.if they were working from home, still workingoutside the home, self-isolating etc). Across allcontent categories those who were working fromhome (either all the time or more than usual) weremore likely to consume content than those whohad stopped working (e.g. furloughed) or wereworking outside the home. Those who were selfisolating were generally the least likely to consumecontent.THEME #2CONTENT CREATORSIn week 1, half (50%) of respondents indicated thatthey create and post their own (video, written,audio) content online (e.g. posts on Instagram,YouTube, TikTok, Facebook, Pinterest, Soundcloud,Gfycat).The pandemic has led to an increase in contentcreation for 4 in 10 (38%), with 17% of this groupreporting that they had taken it up for the firsttime, whereas half (52%) said their contentcreation was unchanged. Increased productionsince the pandemic was significantly higheramong younger people (16-24 year olds), with the55 having the highest proportion of first timecontent creators (26%).Week-on-week, approximately a quarter ofrespondents reported creating and postingcontent online within the previous week. By theend of the study, more of our cohort had becomecontent creators, with a 6% increase in the overallproportion who had ever done so (going from 50%to 56%).In terms of the behaviours of content creatorsacross the weeks, there were few differences bygender, instead they were correlated with age.Younger respondents (16-34) were more frequentcreators, for both daily and weekly sharing. Thisage group also tended to be more consistent intheir actions across the weeks.THEME #3STREAMING VS. DOWNLOADING– MUSIC, FILM, TVLooking at the proportions streaming vs.downloading across music, film and TV, the generaltrend present in the OCI over the past 5 yearscontinued (Leung et al, 2020). For all threecategories, the proportions streaming weresomewhat ahead of downloading. The increase inthe proportion streaming in the previous 3-monthsin Wave 1 of this study was, compared to OCI 2019,also considerably steeper for streaming comparedto downloading.Across the weeks, interestingly, all three categoriessaw peaks in the proportions both streaming anddownloading in week 2 (which asked about the13th-19th April). After this, the proportionsdownloading reduced, falling below week 1 levelsfor music and film. While the proportions streamingalso declined post the peak, they werecomparatively more stable.In terms of age, younger age groups (especially16-24 year olds) generally tended to be moreengaged, with higher proportions downloadingand streaming. Across the weeks, increases indownloading and streaming were generally morecommon among younger age groups, howeversome categories and methods of access also sawincreases across other age groups.These were assigned using NRS social grades using occupation informationgathered from the survey. ABC1 are those who have an occupation which is‘higher managerial, administrative and professional’, ‘intermediate managerial’,‘administrative and professional’ or ‘supervisory, clerical and junior managerial,administrative and professional’. C2DE include those who are: ‘skilled manualworkers’, ‘semi-skilled and unskilled manual workers’, ‘state pensioners, casualand lowest grade workers, unemployed with state benefits only’.1
Digital Culture - Consumer Tracking StudySECTION 2Executive SummaryTHEME #4ILLEGAL VS LEGALWhen comparing data points on the proportionswho had used at least one illegal source (in theprevious 3-months) to access content prelockdown (in the OCI 2019) with those doing soduring lockdown (in the week 1 survey), these eitherremained consistent or decreased in mostcategories. The exceptions to this were videogames and music downloading which bothexperienced increases ( 6% in video games and 3% in music downloads).In terms of weekly consumption during the study,the proportions of respondents who had used atleast one illegal source to access content variedconsiderably by category. Music downloadinggenerally had the highest proportion using illegalsources, while music streaming had the lowest.Many categories exhibited a similar patternwhereby the levels of infringement were highest inweek 1 and then declined over the course of thestudy. Some saw more variation across the weeks(video games and e-publishing categories).The highest volume of content consumed in allcategories was in the first week of the survey, afterwhich it tended to decline. For some categories,this was also the peak in terms of the volume ofillegal content accessed. More specifically, theillegal volume tended to decline from week 2onwards.THEME #5NON-TRADITIONALCONSUMPTIONA range of non-traditional cultural activities wereincluded in the study. Here we focus onengagement with video games (playingmultiplayer games themselves and/or watching esports or live streams), watching filmedperformances (i.e. of theatre, concerts and/ordance shows online) and looking at art online (e.g.paintings and photographs).Between 3 and 4 in 10 of our sample had “ever”engaged with video games either by playingmultiplayer games or watching e-sports orstreams when the study started (i.e. in week 1).Engagement tended to skew towards males andyounger age groups (16-34). These video gameenthusiasts were consistent in their levels ofconsumption across the six weeks of the study.Approximately half of respondents had “ever”watched filmed performances or looked at artonline in week 1, with around a fifth of thosehaving started undertaking each activity since theCOVID-19 pandemic. There were only slight ageand gender differences in the activities. Whileweekly engagement with the activities was slightlyhigher earlier on in the study, it generallysustained.THEME #6PHYSICAL PURCHASINGAt the start of the study (week 1 - consumptionbetween 2nd-12th April), for each category,consumption via physical products such as musicCDs or vinyl and DVDs or Blu-Rays of films/TVshows was the least common method of access bysome way. This was broadly in-line with physicalpurchasing trends captured in previous waves ofthe OCI. However, lockdown appears to haveencouraged a greater number of people to makephysical purchases. While this method (largely)remained somewhat behind other means ofaccess, there was a notable uplift for allcategories. For most, there was a peak in theproportion who had made physical purchases inweek 2, after which there was a steady decline,however levels remained above those reported inweek 1. For categories within publishing (i.e. books,magazines and audiobooks), the increase led tophysical purchasing being as common as (and attimes more so than) digital consumption.Encouragingly for retail within the creativeindustries, the increase in the number of peoplemaking physical purchases was largely driven byyounger age groups (16-34 year olds). Thesegroups generally tend to be heavy consumers ofcultural products and services through digitalmethods, so lockdown may have led to abroadening of their tastes and preferences.9
Digital Culture - Consumer Tracking StudySECTION 3ThematicAnalysis10
Digital Culture - Consumer Tracking StudyTHEME 01The impact of lockdown on cultural consumptionThis section looks at changes in consumption pre and during lockdown.It also looks at the impact of the lockdown on the digital divide anddifferences in consumption according to the pandemic-related personalcircumstances of consumers.OVERALL CONSUMPTIONCOVID-19 WORKING STATUSLooking at 3-month data points captured in the2019 OCI study and those in Wave 1 allows us toinvestigate the impact of lockdown on theproportion of people accessing cultural content.More specifically, we can look at the proportionwho accessed content in the previous 3-months asof May 2019, and those who had done so in April2020. Comparative data is available only for fourof our five core content categories (i.e. music, film,TV and video games) due to changes in 2020 withhow e-publishing data is captured.During the six-week duration of the study, eachweek respondents were asked about changes intheir personal circumstances (e.g. were theyworking from home, had they been furloughed,were they self-isolating). Those who were workingfrom home (either all the time or more than usual)were consistently more likely to engage withcontent online at least once in a week whencompared to those who had stopped workingcompletely (i.e. were furloughed) or were stillworking outside of their home.Lockdown appears to have resulted in even morecultural content consumers. Looking at Wave 1 3month data, other than music, all categories sawat least some increases in the proportions whohad downloaded them. Increases were morepronounced (in all categories) for the proportionsstreaming. Overall, film saw the sharpest increasesin both the proportions downloading andstreaming ( 13% and 20% respectively).Those who were self-isolating were generally leastlikely to engage with any content of the categoriesin question - the main exception being e-books.Age is likely to be an important consideration inthis – of those self isolating over half (56%) were55 , a group who, compared with their youngerpeers, were generally less likely to engage withcultural content in many of the categories inquestion.The same category data by socio-economic status(i.e. NRS social grades of ABC1 and C2DE1) showsthat while the proportions consuming contentincreased regardless of socio-economic status, forsome categories this increase occurred at a slowerrate for those classified as C2DE (as opposed toABC1). This was the case for streaming TVprogrammes/episodes in the previous 3-months,where the gap between ABC1 and C2DE rose from6% in the OCI 2019 to 11% in the first wave of thisstudy. The gap also widened, but to a smallerextent, for downloading music (where it increasedfrom 3% to 6%) and for streaming music (from 4%to 7%).ABC1 includes those who have an occupation which is ‘higher m
Theme 3 -Streaming vs. Downloading –Music, Film, TV 15 Theme 4 -Illegal vs Legal 18 Theme 5 -Non-traditional Consumption 20 Theme 6 -Physical Purchasing 22 Section 4 –Cultural Consumption –In Their Own Words 24 Section 5 –Appendix 27 2. Digital Culture -Consumer Tracking Study Introduction SECTION 1 3. Digital Culture -Consumer Tracking Study SECTION 1 About the Cultural Consumption .