Transcription
ORIGINAL RESEARCH ARTICLEpublished: 02 September 2013doi: 10.3389/fpsyg.2013.00564Group rhythmic synchrony and attention in childrenAlexander K. Khalil 1* † , Victor Minces 1† , Grainne McLoughlin 2 and Andrea Chiba 112Department of Cognitive Science, University of California, San Diego, San Diego, CA, USAInstitute of Psychiatry, King’s College, London, UKEdited by:Layne Kalbfleisch, George MasonUniversity, USAReviewed by:Layne Kalbfleisch, George MasonUniversity, USAJie Zhang, The College at BrockportState University of New York, USA*Correspondence:Alexander K. Khalil, Department ofCognitive Science, University ofCalifornia, San Diego 9500 GilmanDrive, La Jolla, CA 92093-0515, USAe-mail: akhalil@ucsd.edu† These authors have contributedequally to this work.Synchrony, or the coordinated processing of time, is an often-overlooked yet criticalcontext for human interaction. This study tests the relationship between the ability tosynchronize rhythmically in a group setting with the ability to attend in 102 elementaryschoolchildren. Impairments in temporal processing have frequently been shown to existin clinical populations with learning disorders, particularly those with Attention DeficitHyperactivity Disorder (ADHD). Based on this evidence, we hypothesized that the abilityto synchronize rhythmically in a group setting—an instance of the type of temporalprocessing necessary for successful interaction and learning—would be correlated withthe ability to attend across the continuum of the population. A music class is an idealsetting for the study of interpersonal timing. In order to measure synchrony in this context,we constructed instruments that allowed the recording and measurement of individualrhythmic performance. The SWAN teacher questionnaire was used as a measurement ofattentional behavior. We find that the ability to synchronize with others in a group musicclass can predict a child’s attentional behavior.Keywords: attention, synchrony, music cognition, temporal processing, learningINTRODUCTIONThe ability to attend is among the most important skills thatchildren must develop and refine. In an interpersonal context,the ability to attend may be related to the ability to synchronize,which we define as the generation of behaviors in coordinationwith an external stimulus at specific points in time. Co-attentionwith a parent emerges in infancy (Deák et al., 2000; de Barbaroet al., 2000) and naturally requires an infant to synchronize,directing gaze, and orientation nearly in unison with the parent.Later, in more complex forms of interaction such as conversation, the ability to synchronize facilitates smooth transfer ofinformation (Bernieri and Rosenthal, 1991).Studies of attention deficit hyperactivity disorder (ADHD)suggest a link between attention and temporal processing, asreviewed by Toplak et al. (2006). Children with ADHD whoby definition display inattentive behavior have been shown toperform more poorly than controls on a variety of temporal processing tasks, such as duration discrimination, duration reproduction, anticipation tasks, and finger tapping tasks (Gilden andMarusich, 2009). Impaired temporal processing has been positedas a cognitive marker of ADHD (Castellanos and Tannock, 2002).Similarly, variability in response times, or reaction time variability(RTV), has been identified as increased in ADHD across a varietyof tasks and contexts (Gilden and Marusich, 2009; Klein et al.,2006).A useful measure of temporal processing can be found inrhythmic components of the practice of music. Rather thanreferring specifically to “beats,” rhythm in music refers to anyform of temporal pattern, regardless of the presence of “beats.”Playing music requires one to maintain synchrony across multiple nested timescales, from tens of milliseconds to minutes.www.frontiersin.orgIn particular, theoretical work suggests that synchronizing withan isochronous beat—a basic musical skill—requires the perception and estimation of time intervals in the order of 10 msto 1000 ms. (Repp, 2005; Jacoby and Repp, 2012). The familiar context of a group music class may be an efficient andecologically-valid method of measuring children’s ability at suchtasks.The aim of this study was to examine the relationshipbetween temporal processing, as measured by the ability of achild to synchronize to a driving beat, in the context of amusic class, and attentional behavior, measured by teacher ratings. While the link between temporal processing and attentional behavior has been confirmed in samples diagnosedwith ADHD, we do not yet know how temporal processing relates to attention in the general population. Based onthe previous literature, we hypothesize that the ability ofchildren to synchronize is correlated with their attentionalbehavior.In order to measure the ability to synchronize, we usespecially-wired instruments that allow detection of eachmallet strike of each player. In order to measure attentional behavior, we use teacher ratings of the Strengthsand Weaknesses of ADHD and Normal Behaviors (SWAN)questionnaire (Swanson et al., 2006). This DSM-IV basedquestionnaire was developed to assess ADHD-like symptoms across the continuum of children’s behavior (ratherthan at the extreme, maladaptive end). We also includedcognitive-performance measures (mean reaction time, RTVand errors) from a task that is often used in attentional andADHD research, the Eriksen Flanker Task (EFT; Albrecht et al.,2008).September 2013 Volume 4 Article 564 1
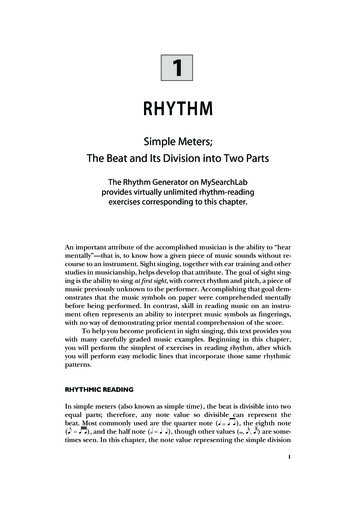
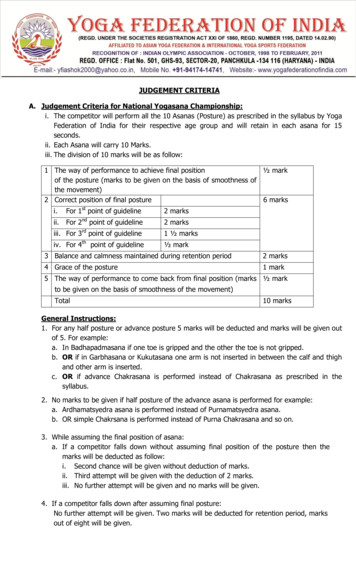
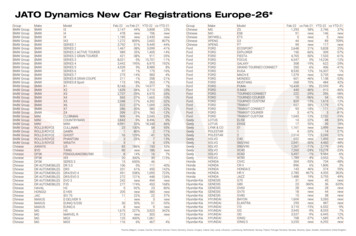
Khalil et al.Group rhythmic synchrony and attention in childrenMATERIALS AND METHODSOVERVIEWParticipants were scored along three different dimensions.Synchrony, pertaining to measurement of musical timing, theSWAN teacher rating questionnaire, which includes a behavioralmeasure of attention (Swanson et al., 2006), and the Eriksenflanker task, a computerized psychometric task often used tomeasure attentional control (Eriksen, 1995).Our assessment of participants’ rhythmic synchrony was conducted in a context that reflected a typical music class. Groupsof roughly 12 participants playing five-keyed metallophones wereseated in a semi circle facing a leader. The leader played a beaton a non-pitched percussion instrument. The synchrony of eachparticipant was assessed [defined] against this beat.A musical beat can be described by the movement of a pointaround the perimeter of a circle. The location of this point withrespect to the center of the circle defines an angle. When playingan isochronous pulse, the exact time of the leader’s onsets (mallet strikes) corresponds to an angle of 0, the quarter beat to anangle of π/2, the offbeat to π, and so forth. We calculated thistime-dependent angle (or phase) based on the leader’s onsets. Wethen calculated each participant’s onsets and analyzed the distribution of the angles of their individual mallet strikes. The morenarrow the distribution of angles, the more regular in relation tothe leader a participant’s playing. Such a player would be rankedmore highly than one with a wider distribution of angles.We then calculated the correlation of within-group synchronyrankings with attention behavior, as measured by the SWANquestionnaire and the Eriksen flanker task. In order to do this wecalculated the correlation coefficients between the different measures. We corrected for performance differences across grades andgenders by using them as covariates.week) and Dr. Khalil was their teacher. Here, it is important to note that Khalil is an ethnomusicologist with 25 yearsexperience studying and/or teaching traditional Balinese gamelan music. Thus, despite his cross-training in behavioral andcomputational neuroscience (expertise held by the other members of the team), he approaches the classroom as a seasonedinstructor.RHYTHMIC SYNCHRONYGamelan is a musical art form that strongly emphasizes rhythmicsynchrony among the ensemble members. A gamelan ensemble ismade up of pitched percussion instruments with bronze keys. Theinstruments used for testing rhythmic synchrony were modeledafter gamelan instruments, see Figure 1.The gamelan-like instruments we designed and constructedfeature piezoelectric film elements applied to each key. Theimportance of this innovation is that it allows each mallet strikeon each key, for each player, to be recorded individually and inisolation in a temporally precise manner (details below). Theinstrument played by the instructor has a distinctively differenttimbre, or harmonic profile, than the ones used by participants.PARTICIPANTSWe tested 102 students from grades 2–6 (Table 1) at theMuseum School, a charter school in San Diego, CA. The ethnic composition of the participants was as follows: White 43%,Hispanic 31%, African American 13%, Asian/Pacific Islander13%. Fifty-six percent were female. The number of studentsin each grade can be seen on Table 1. All of the participants had previous experience with musical training, as itwas one of their curriculum classes (30 min-classes, once aFIGURE 1 Example of musical instrument constructed for this study.These pitched-percussion instruments have a piezoelectric film elementaffixed to each key. This allows isolated recording of each instrument.Table 1 Descriptive statistics.Grade Participants VSSWAN ISWAN CCONG 4.52 (11) 7.1 (22)0.808 (0.18) 0.634 (0.18) 485 (78)166 (78)117 (53)124 (38)71.5 (17)0.575 (0.23) 411 (69)488 (73)144 (63)157 (92)76.9 (32) 16.8 (23) 0.839 (0.19) 0.601 (0.24) 387 (79)459 (90)96.7 (31)106 (55)71.9 (23)446 (54)96.6 (52)98.4 (54) 77.2 (25)0.869 (0.13)0.894 (0.054)4240.854 (0.095) 2.48 (13) 10 (26)5230.915 (0.041) 3.62 (12)180.944 (0.02)RTV CONG RTV INC RTD568 (1e 02) 152 (59)21166RT CONG RT INC527 (91)233.31 (7.9)INC3.92 (15) 0.869 (0.11) 0.607 (0.21) 455 (90) 0.667 (7.1) 3.5 (13)0.784 (0.2)0.856 (0.2)0.568 (0.23) 369 (60)82.7 (40)Average values of the different variables by grade, standard deviations in parenthesis. SWAN I and SWAN C are the mean scores in the mainly inattentive and mainlyhyperactive SWAN questionnaires respectively. CONG and INC stand for proportion correct in the congruent and incongruent conditions respectively. RT is reactiontime (in ms), RTV is within participant variability in reaction time, measured as standard deviation of reaction times. RTD is the difference in reaction time in theincongruent vs. congruent conditions.Frontiers in Psychology Educational PsychologySeptember 2013 Volume 4 Article 564 2
Khalil et al.Group rhythmic synchrony and attention in childrenParticipants within each grade (2–6) were divided into twogroups of equal size; if the number of participants within aparticular grade was odd, one of the groups would have onemore member. Participants were recorded as they attempted tosynchronize with an isochronous beat played by the instructorover 1 min. Because our interest was in recording participantswhile engaged in the task, rather than recording them over along period—during which time many participants could becomedisengaged—we repeated this process four times, interleavingthese episodes with other musical activities across a 30-minrecording session.We calculated the synchrony between each player and theleader according to the following procedure. We first calculatedeach participant’s onsets. In order to find the onsets of the leaderwe ran a complex filter on the audio signal at 200 Hz (50 Hz bandwidth) and took its absolute value. This process revealed clearpeaks coinciding with the onsets. A threshold was chosen by handthrough visual inspection based on the individual records. Thefirst time a peak crossed the threshold was considered the time ofthe onset. If two peaks were observed over a period of 200 ms.we considered only the first one. We adopted this criterion inorder to avoid counting “double-hits” caused by mallet bounce.A similar procedure was used to find the participants’ onsets,except that 500 Hz (50 Hz bandwidth) was used as the filteringfrequency due to the higher fundamental and harmonic profile ofthe participants’ instruments.We next calculated the phase of the leader. In order to do thiswe ran a complex filter on the leader’s onset data centered on 1 Hz(bandwidth.75 Hz) and took the angle of the resulting signal. Thisproduced a time-dependent phase signal that was 0 on the beatand π on the off-beat. A set of phases for each participant wascollected by evaluating the phase signal obtained from the leaderat each participant’s onset times, or mallet strikes.In order to measure the acuity of each participant’s synchrony,we performed a vector strength (VS) analysis. This measurewas introduced by Goldberg and Brown (1968) and has beenextensively employed to analyze synchrony of neural activity.VS is defined as follows: N 1 VS ei ϕj N j 1Where N is the total number of onsets of one participant, j is theonset number, ϕ is the corresponding phase, and i is the imaginary unit. Thus, defined, VS is 1 if the participant always playswith the same phase with respect to the driving beat and 0 if she orhe plays randomly. For each participant, we calculated the averageVS across all four synchronization episodes.VS more accurately reflects the ability to synchronize in a classsetting than others that have been used for similar work, suchas inter-tap variability. This is because it remains unaffected if aplayer misses a few beats or if the lead player changes tempo.ERIKSEN FLANKER TASKThe Eriksen Flanker Task (EFT; Eriksen, 1995) was administeredto each participant. Each participant was asked to press a keywith their left or right index finger when a central arrow (target)www.frontiersin.orgappeared in the middle of the screen pointing in the corresponding direction. 100 ms before the target, two flanking distractorarrows appeared that pointed either in the same (congruentcondition) or opposite (incongruent condition) direction as thetarget arrow. We computed the percentage of correct responses asthe number of correct responses over the total number of presentations for each condition (congruent and incongruent). For thecalculation of reaction time measures we only considered correctresponses. We calculated the mean reaction time for each condition; the RTV, measured as standard deviation; and the reactiontime difference across conditions (incongruent—congruent). Seebelow for a list of all variables.SWAN QUESTIONNAIREThe Strengths and Weaknesses of ADHD Symptoms and NormalBehavior (SWAN) Rating Scale (Swanson et al., 2006) is aquestionnaire of the Likert-type based on the Diagnostic andStatistical Manual of Mental Disorders (4th ed; DSM-IV, APA,1994). The questionnaire assesses children’s behavior along thedimensions of inattention and hyperactivity-impulsivity. It wasdesigned to be sensitive at both the negative and adaptive endsof the two symptom dimensions of ADHD. It was shown tohave internal consistency and test-retest reliability (Arnett et al.,2012) as well as external validity (Arnett et al., 2012) as comparedwith the Disruptive Behavior Rating Scale (DBRS; Barkley andMurphy, 2006).The SWAN is rated on a balanced 7-point Likert-type scale,with anchors far above, above, slightly above, average, slightlybelow, below, and far below. For measuring behavioral attention/inattention, SWAN includes items such as: “Compared toother children”. . . the child . . . “Sustains attention on tasks or playactivities.” It is composed of eighteen questions. Nine of themassess attentive behavior (SWAN I) and the other nine addresshyperactive-impulsive behavior (SWAN H). Therefore, SWANI is a behavioral measure of attention. The total questionnaireis referred to as SWAN C, where C refers to inattentive andhyperactive combined and is considered a measure of ADHD-likebehavior. This questionnaire was filled out for each participant bythe homeroom teacher.For analyzing the SWAN data, we numbered the anchorsfrom 3 to 3 and calculated the sum for SWAN-I and SWAN-C.Note that high scores on the SWAN-I and SWAN-C are associatedwith worse attention and more ADHD-like behavior.STATISTICAL METHODSAll analysis was performed using MATLAB and Statistics ToolboxRelease 2012b, The MathWorks, Inc., Natick, Massachusetts,United States.The variables included in analysis were as follows:1. The average vector strength (VS).2. The SWAN questionnaire, inattentive and combined scores(SWAN I and SWAN C).3. The proportion of correct responses in the congruent andincongruent conditions of the flankers task (CONG and INC).4. The mean reaction times in the EFT (RT CONG and RT INC).September 2013 Volume 4 Article 564 3
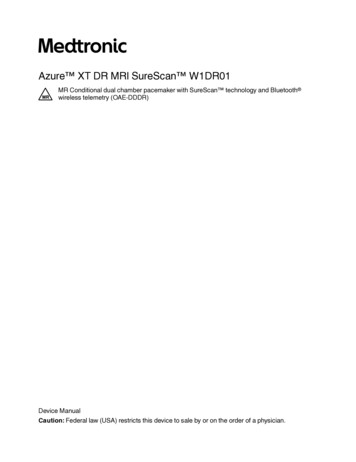
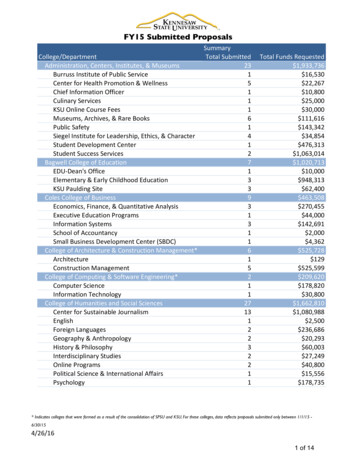
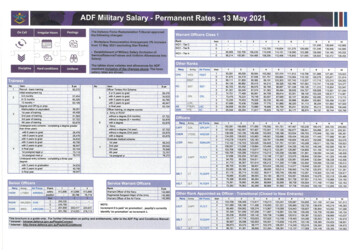
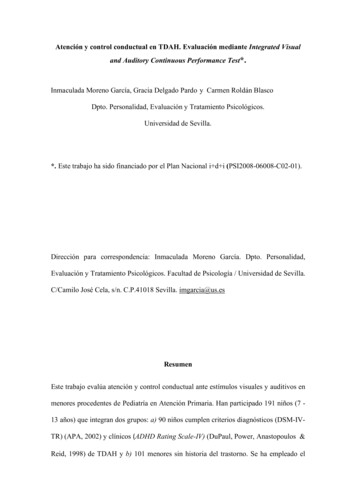
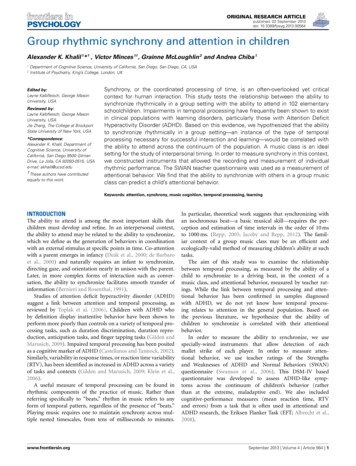
Khalil et al.5. The variability of reaction times in the EFT (RTV CONG andRTV INC).6. The reaction time difference between the CONG and INCconditions in the EFT (RTD).In order to evaluate the significance of the VS values, we usedRayleigh statistics, as provided by the circular statistics toolboxin MATLAB (Berens, 2009).The distribution of VS scores was analyzed and found to behighly skewed ( 2.9) with long tails revealed by the large kurtosis (13.5). Kurtosis is defined here as the fourth standardizedmoment of the distribution. Because of the non-normality ofthe distribution we decided to use the non-parametric KruskallWallis analysis of variance to test differences across groups.A Kruskall-Wallis test revealed a significant difference in VSacross grades [χ2(4, 97) 21.25, p 0.001]; therefore, we usedgrade as a covariate. Since VS scores do not vary linearly withgrade, we treated grade as a nominal rather than continuousvariable.A Kruskall-Wallis test for differences across the two playing groups within the same grade revealed group differencesonly for grade 3 [χ2(1, 14) 7.46, p 0.01]; therefore, we usedplaying group as a covariate for grade 3. Categorical andcontinuous data was combined to evaluate the effect of gender as a possible covariate. A value of 0 was assigned tofemale participants and a value of 1 to male participants,and the partial correlation between gender and the various scores was calculated (using covariates). Female participants were better synchronizers than male participants, reflectedby the fact that gender correlated with VS scores [r(100) 0.22, p 0.04]. Females were also more attentive [SWANI r(100) 0.33, p 0.01], less hyperactive [SWAN H r(100) 0.31, p 0.01], more accurate on the incongruent flankers[INC r(100) 0.27, p 0.02], and had lower reaction timein the congruent condition [RT CONG r(100) 0.26, p 0.02]. Therefore, gender was used as a covariate in all furtheranalyses.Using these covariates, we then calculated the partial correlation between VS scores and each of the other variables (SWANC, SWAN I, CONG, INC, RT CONG, RT INC, RTV CONG,RTV INC, RTD) and analyzed the distribution of the residuals. We found all distributions to be highly skewed (all skewnessvalues were larger in magnitude than 2.2) and to have longtails (all kurtosis were larger than 10). Spearman’s rank correlation was used for further analysis since it is more robust.Spearman’s method ranks the data. Therefore, the variable distributions become symmetric and the influence of outliers isreduced. Spearman’s correlation is generally considered to quantify the degree in which two variables are monotonically related.In the specific case of this study, it quantifies the degree in whichbetter synchronizers tend to be better attenders (SWAN I), or perform better in psychometric task variables proposed to measureaspects of attention (EFT).In order to evaluate the effect of this transformation, the distribution of residuals was analyzed under Spearman’s method: allskewness values were below 0.26 and all kurtosis lay between 2.7and 3.Frontiers in Psychology Educational PsychologyGroup rhythmic synchrony and attention in childrenThe significance of the relationship between the differentvariables and gender remained in Spearman correlations, so gender continued to be used as a co-variate in our further analyses.In summary, we ran Spearman’s partial correlations usinggrade, gender, and group (on 3rd grade) as covariates.RESULTSAll participants in all episodes were significantly synchronized, asassessed by the Rayleigh statistics (p 0.05). Figures 2, 3 presentsan example of a strong synchronizer and a weak synchronizer.Table 1 shows summary statistics of the different variables foreach grade. Table 2 shows the Spearman correlations between allvariables. This is particularly compelling as some of the variablesFIGURE 2 The four sets of stimuli used in the Eriksen Flanker Task.Left to right: right incongruent, right congruent, left congruent, and leftincongruent. The flanking arrows appear 50 milliseconds before thecenter one.FIGURE 3 Examples of good and poor synchronizers. Mallet strikes, oronsets, corresponding to one synchronization episode of 1 min. Each dotcorresponds to one onset. If a dot is above “0” on the y axis, thecorresponding mallet strike took place after that of the leader, if a dot isbelow “0,” the corresponding mallet strike took place before it. The rightpanel displays the spread of the phases. The good synchronizer (bottom)had very little spread relative to the poor synchronizer (top). This spreadwas quantified using vector strength analysis (VS).September 2013 Volume 4 Article 564 4
Khalil et al.Group rhythmic synchrony and attention in childrenconsidered are highly correlated with each other, and 6 out of 9 ofthem are significantly correlated with VS.As shown in Table 2, a significant correlation emerged fromthe ability to synchronize as assessed by VS and most of the othervariables analyzed. VS was correlated with both SWAN categories,the percentage of correct responses in the congruent condition ofthe EFT, the RTV in both the congruent and incongruent conditions, and the reaction time difference between congruent andincongruent conditions.The effects we observed were not driven by data from participants at the extreme end of the continuum of the SWAN-Crating, presenting the strongest ADHD-like behaviors. When datafrom the 20% of participants who scored most poorly on theSWAN-C scale is removed from the analysis, a similar patternof correlations can be observed. These correlations are generallysmaller (Table 3), but this can expected since the data is truncated(Edwards, 1984).DISCUSSIONResults from our investigation of 102 children aged 7–12 indicatethat better synchronizers are also more attentive (SWAN-I), showless ADHD-like behaviors (SWAN-C), and are more accuratewith lower RTV on the EFT.Consistent with these findings is the hypothesis by Rolf thatearly development of attention in children relies on synchronoussocial interaction that emerges from effective audio-visual integration (Rolf et al., 2009). Some theoretical work considersthe ability of joint action as essential to effective social timing(Pacherie and Dokic, 2006). While such work primarily relieson an analysis of the role of the mirror neuron system in jointaction, Schmidt et al. (2011) make the point in a recent article that“Even if perception and action coding occurs in mirror systems asargued by cognitive theorists and such a representational systemis the mechanism that allows us to understand another’s actions,we still need to understand how joint actions are coordinated intime.” Our examination of the ability at rhythmic synchrony ina group context allows for experimental recording of preciselytimed conjoint action, while maintaining some ecological validitywith respect to the classroom. Our finding of a significant correlation between rhythmic synchrony and attention behavior, asrated by teachers, provides an initial step toward establishing suchan area of study.The observed relationship between ability to synchronize andattention behavior may be explained in part by individual variability in the ability to generate rhythmic expectation. The capacity to synchronize is dependent upon the ability to generateTable 2 Correlation matrix.VSSWAN ISWAN C 0.41*** 0.42***SWAN I0.95***SWAN CCONG0.32**INC0.15RT CONGRT INCRTV CONGRTV INCRTD 0.12 0.057 0.43*** 0.34**0.23*0.18 0.150.2 0.220.22* 0.21 0.130.0840.0057 0.19 0.0750.120.00850.27*0.27*0.34** 0.41*** 0.62***0.32**0.63***0.6*** 0.057 0.4***0.13CONG0.81***INCRT CONG0.94***RT INC0.55***0.23*0.0690.47***0.20.37***RTV CONG0.7*** 0.11 0.075RTV INCIt should be noted that bigger scores in the SWAN I and SWAN H scales are associated with poorer attention and higher hyperactivity respectively; both thesevariables are negatively correlated with the ability to synchronize. Higher variability in reaction time has also been associated with poorer attention. Individualcorrelations: *p 0.05, **p 0.01, ***p 0.001.Table 3 Correlation matrix in which data from participants with the poorest attention scores has been excluded from analysis.VSSWAN ISWAN C 0.35** 0.38***SWAN ISWAN CCONGINCRT CONGRT INCRTV CONGRTV INC0.92***CONG0.27*INC0.14 0.2 0.17 0.18 0.0940.81***RT CONGRT INCRTV CONGRTV INC 0.078 0.031 0.34** 0.28*0.16 0.04 0.0890.0990.1 0.0790.14 0.190.028 0.0790.16RTD0.3*0.36** 0.37** 0.62***0.26*0.63***0.59*** 0.042 0.44***0.0310.92***0.52***0.150.46***0.140.66*** 0.0510.29* 0.13 0.11The procedure was identical to that of Table 2 except that data from the 20% of children with the highest SWAN-C scores was excluded. Although the correlationsare smaller, the same pattern as in Table 2 can be observed. This indicates that the statistics are not dominated by the children at the end of the spectrum but canbe seen throughout.www.frontiersin.orgSeptember 2013 Volume 4 Article 564 5
Khalil et al.expectation based on perceived patterns of temporal dynamicsor rhythm, known as rhythmic expectation. The generation ofrhythmic expectation enhances the ability of an individual toperform sensory discriminations at specific points in time. Thisaspect of attention, known as “dynamic attention” (Large andJones, 1999), may play a role both in rhythmic performance andattentional behavior. Poor ability to generate rhythmic expectation can affect ability to modulate attention dynamically inaccordance with temporal patterns created through joint action.This, in turn, could affect both ability to synchronize rhythmicallyand attention in interpersonal interaction.In line with our findings showing a significant relationshipbetween RTV and behavioral ratings of attention and also attention combined with hyperactivity-impulsivity (corresponding toattentional and combined diagnostic subtypes of ADHD, respectively), many studies have found increased RTV in those withADHD on standard reaction time tasks [reviewed by Klein et al.(2006)]. Stimuli for such tasks are very frequently presented at afixed interstimulus interval or ISI (e.g., continuous performancetests). Performance on such tasks, therefore, is partly dependenton the ability to synchronize because they require the generationof rhythmic expectations that enhance sensory discrimination atspecific points in time, or when stimuli are presented (Large andJones, 1999). The extensive literature on increased RTV in ADHDmay then be attributable in part to impairment in the ability tosynchronize.Although the focus of this study is the relationship betweenrhythmic synchrony and attentional behavior, as measured by theinattentive components of the SWAN rating scale, we also found asignificant correlation between rhythmic synchrony and ADHDlike behaviors as assessed by the combined (SWAN C) rating scale.Much of the extant literature that examines the role of timingin relation to attention behavior focuses on differences betweentypically developing subjects and those with ADHD (Toplak et al.,2006). Such a focus tends to frame attention as a binary trait—something that a child either does or does not have. However,attentional behavior exists on a continuum, with the clinical population with ADHD occupying the extreme of the trait. We foundthat the significance of the correlation between the SWAN ratingand VS holds across the full spectrum of attention behavior andrhythmic synchrony, even when the extremes of this continuumare eliminated from the analysis. This is important for our interpretation because it demonstrates that a relation between someaspects of temporal processing (and integration) and attentionbehavior is relevant to the entire population.There are perhaps many subjacent deficits that can lead a childto exhibit behavior that teachers may perceive as associated withpoor attention. It is important to understand what these subjacent deficits might be and identify behavioral biomarkers that canbe associated with them. Based on our finding that the ability tosynchronize in a group setting is correlated with teachers’ perception of the attentional characteristics of a child, we pose thatthis ability can be one such biomarker. Further, this ability can bemeasured as it evolves in the context of a regular music class.Synchronizing with others in a group music class context, asidefrom temporal processing and integration, also involves selective listening. Participants must be able to identify and focus onFrontiers in Psychology Educational PsychologyGroup rhythmic synchrony and attention in childrenthe target beat played by the leader. We attempted to minimizethis by providing the teacher with an instrument that was significantly louder than, and had a very different timber than, theparticipants’ instruments. In the future, it would be of interest toconduct a similar study that compares participants’ synchrony ingroup and individual conditions and also includes a cognitive taskfor selective listening.It could be argued that the observed correlation betweenrhythmic synchrony and SWAN ratings exists merely because, aswith any cognitive task, those with poorer attention are less likelyto be engaged. VS analysis (see Materials and methods) minimizesthis effect because if a subject disengages completely (i.e., stopsplaying the instrument) the VS score re
Layne Kalbfleisch, George Mason University, USA. Reviewed by: Layne Kalbfleisch, George Mason University, USA Jie Zhang, The College at Brockport State University of New York, USA *Correspondence: Alexander K. Khalil, Department of Cognitive Science, University of California, San Diego 9500 Gilman Drive, La Jolla, CA 92093-0515, USA e-mail .