Transcription
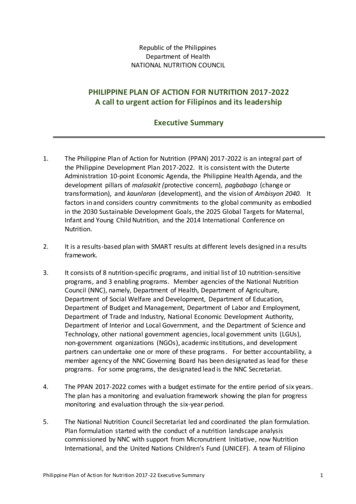
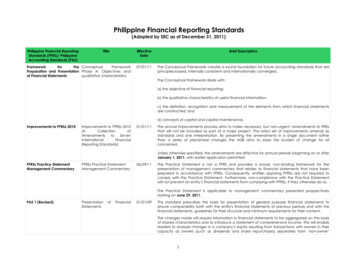
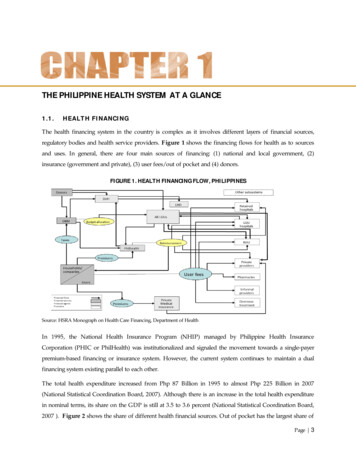
THE PHILIPPINE HEALTH SYSTEM AT A GLANCE1.1.HEALTH FINANCINGThe health financing system in the country is complex as it involves different layers of financial sources,regulatory bodies and health service providers. Figure 1 shows the financing flows for health as to sourcesand uses. In general, there are four main sources of financing: (1) national and local government, (2)insurance (government and private), (3) user fees/out of pocket and (4) donors.FIGURE 1. HEALTH FINANCING FLOW, PHILIPPINESSource: HSRA Monograph on Health Care Financing, Department of HealthIn 1995, the National Health Insurance Program (NHIP) managed by Philippine Health InsuranceCorporation (PHIC or PhilHealth) was institutionalized and signaled the movement towards a single-payerpremium-based financing or insurance system. However, the current system continues to maintain a dualfinancing system existing parallel to each other.The total health expenditure increased from Php 87 Billion in 1995 to almost Php 225 Billion in 2007(National Statistical Coordination Board, 2007). Although there is an increase in the total health expenditurein nominal terms, its share on the GDP is still at 3.5 to 3.6 percent (National Statistical Coordination Board,2007 ). Figure 2 shows the share of different health financial sources. Out of pocket has the largest share ofPage 3
the total health expenditure. Despite the safety nets like NHIP, the share of out of pocket expenditureincreased from 47 percent in 1997 to 57 percent in 2007 (National Statistical Coordination Board, 2007 ). Theshare of local and national government subsidy also decreased on the same period.FIGURE 2. TOTAL HEALTH EXPENDITURE BY SOURCE, PHILIPPINES, 1997 AND 200719972007Source: Philippine National Health Accounts, NSCBThe high level of out of pocket may lead to financial catastrophe and impoverishment. Table 2 validates thelarge contribution of out of pocket during healthcare seeking episodes. Majority of patients from both publicand private utilize out of pocket during confinement but it is significantly higher among patients confined inpublic facilities. Despite the presence of safety nets, donations (from philanthropists and charityorganizations) would still count as one of the major sources of financing (Lavado and Ulep, 2011).TABLE 2. SOURCE OF FINANCING DURING INPATIENT VISITS, PHILIPPINES, 2008Sources of SS/GSISHMOOthersConfined in Private Hospitals(%)4817371751460.82Confined in Public Facilities(%)5123322324210.32Source: Raw data from National Demographic and Health Survey, NSO 2008Looking at the components of out-of-pocket by quintile, more than half of the medical expenditure was spenton medicine. However, share of medicine on the total medical expenditure was consistently higher among thepoor compared to their richer counterparts. Expenditure on contraceptives was also higher among the poorhousehold (Lavado and Ulep, 2011).Page 4
TABLE 3.DISTRIBUTION OF OUT-OF–POCKET EXPENDITURE BY COMPONENTS AND BY SOCIOECONOMIC STATUS, IN PERCENT, PHILIPPINES. ospital Charges1.82.12.22.17.26.76.97.04.44.44.64.7Medical and Other Medical ther Medical .65.41.92.7Food SupplementSource: Raw data Family Income and Expenditure Surveys, 2000-20091.2.HEALTH CARE DELIVERY SYSTEMThe Philippine health care system has rapidly evolved with many challenges through time. Health servicedelivery was devolved to the Local Government Units (LGUs) in 1991, and for many reasons, it has notcompletely surmounted the fragmentation issue. Health human resource struggles with the problems ofunderemployment, scarcity and skewed distribution. There is a strong involvement of the private sectorcomprising 50% of the health system but regulatory functions of the government have yet to be fullymaximized.1.2.1. Health FacilitiesHealth facilities in the Philippines include government hospitals, private hospitals and primary health carefacilities. Hospitals are classified based on ownership as public or private hospitals. In the Philippines,around 40 percent of hospitals are public (Department of Health, 2009). Out of 721 public hospitals, 70 aremanaged by the DOH while the remaining hospitals are managed by LGUs and other national governmentagencies (Department of Health, 2009). Both public and private hospitals can also be classified by theservice capability (see DOH AO 2005-0029). A new classification and licensing system will soon beadopted to respond to the capacity gaps of existing health facilities in all levels. At present, Level-1hospitals account for almost 56 percent of the total number of hospitals (Department of Health, 2009;Lavado, 2010) which have very limited capacity, comparable only to infirmaries.Page 5
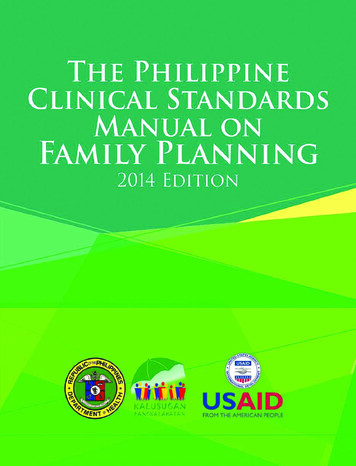
FIGURE 3. NUMBER OF HOSPITALS BY CLASSIFICATIONAND OWNERSHIP, PHILIPPINES, 2009Figure 3 shows that the private120070183Number10008005038600hospitals in all categories. The disparityis more noticeable in tertiary hospitals405271400hospitals outnumbered the governmentwhere the number of private hospitals isfour times that of the government200362417GovernmentPrivate0Level 1Level 2Level 3hospitals.Level 4Source of Raw Data: List of Hospitals and Other Facilities, BHFS-DOHFigure 4 shows the distribution of hospitals by level. Levels 1 and 2 hospitals are relatively well-distributedacross the country (though there are few provinces with limited level 2). However, hospitals with higherservice capabilities are highly concentrated in Region 3 and National Capital Region (NCR) (Lavado, 2010)FIGURE 4. DISTRIBUTION OF HOSPITALS BY LEVEL AND GEOGRAPHICAL DISTRIBUTION,PHILIPPINES, 2009Level 1Level 2Level 3Level 4Source of Raw Data: List of Hospitals and Other Facilities, BHFS-DOHThe number of hospital beds is also a good indicator of health service availability.Per WHOrecommendation, there should be 20 hospital beds per 10,000 population. Table 4 describes thePage 6
distribution of private and public hospital beds by region. Almost all regions have insufficient beds relativeto the population except for NCR, Northern Mindanao, Southern Mindanao and CAR. Among theseventeen regions, Autonomous Region for Muslim Mindanao (ARMM) has the lowest bed to populationratio (0.17 beds per 1000 population), far lower than the national average.TABLE 4. NUMBER OF BEDS AND RATE PER 1000 POPULATION BY REGION, PHILIPPINES, 2008RegionIlocos RegionCagayan ValleyCentral LuzonRegion IV-A (CALABARZON)Region IV-B (MIMAROPA)Bicol RegionWestern VisayasCentral VisayasEastern VisayasZamboanga PeninsulaNorthern MindanaoSouthern MindanaoCentral MindanaoNCRCARARMMCARAGAPhilippinesNumber of 803680277792472586171894199Rate per 1000 1.161.080.942.471.520.170.701.04Source: Department of Health1.2.2. Health Human ResourceThe health human resources are the main drivers of the health care system and are essential for the efficientmanagement and operation of the public health system. They are the health educators and providers ofhealth services. The Philippines has a huge human reservoir for health (see Table 5). However, they areunevenly distributed in the country. Most are concentrated in urban areas such as Metro Manila and othercities.Page 7
TABLE 5. NUMBER OF GOVERNMENT HEALTH WORKERS, PHILIPPINES, 2008Number of Government Health 878507615Source: Department of Health1.2.3. Utilization of Health FacilitiesIn the 2008 National Demographic and Health Survey (NDHS), 50 percent of the clients who soughtmedical advice or treatment consulted public health facilities, 42 percent went to private health facilities,and almost 7 percent sought alternative or traditional health care. Rural Health Units (RHUs) and BarangayHealth Centers (33 percent) were the most visited health facilities in almost all the regions except for NCRand CAR, where most of the clients visited private hospital/clinic for medical advice or treatment. Themost common reasons for seeking health care were illness or injury (68 percent), medical checkup (28percent), dental care (2 percent), and medical requirement (1 percent) (NSO, 2008). With regard to childdelivery, more than thirty-six percent of infants are still delivered by hilots despite aggressive efforts of theDepartment of Health to promote facility-based delivery (National Statistics Office, 2008).The hospital sector in the Philippines is highly segmented in nature. Utilization of hospitals may be drivenby PhilHealth insurance coverage and socio-economic determinants as shown in Table 6. People withPhilHealth insurance are more likely to be confined in a private hospital (56 percent), than those withoutPhilhealth insurance (28 percent). Similarly, patients living in urban area (52 percent) and belonging to therichest quintile (74 percent) are also more likely to be confined in private hospitals (Lavado et al., 2010).Page 8
TABLE 6. PROPORTION OF POPULATION WHO SOUGHT INPATIENT CARE BY FACILITY AND SELECTEDVARIABLES, PHILIPPINES, 2008CharacteristicsCategoryPhilHealth coverage CoveredNot coveredType of residenceWealth Type of facility confinedPrivate hospitals (%) Public Hospitals (%) Clinics .8Source: Calculated based on the National Demographic and Health Survey, 2008Available data shows that on the average, travel time to a health facility is 39 minutes; where travel time islongest in ARMM (83 minutes) and shortest in NCR and Northern Mindanao, (28 minutes). Travel time isrelatively longer in rural areas (45 minutes) than in urban areas (32 minutes); and longest for persons in thelowest wealth quintile (47 minutes) and shortest for those in the highest wealth quintile (35 minutes). Olderpersons seeking care (60 years old) have longer average travel times than younger persons (NationalStatistics Office, 2008)1.2.4. Satisfaction with Health FacilitiesBased on a survey by the Social Weather Station in 2006, majority of Filipinos specifically the low incomehouseholds prefer to seek treatment in a government hospital if a family member needs confinement.Affordability is the main reason for going to a government medical facility, while excellent service is themain reason for going to a private medical facility (Department of Health, 2010).The net satisfaction with services given by government hospitals has slightly improved from 30 in 2005 to 37 in 2006. Excellent service and affordability are the main reasons for being satisfied whereas poorservice is the main reason for being dissatisfied with the services given by government hospitals (SocialWeather Stations, 2006).Page 9
1.3.HEALTH OUTCOMES1.3.1. Life ExpectancyThe projected average life expectancy of Filipinos in 2005 to 2010 is 68.8 years, with males having anaverage life expectancy of 66.11 years and females with 71.64 years (National Statistics Office, 2010). It isprojected that the average life expectancy of Filipinos will increase to 70.38 years from 2010 to 2015 and71.59 years from 2015 to 2020 (National Statistics Office).Table 7 provides the data on projected lifeexpectancy at birth.TABLE 7.PROJECTED LIFE EXPECTANCY AT BIRTH BY SEX AT FIVE CALENDAR-YEAR INTERVALS,PHILIPPINES, 2000 TO 2040 (MEDIUM ASSUMPTION)YearMaleFemaleMean life .68Source: 2000 Census-based Population Projection*Calculated using National Statistics Office data1.3.2. Deaths and BirthsFIGURE 5. CRUDE DEATH RATE, PHILIPPINES, 2000 AND 2010Deaths and births are commonlyhealth and fertility dynamics of anarea. The crude death rate (CDR) hasbeen declining since the 1960s.However, no significant change hasbeen noted since 2000-2009. Thenumber of deaths in a particularpopulation is influenced by variousdeaths per 100,000 populationmeasured to determine the status nvironmental5.66MaleFemaleSource: National Statistics Office, 2010experience suggests that decreasingCDR is a result of decreasing cases of infectious diseases, improvement of perinatal practices andinnovative health interventions (National Statistics Office, 2009).Page 10
Seven of the ten leading causes of death are non-communicable in etiology as shown in Table 8. Cardiovascular diseases (i.e. diseases of the heart, and cerebrovascular diseases), cancers, chronic obstructivepulmonary disease and diabetes are the leading non-communicable diseases. The lingering problems oninfectious diseases like pneumonia and tuberculosis are still evident as they ranked 4th and 5th leading causesof death (National Statistics Office, 2009).TABLE 8. TOP TEN CAUSES OF DEATHS, PHILIPPINES, 2009DiseasesDiseases of the heartCerebro-vascular diseasesMalignant , Nephrotic syndromeAssaultCertain conditions arising from perinatal periodNumber of deathsPercentage urce: National Statistics Office, 2009Infant and maternal mortality are the most useful indicators since they reflect the general condition of thehealth system. Table 9 shows the decreasing trend in Infant Mortality Rate (IMR) over the last decade. Itdropped from 57 infant deaths per 1000 live births in 1990 to 25 infant deaths per 1000 live births in 2008(National Statistics Office, 2008). However, disaggregating IMR by socio-economic quintiles and regionsreveals performance disparities. Figure 6 shows that the IMR of the poorest quintile in 2008 is similar tothe national IMR two decades ago. Regional comparison also depicts wide variations which can beconsistently observed since early 1990s.TABLE 9. CHILD MORTALITY RATE, PHILIPPINES, 1990-2008Year19901993199820032008Neonatal Mortality17.717.817.016.0Infant Mortality57.033.635.129.025.0Under-Five Mortality80.054.248.440.034.0Source: National Demographic and Health Surveys, NSOPage 11
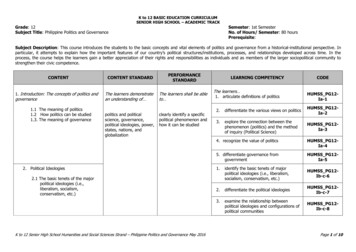
Per 1,000 Live BirthsFIGURE 6. INFANT MORTALITY RATE BY SOCIO-ECONOMICSTATUSAND REGION, PHILIPPINES, 2008454035302520151050WHO defines maternal mortality as40death of a mother while pregnant orwithin 42 days after delivery. Risks2924attributable231560andchildbirth as well as from poor qualityhealth care services make this a strongdeveloping countries, hemorrhage andPoorerMiddleRicherRichesthypertensive disorder are the majorcauses of maternal death. Over theInfant mortality rate by regionpast decade, the decline in theRegion VIIInumber of maternal deaths perARMMInfan t m ortality ra te304050pregnancyindicator for health care status. InPoorest20toRegion IXRegion XIIRegionVIIRegionRegion XIRegion IIRegion VPhilippinesRegion X100,000 live births has sloweddown. Stretching as far back asRegion IRegionRegion IIIVBRegion XIRegion VIICARNCRPhilippinesRegionIXIIRegion IIINCRCARAGARegionRegion IVAVXCARRegionIII10Region IX1993, the National DemographicSurvey(NDHS)estimated 209maternal deaths per 100,000 livebirths which significantly decreasedto 162 in 2006 in the FamilyPlanning Survey (FPS). In 2010, theMMR is estimated to be at 163 per100,000 live births and the estimatefrom the Family Health Survey is1993199820032008still to be determined.YearSource: National Demographic and Health Surveys, NSOBirth rate is a common measure of fertility for a given population. Crude birth rate (CBR) indicates thenumber of live births occurring during the year, per 1,000 population. Over the last decade, there is anoticeable decline in crude birth rate for both genders (Figure 7). Crude birth rate should be analyzed inparallel with more pertinent indictors like total fertility rate. Total fertility rate (TFR) is interpreted as thenumber of births a woman would have, on average, at the end of her reproductive years (National StatisticsOffice, 2008). In the Philippines, a woman is expected to have 3 births (National Statistics Office, 2008).However, when disaggregated by socio-economic status, negative correlation is observed such that as socioPage 12
economic status increases, the TFR decreases (Figure 8). On average, a woman under the poorest quintile islikely to have 5 births while the richest quintile is only likely to have 2 births (National Statistics Office, 2008).FIGURE 7. CRUDE BIRTH RATE BY GENDER, PHILIPPINES, 2000, 2006 AND 2009Birth per 100,000 rce: National Statistics OfficeFIGURE 8. TOTAL FERTILITY RATE BY INCOME QUINTILE, PHILIPPINES, 20086Poorest, 5.2Average number of births5Poor, 4.24Middle, 3.232Rich, 2.7Richest, 1.910Source: National Demographic and Health Survey 2008Page 13
1.3.3.Disease Trends in the PhilippinesThe country’s health profile depicts a distinct epidemiologic and demographic transition characterized bydouble burden of diseases consisting of communicable diseases (which require major public healthintervention) and non-communicable diseases (which need expensive curative and chronic-care intervention).This scenario makes the country’s health profile a “hybrid” or combination of health situations found in bothdeveloped and developing countries. Similar to Sub-Saharan Africa, many regions in the Philippines are stillstruggling to eliminate hunger and infectious diseases while continually battling on non-communicablediseases (NCDs) as experienced in developed countries. The health status of the country therefore can bebest described to be at the crossroads of infectious and non-communicable diseases.1.3.3.1.Communicable diseasesIn the Philippines, eight out of the ten leading causes of morbidity or illness can be attributed toinfectious diseases. Illnesses related to the respiratory system such as acute respiratory infection,pneumonia and bronchitis are the top 3 leading cause of illness as shown in Table 10.TABLE 10.TOP TEN CAUSES OF MORBIDITY, PHILIPPINES, 2010RankDiseaseNumberRate per 100,000population12345678910Acute Respiratory InfectionALRTI and PneumoniaBronchitis/BronchiolitisHypertensionAcute Watery DiarrheaInfluenzaUrinary Tract InfectionTB .0612.6380.7366.3354.5297.791.080.954.938.9Source: Field Health Services Information System, DOHThe country commits to control tuberculosis in response to the Millennium Development Goals (MDGs).Despite the aggressive campaigns initiated by the Department of Health (DOH) in collaboration with donoragencies, tuberculosis remains among the leading causes of morbidity and mortality in the country. HIVcontrol is also one of the country’s commitments to the MDGs. Though HIV prevalence of the country isless than 1 percent, HIV cases are increasing exponentially. Endemic diseases like malaria, schistosomiasisand filariasis are still prevalent in several regions. The country has also experienced cases of re-emerginginfectious diseases, including new and emerging diseases because of various demographic and environmentalfactors.Page 14
1.3.3.2.Non-communicable diseasesNon-communicable diseases (NCDs) are increasing rapidly in the Philippines. In 2009, seven of the tenleading causes of death are non-communicable in etiology. Majority of the NCDs mortality cases (i.ecardio-vascular diseases, cancer, chronic obstructive pulmonary disease and diabetes) as shown in Table11 are considered lifestyle-related. Around 75 percent of the total deaths can be attributed to NCDswhich is similar to the estimates in most developing countries, and 30-50 percent occurred pre-maturely(below 60 years old) (Ulep, 2012). It is noteworthy that over-nutrition is increasing in the country whileunder-nutrition remains a problem especially in rural and poor areas. Table 11 further provides data ondeaths attributed to NCDs by gender without much difference except for accidents and injuries.TABLE 11. DISTRIBUTION OF DEATHS BY CAUSE AND BY GENDER, 2008TotalDisease tious diseases81,82117.7346,46517.2935,35618.34Maternal and child health 103.478,0482.997,9624.13Non-infectious in 34112.2623,70616.61Accidents and 7786.5211,0345.3411,7448.23Chronic lower respiratory diseases21,8706.2615,1887.356,6824.68Chronic liver diseases and 24,05616.857620.22Mental disorderOther diseases that cannot be classified57,28416.39as infectiousSource: PIDS Study on NCDs, 2011, Source of data: NSO 2008Vulnerability factors associatied with lifestyle-related diseases are also now prevalent in the country.Around 5 percent of the population are now considered to be obese, 10 percent are diagnosed withhypercholesterolemia and 24 percent are considered hypertensive. Moreover, most of these lifestylerelated diseases share common risk factors (i.e. unhealthy diet, smoking, sedentary lifestyle and alcoholconsumption). Over the years, there was an observable increase in the consumption of NCD implicatedfood items (i.e. saturated oil, sugar and fast food), and decrease in the consumption of complexcarbohydrates like root crops and vegetables(Ulep, 2012).Tobacco use is considered as one of the commonly shared risk factors of major NCDs like cardiovascular disease, certain cancers and diabetes mellitus. Smoking is also a strong risk factor of chronicobstructive pulmonary disease and asthma. In a recent study using the 2008 NNS data, almost 31 percentPage 15
of the adult population are current smokers and 14 percent used tobacco in the past (Ulep, 2012).Comparing with the GATS in 2009, the prevalence rate is almost close at 28.3%. The prevalence ofsmoking is significantly higher among the poor adults. Alcohol is causally linked in varying degrees tocancers, cardio-vascular diseases, liver disease and pancreatitis. In the country, about a quarter of theadult populations are alcohol drinkers in 2008 (Ulep, 2012). Another study in 2009 indicates that almosthalf of the alcohol drinkers are adults (Department of Health, 2009).Health Reform Initiatives in the PhilippinesHealth reforms in the Philippines build upon the lessons and experiences from the past major health reforminitiatives undertaken in the last 30 years. The adoption of primary health care (PHC) approach in 1979promoted participatory management of the local health care system. The goal was to achieve health for allFilipinos by the year 2000. It emphasized the delivery of eight essential elements of health care, including theprevention and control of prevalent health problems; the promotion of adequate food supply and propernutrition; basic sanitation and adequate supply of water; maternal and child care; immunization; preventionand control of endemic diseases; appropriate treatment and control of common diseases; and provision ofessential drugs. To implement PHC, EO 851 was issued in 1983 integrating public health and hospitalservices (World Health Organization, 2011).The People Power Revolution strengthened the call for legitimate local representation. In early 1990s, RA7160 or the Local Government Code (LGC) transferred the responsibility of health service provision to thelocal government units. The intention of LGC was to establish a more responsive and accountable localgovernment structure. However, this has resulted to fragmentation of administrative control of healthservices between the rural health units and hospitals and between the different levels of political structure(World Health Organization, 2011). Prior to that, the Generics Act was adopted in 1988 to ensure adequatesupply, distribution and use of generics thereby improving access to affordable drugs and medicines.During that time, more than half of the population had no coverage, especially the poor, the self-employedand informal sector workers (World Health Organization, 2011). This led to the enactment of the NationalHealth Insurance Act of 1995 or RA 9875 which aims to provide all citizens a mechanism for financialprotection with priority given to the poor. It created the National Health Insurance Program “which shallprovide health insurance coverage and ensure affordable, acceptable, available and accessible health servicesfor all citizens of the Philippines.”the way health care is delivered, regulated and financed. With a battle cry of “Kalusugan Para sa Masa”, it wasPage 16PHILIPPINE HEALIn 1999, the health sector reform agenda was launched as a major policy framework and strategy to improve
designed to implement the reform package in the convergence sites. The five reform areas are: 1. publichealth; 2. hospital; 3. local health systems; 4. health regulations and 5. health financing (Department ofHealth, 2004). It was during this time that the DOH underwent a major organizational reform to pursue itsnew role as a result of the devolution. At the local level, the municipalities were joined together to form interlocal health zones (ILHZs) to optimize sharing of resources and maximize joint benefits from local healthinitiatives.The operational framework of health sector reforms was adopted in 2005 and was called FOURmula One forHealth (F1). The objective was to undertake critical reforms with speed, precision and effective coordinationdirected at improving the efficiency, effectiveness and equity of the Philippine health system in a manner thatis felt by the Filipinos especially the poor. The F1 organized health reform initiatives into fourimplementation components, namely: financing, regulation, service delivery and governance (DOHAO 20050023). This time also marked the enactment of two pieces of legislation: the Universally Accessible Cheaperand Quality Medicines Act of 2008 and the Food and Drug Administration Act of 2009.However, despite the important progress made, successive reforms have not succeeded in adequatelyaddressing the persistent problem of inequity.Page 17
TABLE 3.DISTRIBUTION OF OUT-OF-POCKET EXPENDITURE BY COMPONENTS AND BY SOCIO-ECONOMIC STATUS, IN PERCENT, PHILIPPINES. 2000-2009 Components Poorest Richest Philippines 2000 2003 2006 2009 2000 2003 2006 2009 2000 2003 2006 2009 Medicines 74.2 75.0 73.5 74.7 59.5 59.7 59.1 57.2 67.6 66.6 66.6 65.7