Transcription
2023 COASTAL MASTER PLANDETERMININGSUBSIDENCE RATES FORUSE IN PREDICTIVEMODELINGREPORT: VERSION 01DATE: MARCH 2021PREPARED BY: CATHERINE FITZPATRICK, KRISTA L. JANKOWSKI, AND DENISEREEDCOASTAL PROTECTION ANDRESTORATION AUTHORITY150 TERRACE AVENUEBATON ROUGE, LA 70802WWW.COASTAL.LA.GOV
COASTAL PROTECTION ANDRESTORATION AUTHORITYThis document was developed in support of the 2023 Coastal Master Plan being prepared by theCoastal Protection and Restoration Authority (CPRA). CPRA was established by the LouisianaLegislature in response to Hurricanes Katrina and Rita through Act 8 of the First Extraordinary Sessionof 2005. Act 8 of the First Extraordinary Session of 2005 expanded the membership, duties, andresponsibilities of CPRA and charged the new authority to develop and implement a comprehensivecoastal protection plan, consisting of a master plan (revised every six years) and annual plans. CPRA’smandate is to develop, implement, and enforce a comprehensive coastal protection and restorationmaster plan.CITATIONFitzpatrick, C., Jankowski, K.L., & Reed, D. (2020). 2023 Coastal Master Plan: DeterminingSubsidence Rates for Use in Predictive Modeling. Version I. (p. 70). Baton Rouge, Louisiana: CoastalProtection and Restoration Authority.2023 COASTAL MASTER PLAN. Determining Subsidence Rates for Use inPredictive Modeling2
ACKNOWLEDGEMENTSThis document was developed as part of broader plans for model improvement in support of the 2023Coastal Master Plan under the guidance of the Modeling Decision Team (MDT): Coastal Protection and Restoration Authority (CPRA) of Louisiana – Elizabeth Jarrell,Stuart Brown, Ashley Cobb, Catherine Fitzpatrick, Krista Jankowski, David Lindquist,Sam Martin, and Eric WhiteUniversity of New Orleans – Denise ReedThe following Coastal Protection and Restoration Authority (CPRA) staff provided guidance and reviewof this document: Stuart BrownElizabeth JarrellEric WhiteSyed KhalilLeigh Anne SharpeTommy McGinnisAngelina FreemanJames PahlRick RaynieDarin LeeThe following experts provided external review for a previous draft version of this document and theircontributions were important to shaping the approach presented here: Mead Allison, Tulane UniversityMichael Blum, University of KansasCathleen Jones, Jet Propulsion LaboratoryMark Kulp, University of New OrleansJohn Rybczyk, Western Washington UniversityCarol Wilson, Louisiana State University2023 COASTAL MASTER PLAN. Determining Subsidence Rates for Use inPredictive Modeling3
EXECUTIVE SUMMARYTo develop the 2023 Coastal Master Plan, the Louisiana Coastal Protection and Restoration Authority(CPRA) and partners are implementing updates to several predictive models developed throughprevious master plan efforts. The Integrated Compartment Model (ICM), Storm Surge and Wavesmodels (ADCIRC and SWAN), and Coastal Louisiana Risk Assessment model (CLARA) are used tounderstand future landscape change and changing vulnerability under various future environmentalscenarios. In the master plan process, one goal of modeling landscape change and storm surge-basedflood risk is to explore the effects of different possible future conditions on the performance ofrestoration and protection projects and inform decision-making processes. A second goal is to allowfor communication with coastal residents about possible future coastal conditions. Model inputs, suchas the current landscape and existing hydrologic connections, provide a starting point for thesepredictive models. One model input that is of particular importance (due to the sensitivity of the ICM toits influence) is the rate of subsidence across coastal Louisiana. The ICM uses subsidence to lower theland surface, while additional components of the model separately account for surface sedimentdeposition and wetland soil development, both of which can offset the effects of subsidence onsurface elevation. Subsidence is also applied in risk modeling using CLARA.Refining subsidence rates for use as model inputs for the ICM is an important part of updatingpredictive models for the 2023 Coastal Master Plan. Recently published studies provide newinformation on subsidence rates in coastal Louisiana. These include small and large-scaleobservational studies, as well as data re-analyses and data syntheses. This report providesbackground information related to considerations of subsidence in predictive modeling, includingintroducing the factors that influence subsidence rates across coastal Louisiana, describing howsubsidence rates were considered in the 2012 and 2017 Coastal Master Plans, and brieflysummarizing recent literature available to support determination of updated subsidence rates. Thereport then details the approach to determine subsidence rates across Louisiana’s coastal zone foruse in predictive modeling for the 2023 Coastal Master Plan.The 2023 subsidence approach relies on the development of several subsidence maps for coastalLouisiana. The first is a deep subsidence (DS) map derived from data from geodetic surveybenchmarks, both primary (Continuously Operating Reference Stations or CORS) and secondary(CPRA/National Geodetic Survey (NGS) benchmarks). The resulting map shows variation in DS ratesacross the coast, with broad spatial patterns related to underlying geology and past depositionalprocesses. The Chenier Plain in western Louisiana largely shows low DS rates that range from 0 to 1.5mm/yr. Rates less than 2.5 mm/yr are also found on the North Shore of Lake Pontchartrain and areaseast of New Orleans. Along the gulf coast, rates of 5-6 mm/yr are shown in the Teche-Vermilion basin.For much of the Mississippi River delta plain, DS rates range from 4 mm/yr to 12 mm/yr. Higher DSrates occur in the lower basins that are underlain by some of the thickest Holocene sedimentpackages, with rates up to 14.8 mm/yr throughout lower Terrebonne Basin, and up to 7 mm/yr in2023 COASTAL MASTER PLAN. Determining Subsidence Rates for Use inPredictive Modeling4
lower Barataria Basin and parts of outer Pontchartrain and Breton Sound Basin. The highest DS ratesof up to 16.8 mm/yr occur in the Bird’s Foot Delta.In addition, two shallow subsidence (SS) maps were created using data derived from the most up-todate rod surface elevation table-marker horizon (RSET-MH) measurements taken at CoastwideReference Monitoring System (CRMS) sites. CRMS-derived SS rates were aggregated by ICMecoregions (i.e., at a sub-regional scale). For each ICM ecoregion, first quartile and median SS valueswere calculated. Two maps were created due to variability in the SS data and these will be appliedseparately for two environmental scenarios in the master plan analysis. Ecoregion SS values using firstquartile values range from negative values (-0.6 mm/yr) in Sabine to 5.8 mm/yr in southeastBarataria. When median values are used, SS rates range from 1.0 mm/yr in the Calcasieu ecoregionto 7.3 mm/yr in the Bird’s Foot Delta. As the SS maps are derived from CRMS data, no SS rates arecalculated for the Atchafalaya Basin and the Verret Basin.Total subsidence (TS) rates (i.e., the sum of SS and DS) are determined by creating composite maps.As there are two SS maps, two maps for TS result – one representing a lower total subsidence ratescenario and the other a higher subsidence rate scenario. These maps can be combined with otherinformation (e.g., sea level rise rates), in environmental scenarios used to drive future conditions formodel simulations. In general, the highest rates of total subsidence are in the Bird’s Foot Delta ( 18mm/yr in both lower and higher scenarios) with slightly lower rates in central Terrebonne and near theAtchafalaya and Wax Lake Deltas (8-16 mm/yr). Lowest rates are in the western Chenier Plain and theNorth Shore of Lake Pontchartrain, 4 mm/yr and 6 mm/yr for the lower and higher scenariosrespectively). This report discusses the expert panel-based approach used in the 2012 and 2017Coastal Master Plans and the details of the approach used for the 2023 Coastal Master Plan,including the assumptions and limitations of the 2023 approach and the consistency of derived rateswith recent studies.2023 COASTAL MASTER PLAN. Determining Subsidence Rates for Use inPredictive Modeling5
TABLE OF CONTENTSCOASTAL PROTECTION AND RESTORATION AUTHORITY . 2CITATION . 2ACKNOWLEDGEMENTS. 3EXECUTIVE SUMMARY . 4TABLE OF CONTENTS . 6LIST OF TABLES. 8LIST OF FIGURES . 8LIST OF ABBREVIATIONS . 91.0 INTRODUCTION.101.1 Purpose of Defining Subsidence Rates for Use in the 2023 Coastal Master Plan . 101.2 Subsidence in Coastal Louisiana: Contributing Processes and Measurement Approaches. 112.0 PREVIOUS MASTER PLANS .152.1 Subsidence in the 2012 Coastal Master Plan . 152.2 Subsidence in the 2017 Coastal Master Plan . 173.0 NEW INFORMATION ON SUBSIDENCE RATES SINCE THE 2017 COASTAL MASTERPLAN .184.0 SUBSIDENCE APPROACH FOR THE 2023 COASTAL MASTER PLAN .224.1 Approach . 224.2 Assumptions and Limitations . 235.0 DEVELOPMENT OF A DEEP SUBSIDENCE MAP FOR COASTAL LOUISIANA .265.1 Deep Subsidence Data . 265.2 Determining Deep Subsidence rates . 275.3 Spatial Application of Deep Subsidence . 285.4 Assumptions and Limitations of Deep Subsidence Approach . 306.0 DEVELOPMENT OF A SHALLOW SUBSIDENCE MAP FOR COASTAL LOUISIANA .326.1 Shallow Subsidence Data . 326.2 Determining Shallow Subsidence Rates . 326.3 Spatial Application of Shallow Subsidence . 356.4 Assumptions and Limitations of Shallow Subsidence Approach . 397.0 SUMMARY.402023 COASTAL MASTER PLAN. Determining Subsidence Rates for Use inPredictive Modeling6
7.1 Deep Subsidence Patterns . 407.2 Shallow Subsidence Patterns . 407.3 Total Subsidence Rates . 418.0 REFERENCES .45APPENDICES .52APPENDIX A: COMMON APPROACHES TO SUBSIDENCE MEASUREMENT .53APPENDIX B: SUPPLEMENTAL INFORMATION FOR SUBSIDENCE MAP DEVELOPMENT.562023 COASTAL MASTER PLAN. Determining Subsidence Rates for Use inPredictive Modeling7
LIST OF TABLESTable 1. General description of processes contributing to subsidence in coastalLouisiana. .11Table 2. Summary of information on subsidence rates from recent studies of coastalLouisiana. .19Table 3. Plot Set Sampling Years. .33Table 4. Aggregated shallow subsidence statistics and values by ecoregion. .36LIST OF FIGURESFigure 1. Temporal and spatial scales of the different processes contributing tosubsidence. .13Figure 2. Temporal and spatial scales of various subsidence measurementtechniques. .14Figure 3. Previously used plausible subsidence rate ranges for coastal Louisiana. .16Figure 4. Representation of measurements used to develop subsidence rates for the2023 Coastal Master Plan. .23Figure 5. Potential overlap of DS and SS in meters developed through surfacedifferencing. .25Figure 6. Coastwide deep subsidence point data, including the source for benchmarkanalysis. .27Figure 7. Deep subsidence map of coastal Louisiana. .29Figure 8. Shallow subsidence RSET-MH point data from 203 CRMS sites. .34Figure 9. Map of 25 ecoregions defined for the 2023 Coastal Master Plan. .35Figure 10. First quartile of shallow subsidence rate point data aggregated byecoregion across coastal Louisiana. .37Figure 11. Median of shallow subsidence rate point data aggregated by ecoregionacross coastal Louisiana. .38Figure 12. Coastwide map of total subsidence rates for the lower scenario. .42Figure 13. Coastwide map of total subsidence rates for the higher scenario. .432023 COASTAL MASTER PLAN. Determining Subsidence Rates for Use inPredictive Modeling8
LIST OF ABBREVIATIONSACRE. APPLIED COASTAL RESEARCH AND ENGINEERINGADCIRC . ADVANCED CIRCULATION MODELCLARA . COASTAL LOUISIANA RISK ASSESSMENTCORS . CONTINUOUSLY OPERATING REFERENCE STATIONCPRA. COASTAL PROTECTION AND RESTORATION AUTHORITYCRMS . COASTWIDE REFERENCE MONITORING SYSTEMDS .DEEP SUBSIDENCEGIA . GLACIO-ISOSTATIC ADJUSTMENTGPS . GLOBAL POSITIONING SYSTEMHUC-12 . HYDROLOGIC UNIT CODE 12ICM. INTEGRATED COMPARTMENT MODELINSAR . INTERFEROMETRIC SYNTHETIC APERTURE RADARNGS . NATIONAL GEODETIC SURVEYMH. MARKER HORIZONRMSE . ROOT MEAN SQUARE ERRORRSET . ROD SURFACE ELEVATION TABLESEC . SURFACE ELEVATION CHANGESS . SHALLOW SUBSIDENCESWAN . SIMULATING WAVES NEARSHORE MODELTS . TOTAL SUBSIDENCEVA . VERTICAL ACCRETION2023 COASTAL MASTER PLAN. Determining Subsidence Rates for Use inPredictive Modeling9
1.0 INTRODUCTION1.1 PURPOSE OF DEFINING SUBSIDENCE RATES FOR USE IN THE2023 COASTAL MASTER PLANSubsidence is the gradual or sudden lowering of the land surface over time. It has long beenrecognized as a key driver of coastal change in Louisiana (e.g., Gagliano et al., 2003; Roberts et al.,1994) due to the direct impact of subsidence on landscape change and its contribution to relative sealevel rise rates. Predictive modeling of future coastal conditions has been undertaken by the state ofLouisiana to select coastal protection and restoration projects that address changing conditions andanticipated environmental challenges. The analytical approach used in master plan development andproject selection (CPRA, 2017; Peyronnin et al., 2013) allows for landscape change and storm surgebased flood risk to be responsive to changing land elevations based on predicted futureenvironmental conditions. Landscape change predictions are developed using the ICM (White et al.,2019; White et al., 2017), which simulates long-term hydrology, wetland morphology, and vegetationand barrier shorelines and dynamics for the Louisiana coast across a variety of environmentalconditions. Landscape conditions from the ICM are passed to storm surge and waves models (Cobellet al., 2013), which are used to assess the effects of coastal storms on storm surge-based flood riskand damages (Fischbach et al., 2017). The storm surge (ADCIRC), wave (SWAN), and damage (CLARA)models also consider the effectiveness of structural protection projects and risk reduction projects(i.e., elevations, floodproofing, and voluntary acquisition of structures) on expected annual damages.Assumed rates of future subsidence are required to drive these analyses because subsidence resultsin an annual lowering of the modelled landscape as well as any restoration/risk reduction features(e.g., levees) superimposed on that landscape. ICM landscape change projections have been shown tobe particularly sensitive to this model input (Meselhe et al., 2017b). Given the importance ofsubsidence to the changing landscape and future risk, the question of what rates to use tocharacterize subsidence across coastal Louisiana is a consequential consideration. Previous masterplan efforts have considered the effects of subsidence on future environmental conditions and projectoutcomes, though subsidence rates used as model inputs for the ICM were based on expertjudgement rather than being explicitly data-driven, which potentially contributed additional uncertaintyto future outcomes.This report describes the approach used to determine subsidence rates across coastal Louisiana tosupport predictive modeling for the 2023 Coastal Master Plan. The report introduces the factors (i.e.,geologic and geomorphic processes) that influence subsidence rates across the coast, describes howsubsidence rates were determined for the 2012 and 2017 Coastal Master Plans, and brieflysummarizes recent literature on subsidence rates in coastal Louisiana. It then details the approachused to determine subsidence rates for use in predictive modeling for the 2023 Coastal Master Plan.2023 COASTAL MASTER PLAN. Determining Subsidence Rates for Use inPredictive Modeling10
1.2 SUBSIDENCE IN COASTAL LOUISIANA: CONTRIBUTINGPROCESSES AND MEASUREMENT APPROACHESThere is broad scientific agreement that an array of factors contribute to subsidence in coastalLouisiana. Yuill et al. (2009) provide an overview of the contributing processes and their relevance tocoastal Louisiana, and these factors are also noted by more recent reviews (e.g., Frederick et al.,2019; Higgins, 2016). Table 1 provides an overview of contributing processes.Table 1. General description of processes contributing to subsidence in coastalLouisiana (after Yuill et al., 2009).PROCESSGENERAL DESCRIPTIONTectonicSubsidenceTECTONIC PROCESSES (I.E., PROCESSES RELATING TO THE STRUCTURE ANDEVOLUTION OF THE LITHOSPHERE) INCLUDING NATURAL FAULT PROCESSES SUCH ASGULF OF MEXICO BASIN DEVELOPMENT, SHELF-EDGE GROWTH FAULTING, AND SALTMOVEMENT (I.E., HALOKINESIS).HoloceneSedimentCompactionLARGE QUANTITIES OF RIVERINE SEDIMENT, AS WELL AS DETRITAL ANDALLOCHTHONOUS ORGANIC MATTER, HAVE BEEN DEPOSITED WITHIN THEMISSISSIPPI RIVER DELTA WHERE IT NATURALLY COMPRESSES AND CONSOLIDATESOVER TIME. THE PHYSICAL COMPACTION OF DEPOSITED SEDIMENT IS INFLUENCEDBY THE PROPERTIES OF THE SEDIMENT GRAINS, THE VOLUME OF WATER WITHINTHE SEDIMENT, AND THE OVERBURDEN PRESSURE. BIOLOGICAL (E.G., MICROBIALDECAY OF ORGANIC MATERIAL) AND CHEMICAL (E.G., OXIDATION OF ORGANICCARBON) PROCESSES CONTRIBUTE TO THE NET EFFECT OF PHYSICAL SEDIMENTCOMPACTION THAT PRODUCES SUBSIDENCE, ESPECIALLY IN SOIL CONTAININGSIGNIFICANT AMOUNTS OF PEAT AND OTHER ORGANIC MATTER.SedimentLoadingACCUMULATION OF RIVERINE SEDIMENT IN THE MISSISSIPPI RIVER DELTA REGIONDURING THE HOLOCENE INDUCED SUBSIDENCE DUE TO FLEXURE WITHIN THEUNDERLYING LITHOSPHERE (I.E., THE CRUST AND UPPER MANTLE). THIS REFERS TOSUBSIDENCE IN THE MATERIAL UNDERLYING A SEDIMENT LOAD RATHER THANWITHIN THE VERTICAL STACK OF MATERIAL CONSTITUTING THE SEDIMENTARY LOAD.GlacialIsostaticAdjustment(GIA)THE LAURENTIDE ICE SHEET THAT EXISTED DURING THE LAST ICE AGE CAUSEDCRUSTAL FLEXURE AND SUBSIDENCE. OUTSIDE THE MARGINS OF THE ICE SHEET(E.G., COASTAL LOUISIANA), ISOSTATIC COMPENSATION CAUSED LOCAL UPLIFT ANDTHE CREATION OF A FOREBULGE. ICE SHEET RETREAT DURING THE HOLOCENE HASLED TO GRADUAL SUBSIDENCE ALONG THE FOREBULGE. FOREBULGE COLLAPSEOCCURS AT A GEOLOGIC (MILLENNIAL) TIME SCALE. WHILE THE TIMING OF THECOLLAPSE IS DEPENDENT ON THE RATE OF ICE SHEET UNLOADING, THE NATURE OFTHE UNDERLYING MANTLE (I.E., THE MANTLE VISCOSITY AND THICKNESS)PRODUCES A SUBSTANTIAL LAG BETWEEN THE TWO.2023 COASTAL MASTER PLAN. Determining Subsidence Rates for Use inPredictive Modeling11
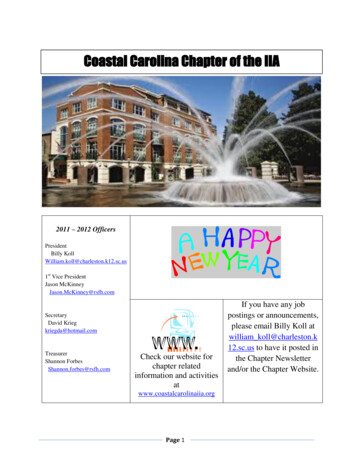
PROCESSGENERAL DESCRIPTIONFluidWithdrawalAREAS EXPERIENCING WATER AND HYDROCARBON WITHDRAWAL FROMSUBSURFACE RESERVOIRS HAVE BEEN SPATIALLY CORRELATED TO GRADIENTS OFSUBSIDENCE IN SOUTHERN LOUISIANA. FLUID WITHDRAWAL INDUCES A LOSS OFSUBSURFACE PORE PRESSURE WITHIN THE RESERVOIR RESULTING IN LOCALSEDIMENT COMPACTION, USUALLY IN A ROUGHLY CIRCULAR AREA AROUND THEWITHDRAWAL POINT. REACTIVATION OF FAULT SLIP WITHIN THE NEARBY FAULTZONES THAT ARE OFTEN ASSOCIATED WITH UNDERGROUND FLUID RESERVOIRSCOULD ALSO BE A CONTRIBUTING FACTOR.Surface WaterDrainage andManagementCHANGES IN SURFACE WATER STORAGE AND DRAINAGE PATTERNS INFLUENCESUBSIDENCE RATES BY ALTERING GRADIENTS OF SOIL MOISTURE. ANTHROPOGENICMANIPULATION OF THE REGIONAL HYDROLOGY HAS DRASTICALLY ALTERED THEMAGNITUDE AND PATH OF BOTH SURFACE AND SUBSURFACE RUNOFF. DEWATERINGOF FORMALLY INUNDATED SOIL INITIATES SEDIMENT CONSOLIDATION AND THEOXIDATION OF SOIL ORGANICS, WHICH REDUCES SOIL VOLUME.The spatial and temporal scales at which each process influences subsidence can vary (Figure 1). Thetime scale for analysis in the master plan is 50 years into the future and the spatial scale is coastwide,demonstrating the challenge of considering individual subsidence processes in the analysis. Further,as described by Yuill et al., (2009), subsidence will affect each restoration and risk project differentlydependent on the project’s life expectancy and footprint. These temporal and spatial scales and theirlocation within the coastal landscape determine how susceptible different projects, and thus thecombination of projects included in the master plan, are to the effects of subsidence.2023 COASTAL MASTER PLAN. Determining Subsidence Rates for Use inPredictive Modeling12
Figure 1. Temporal and spatial scales of the different processes contributing tosubsidence. Time scales: instantaneous 0-1 year, management 1-20 years,Anthropocene 20-400 years (for Louisiana), and geologic 400 years(modified from Yuill et al., 2009).Contemporary subsidence research employs a wide range of measurement and analytical methodswhich measure subsidence at different spatial and temporal scales. Commonly used measurementtechniques are summarized in Appendix A, Table A1. Each method has its own set of assumptions,levels of precision, and uncertainty. In addition, understanding the range of spatial and temporalscales of various measurement approaches helps identify which subsidence processes are beingincluded within the measurements (Table 1; Figure 1).Many of the techniques described in Appendix A, Table A1 produce point measurements ofsubsidence which can limit the utility of the data for purposes such as the development of maps tosupport master plan analyses. The use of point measurements to infer subsidence rates acrossbroader areas depends on the availability of integrated, complementary data networks (e.g., sedimentcores, instruments, or survey benchmarks), as well as confidence in the spatial interpolation of the2023 COASTAL MASTER PLAN. Determining Subsidence Rates for Use inPredictive Modeling13
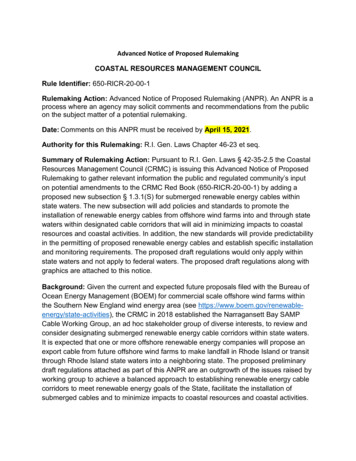
point values (Harris et al., 2020). Further, the time scales over which subsidence measurements aremade can vary greatly (Figure 2). Some techniques are only applicable for the measurement ofspecific subsidence processes, whereas others capture several processes.Figure 2. Temporal and spatial scales of various subsidence measurementtechniques (modified Yuill, et al., 2009). Additional information about thesetechniques can be found in Table A1.2023 COASTAL MASTER PLAN. Determining Subsidence Rates for Use inPredictive Modeling14
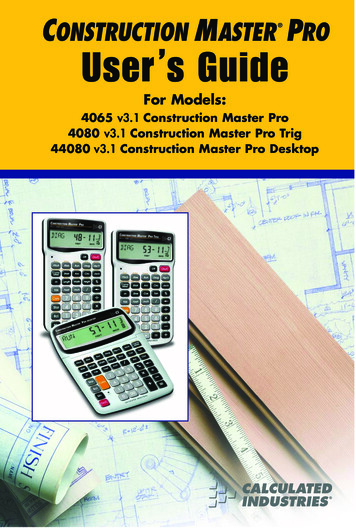
2.0 PREVIOUS MASTER PLANS2.1 SUBSIDENCE IN THE 2012 COASTAL MASTER PLANThere are many ways to consider unknown future conditions in the context of predictive modeling, andselecting a particular strategy depends on the types of information available and how the results willbe used. In the master plan process, the goal of modeling landscape change and storm surge-basedflood risk into the future is to provide a way for decision makers to explore the effects of differentpossible future conditions on the performance of restoration and protection projects. A second goal isto allow for communication with coastal residents about possible future coastal conditions. A scenarioapproach was used in the 2012 Coastal Master Plan to encompass uncertain future environmentalconditions (e.g., future rates of sea level rise). Where there is no known likelihood associated withenvironmental conditions but rather a range of plausible future conditions, scenario analysis (e.g.,Groves & Lempert, 2007; Mahmoud et al., 2009) is useful.Data limitations prevented the creation of a single coastwide map of subsidence rates to supportpredictive modeling for the 2012 Coastal Master Plan. Consequently, rates of subsidence were variedacross environmental scenarios and ICM outcomes have been impacted at different degreesdepending on the particular scenario being used in the model prediction.For the 2012 Coastal Master Plan, a panel of technical experts was convened to consider availabledata and determine plausible subsidence ranges for coastal Louisiana (CPRA, 2012). The expert panelconvened in 2010 was asked to consider potential driving mechanisms and future rates for differentparts of the coast. The process considered information available from previous studies and ongoingwork, but was essentially driven by best professional judgement rather than by a comprehensive dataanalysis. The subsidence rates used for predictive modeling had to be indicative of conditionsexpected over the next 50 years, which meant assessments of subsidence rates over very short timescales (e.g., sub-annual to annual) could only be used with substantial assumptions.Through this process, the expert panel decided to develop a map of 17 subsidence sub-regions acrosscoastal Louisiana, each with distinct plausible ranges (Figure 3). For each sub-region, a briefdescription of its delineation was provided in the 2012 Coastal Master Plan, along with a maximumand minimum rate for future subsidence. These rates vary significantly within and among sub-regions,but in general the lowest rates (as low as 0 mm/yr) are found in areas north of Lake Pontchartrain andin western Louisiana, and the highest rates (up to 35 mm/yr) are found in some impounded areas andthe Bird’s Foot Delta.2023 COASTAL MASTER PLAN. Determining Subsidence Rates for Use inPredictive Modeling15
Figure 3. Previously used plausible subsidence rate ranges for coastal Louisiana.These ranges were developed for the 2012 Coastal Master Plan and used in the2017 Coastal Master Plan.CPRA selected rates for each sub-region from the ranges determined by the expert panel, withdifferent rates used in different environmental scen
surface elevation. Subsidence is also applied in risk modeling using CLARA. Refining subsidence rates for use as model inputs for the ICM is an important part of updating predictive models for the 2023 Coastal Master Plan. Recently published studies provide new information on subsidence rates in coastal Louisiana. These include small and large .