Transcription
Internet Access Services:Status as of December 31, 2010Industry Analysis and Technology DivisionWireline Competition BureauOctober 2011This report is available for reference in the FCC’s Reference Information Center, Courtyard Level, 445 12thStreet, SW, Washington, DC. Copies may be purchased by contacting Best Copy and Printing, Inc., 44512th Street, SW, Room CY-B402, Washington, DC 20554, telephone (800) 378-3160, or via their website atwww.bcpiweb.com. The report can also be downloaded from the Wireline Competition Bureau StatisticalReports Internet site at www.fcc.gov/wcb/stats.
Table of ContentsIntroduction.1Connection speeds.2Figure 1(a)Figure 1(b)Figure 2(a)Figure 2(b)Figure 2(c)Distribution of Reportable Connections by Downstream Speed.3Distribution of Reportable Connections by Upstream Speed.4Distribution by Upstream Speed of Reportable Connections withDownstream Speed Below 3 mbps .5Distribution by Upstream Speed of Reportable Connections withDownstream Speed at Least 3 mbps but Below 6 mbps.6Distribution by Upstream Speed of Reportable Connections withDownstream Speed at Least 6 mbps .7Providers by census tract by connection speed .8Figure 3(a)Figure 3(b)Percentages of Households Located in Census Tracts Where ProvidersReport Residential Fixed-Location Connections of Various Speeds .8Percentages of Households Located in Census Tracts Where ProvidersReport Residential Fixed-Location Connections of Various Speedsor Operate a Mobile Wireless Network Capable of Delivering Serviceof Various Speeds .9A decade of Internet access adoption. .10Figure 4Fixed-Location Connections 1999-2010.10Other report highlights .11Residential subscribership .11Household adoption by speed tier .11Census tract and county shares of households with reportable connections .12Household adoption rates and subscribership demographics .12Maps of providers by census tract .12Remainder of the report .12Detailed Summary Statistics: The Nation.14Detailed Summary Statistics: The States.34Detailed Summary Statistics: Counties and Census Tracts .51Detailed Correlation Results: Demographic Measures.67Technical Notes .81Glossary .84U.S. Federal Communications CommissionInternet Access Services: Status as of December 31, 2010i
Internet Access Services: Status as of December 31, 2010Introduction. This report summarizes information about Internet access connections over 200 kilobitsper second (kbps) in at least one direction in service in the United States on December 31, 2010, ascollected by FCC Form 477. Form 477 gathers standardized information about subscribership to Internetaccess services in the fifty states, District of Columbia, and inhabited insular areas (American Samoa,Guam, Northern Mariana Islands, Puerto Rico, and U.S. Virgin Islands). The information is reported bytelephone companies, cable system operators, terrestrial wireless service providers, satellite serviceproviders, and other facilities-based providers of advanced telecommunications capability.1Notable developments during 2010 include: Internet connections overall are growing. The number of connections over 200 kbps in at leastone direction increased by 28% in 2010 to nearly 169 million. Growth is particularly high in mobile Internet subscriptions, but fixed-location connections alsocontinue to increase. The number of mobile subscriptions exceeded 84 million by December2010 – up 63% for the year. The number of fixed-location connections increased by 6% to over84 million at year’s end. Both fixed and mobile services are shifting to higher speeds. By the end of 2010, 53% of fixedlocation connections and 13% of mobile subscriptions were at speeds at or above the availabilitybenchmark adopted in the Sixth Broadband Deployment Report, up from 49% and 4%respectively at the end of 2009.The report reflects the Commission’s efforts to improve the way it collects, uses, and disseminates data byfocusing in detail on reported connection speeds. Before presenting that information, we note twoimportant points about the Form 477 data. First, the data track subscribership, or adoption, of services of different speeds; they do notdirectly measure the availability of services of different speeds. That is, if service connections ofdifferent speeds are available to a particular consumer for purchase – from one or more suppliers– then only the purchased connection is counted by Form 477. Second, the reported connection speed is typically based on the advertised speed of the purchasedservice, such as the advertised “up to” speed of a wired service or the advertised range of “typicalspeeds” of a mobile wireless service. It is possible that the purchased service will not operate atits advertised speed at all times.21See the Technical Notes and the Glossary that appear at the end of this report for more-detailed information aboutthe Form 477 data collection and the meaning of terms used in this report.2The Commission has worked in partnership with a third-party measurement company, SamKnows, to test actualconsumer broadband speeds. See, e.g., Federal Communications Commission, Office of Engineering andTechnology and Consumer and Governmental Affairs Bureau, Measuring Broadband America: A Report onConsumer Wireline Broadband Performance in the U.S. (August 2011), available at http://www.fcc.gov/measuringbroadband-america.U.S. Federal Communications CommissionInternet Access Services: Status as of December 31, 2010 1
This is the fifth report to include details about subscribership differences among census tracts andcounties, as well as subscribership differences among the states.3 And we continue to illustratecorrelations of subscribership and demographic measures.Connection speeds. The Form 477 program categorizes reportable connections into 72 speed tiersdefined by eight ranges of downstream and nine ranges of upstream speed. In this overview discussion,we organize the extensive information collected for December 2010 into three groups of downstreamspeeds and three groups of upstream speeds. For the breakpoints between these groups, we use the Form477-defined breakpoints that the Commission discussed as potential proxies for the broadband availabilitybenchmark adopted in the Sixth Broadband Deployment Report.4 These Form 477-defined breakpointsare 3 mbps and 6 mbps for downstream speeds and 768 kbps and 1.5 mbps for upstream speeds.53The Form 477 program began collecting state-level data in 2000. Census tract-level data were first collected inDecember 2008. For an overview of program history, see High-Speed Services for Internet Access: Status as ofDecember 31, 2008 (February 2010) (December 2008 High-Speed Report) at pp. 1-4, available athttp://www.fcc.gov/wcb/iatd/comp.html. Readers who are interested in historical trends in the Form 477 datashould note the changes in reporting requirements that were effective in 2008 and earlier, in 2005.4The Commission benchmarked broadband as a transmission service that enables an end user actually to downloadInternet content at 4 megabits per second (mbps) and to upload Internet content at 1 mbps over the serviceprovider’s network. See Inquiry Concerning the Deployment of Advanced Telecommunications Capability to AllAmericans in a Reasonable and Timely Fashion, and Possible Steps to Accelerate Such Deployment Pursuant toSection 706 of the Telecommunications Act of 1996, Amended by the Broadband Data Improvement Act, GN DocketNos. 09-137, 09-51, Report, 25 FCC Rcd 95560, 9563, para. 11 (2010) (Sixth Broadband Deployment Report).5See Sixth Broadband Deployment Report, 25 FCC Rcd at 9568, para. 20. As explained there, the Commissiondecided to evaluate the evidence of broadband availability using the Form 477-defined speed breakpoints of 3 mbpsdownstream and 768 kbps upstream.U.S. Federal Communications CommissionInternet Access Services: Status as of December 31, 2010 2
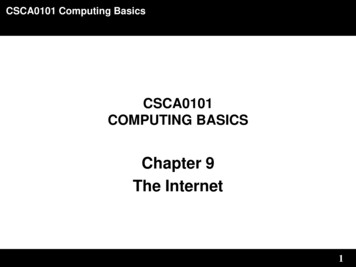
Figure 1(a) illustrates how the connections reported for December 2010 were distributed across the threeranges of downstream speed defined by breakpoints at 3 mbps and at 6 mbps.Figure 1(a)Distribution of Reportable Connections (168,879,000) byDownstream Speed as of December 31, 201032%10%58%Downstream Speed 6 mbps3 mbps Downstream Speed 6 mbpsDownstream Speed 3 mbps(53,820,000 connections)(17,187,000 connections)(97,873,000 connections) At year-end 2010, 58% of reportable connections (or 97.9 million connections) were slower than3 mbps in the downstream direction, 10% (or 17.2 million connections) were at least 3 mbps inthe downstream direction but slower than 6 mbps, and 32% (or 53.8 million connections) were atleast 6 mbps in the downstream direction.6 Mobile wireless connections slower than 3 mbps in the downstream direction increased by 15%(from 63.4 to 73.1 million) between June 2010 and December 2010 while the number of fixedconnections slower than 3 mbps decreased by 8% (from 26.8 to 24.8 million). Total (fixed andmobile) connections slower than 3 mbps downstream increased by 8% (or 7.6 millionconnections) over the six months while connections of all reportable speeds increased by 13% (or19.3 million connections).6Our narrative discussion of the speeds of all reportable connections (fixed and mobile) is summarized moreconcisely in Chart 1. Chart 2 provides connection-speed detail for fixed connections. Chart 5 provides connectionspeed detail for mobile wireless connections.U.S. Federal Communications CommissionInternet Access Services: Status as of December 31, 2010 3
Figure 1(b) illustrates how the connections reported for December 2010 were distributed across the threeranges of upstream speed defined by breakpoints at 768 kbps and at 1.5 mbps.Figure 1(b)Distribution of Reportable Connections (168,879,000) byUpstream Speed as of December 31, 201024%19%57%Upstream Speed 1.5 mbps(31,986,000 connections)768 kbps Upstream Speed 1.5 mbps (40,511,000 connections)Upstream Speed 768 kbps(96,383,000 connections) At year-end 2010, 57% of reportable connections (or 96.4 million connections) were slower than768 kbps in the upstream direction, 24% (or 40.5 million connections) were at least 768 kbps inthe upstream direction but slower than 1.5 mbps, and 19% (or 32.0 million connections) were atleast 1.5 mbps in the upstream direction. Mobile wireless connections slower than 768 kbps in the upstream direction increased by 4%(from 58.6 to 60.9 million) between June 2010 and December 2010 while the number of fixedconnections slower than 768 kbps decreased by 2% (from 36.1 to 35.5 million). Total (fixed andmobile) connections slower than 768 kbps upstream increased by 2% (or 1.7 million connections)over the six months while connections of all reportable speeds increased by 13% (or 19.3 millionconnections).U.S. Federal Communications CommissionInternet Access Services: Status as of December 31, 2010 4
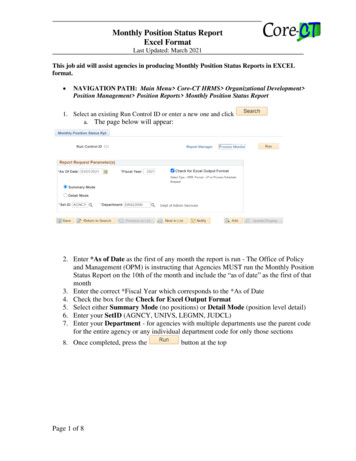
In Figures 2(a) – 2(c), we sequentially review the upstream speeds of the connections that fall into each ofthe three downstream-speed groupings that we illustrated in Figure 1(a).Figure 2(a)Distribution by Upstream Speed of Reportable Connections (97,873,000) withDownstream Speed Below 3 mbps as of December 31, 20100.5%9.5%58%32%48.0%10%Downstream Speed 3 mbps -- Upstream Speed 1.5 mbps(764,000 connections)Downstream Speed 3 mbps -- 768 Upstream Speed 1.5 mbps (15,983,000 connections)Downstream Speed 3 mbps -- Upstream Speed 768 kbps(81,125,000 connections) At year-end 2010, about 48% of reportable connections (or 81.1 million connections) were slowerthan 3 mbps in the downstream direction and also slower than 768 kbps in the upstream direction. Additionally, about 10% of reportable connections (or 16.7 million connections) were fast enoughin the upstream direction (at least 768 kbps) but too slow in the downstream direction (less than 3mbps) to meet the broadband availability benchmark adopted in the Sixth Broadband DeploymentReport.U.S. Federal Communications CommissionInternet Access Services: Status as of December 31, 2010 5
Figure 2(b)Distribution by Upstream Speed of Reportable Connections (17,187,000) withDownstream Speed at Least 3 mbps but Below 6 mbps as of December 31, 20100.8%58%4.6%10%4.7%32%3 mbps Downstream Speed 6 mbps -- Upstream Speed 1.5 mbps(1,431,000 connections)3 mbps Downstream Speed 6 mbps -- 768 Upstream Speed 1.5 mbps (7,776,000 connections)3 mbps Downstream Speed 6 mbps -- Upstream Speed 768 kbps (7,980,000 connections)At year-end 2010, about 5% of reportable connections (or 8.0 million connections) were at least 3mbps but below 6 mbps in the downstream direction and were slower than 768 kbps in theupstream direction. These purchased connections are too slow in the upstream direction to meetthe broadband availability benchmark adopted in the Sixth Broadband Deployment Report.U.S. Federal Communications CommissionInternet Access Services: Status as of December 31, 2010 6
Figure 2(c)Distribution by Upstream Speed of Reportable Connections (53,820,000) withDownstream Speed at Least 6 mbps as of December 31, 201010%17.6%32%58%9.9%4.3%Downstream Speed 6 mbps -- Upstream Speed 1.5 mbps(29,790,000 connections)Downstream Speed 6 mbps -- 768 Upstream Speed 1.5 mbps (16,752,000 connections)Downstream Speed 6 mbps -- Upstream Speed 768 kbps(7,278,000 connections) At year-end 2010, about 4% of reportable connections (or 7.3 million connections) were at least 6mbps in the downstream direction and were slower than 768 kbps in the upstream direction.These purchased connections also are too slow in the upstream direction to meet the broadbandavailability benchmark adopted in the Sixth Broadband Deployment Report. In sum, 67% of reportable Internet access service connections (or 113.1 million connections) inDecember 2010 were too slow in both the downstream and upstream directions, or too slow in asingle direction, to meet the broadband availability benchmark adopted in the Sixth BroadbandDeployment Report. About 48% of reportable connections (or 81.1 million connections) were tooslow in both directions, about 10% (or 16.7 million connections) were too slow in thedownstream direction only, and about 9% (or 15.3 million connections) were too slow in theupstream direction only.U.S. Federal Communications CommissionInternet Access Services: Status as of December 31, 2010 7
Providers by census tract by connection speed. In earlier reports in which we summarized Form 477data through June 2008, we included summary statistics for the percentage of 5-digit geographical ZIPCodes in which differing numbers of providers (zero providers, one provider, two providers, etc.) hadcustomers for their reportable connections.7 The ZIP Code-based data did not include information aboutthe speeds of the connections that were purchased in particular ZIP Codes. However, the census tractlevel information collected on Form 477 since December 2008 does include the speeds of purchasedfixed-location connections.8 In Figure 3(a), we use that information to estimate the percentages ofhouseholds located in census tracts where zero, one, two, or three or more providers reported residentialfixed-location connections of several different speeds at year-end 2010.9Figure 3(a)Percentages of Households Located in Census Tracts Where Providers ReportResidential Fixed-Location Connections of Various Speeds as of December 31, 20101009080706050403020100At least 3 mbpsdownstream & over 200kbps upstreamAt least 3 mbpsdownstream & 768kbps upstreamAt least 6 mbpsdownstream & 1.5mbps upstreamAt least 10 mbpsdownstream & 1.5mbps upstream3 Providers4529332 Providers485026251 Provider71857570 Providers031415Figures may not sum to 100% due to rounding.7For the most recent such report, see High-Speed Services for Internet Access: Status as of June 30, 2008 (July2009) (June 2008 High-Speed Report) at pp. 1-4, available at http://www.fcc.gov/wcb/iatd/comp.html.8Mobile wireless providers report the number of service subscriptions they have sold, and the speeds of thoseservice subscriptions, at the state level only. For individual census tracts, they report the speeds of mobile wirelessservice subscriptions that they offer for sale – that is, the capability of the network that they operate in the censustract.9A provider who reports residential connections of a particular speed in a particular census tract may or may notoffer service of that speed everywhere in the census tract.U.S. Federal Communications CommissionInternet Access Services: Status as of December 31, 2010 8
In Figure 3(b), we estimate the percentages of households in census tracts where providers reportedresidential fixed-location connections of different speeds or operated a mobile wireless network capableof sending or receiving data at the indicated speeds.Figure 3(b)Percentages of Households Located in Census Tracts Where Providers ReportResidential Fixed-Location Connections of Various Speeds or Operate a Mobile Wireless NetworkCapable of Delivering Service of Various Speeds as of December 31, 20101009080706050403020100At least 3 mbpsdownstream & over 200kbps upstreamAt least 3 mbpsdownstream & 768kbps upstreamAt least 6 mbpsdownstream & 1.5mbps upstreamAt least 10 mbpsdownstream & 1.5mbps upstream3 Providers81724232 Providers161821251 Provider3926570 Providers021115Figures may not sum to 100% due to rounding.U.S. Federal Communications CommissionInternet Access Services: Status as of December 31, 2010 9
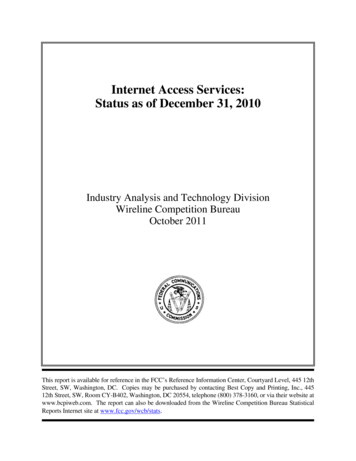
Internet access adoption. The Commission has systematically collected, compiled, and published dataabout the adoption of fixed-location Internet access connections faster than 200 kbps in at least onedirection for more than a decade. Figure 4 illustrates the adoption of fixed-location Internet accessconnections (that is, all reportable connections except mobile wireless connections) since 1999.10Figure 4Fixed-Location Connections 1999-201090,00010080,00090Connections in onnections per 100 Units8070,0002010,000100Dec1Ju 999n2D 000ec2Ju 000n2D 001ec2Ju 001n2D 002ec2Ju 002n2D 003ec2Ju 003n2D 004ec2Ju 004n2D 005ec2Ju 005n2D 006ec2Ju 006n2D 007ec2Ju 007n2D 008ec2Ju 008n2D 009ec2Ju 009n2D 010ec20100Residential Fixed Connections (left axis)Total Fixed Connections (left axis)Residential Fixed Connections per 100 Households (right axis)Total Fixed Connections per 100 Population (right axis) In the decade between December 2000 and December 2010, total (business and residential)reportable fixed-location connections grew from 7 million connections to 84 million connections– at a compound annual growth rate of 29% per year. In the same decade, residential fixed-location connections grew from 5 million connections to 77million connections – at a compound annual growth rate of 31% per year. Between 2000 and 2010, household adoption – which we track in Figure 4 by comparing thenumber of residential fixed-location connections to the number of households – increased from 3connections per 100 households to 63 connections per 100 households.11,1210Reportable connections for December 1999 through June 2005 are summarized in our report High-Speed Servicesfor Internet Access: Status as of June 30, 2008 (July 2009), Tables 1 and 2, available in Excel format athttp://www.fcc.gov/wcb/iatd/comp.html. The more recent data are discussed later in this report.11We also show total (including business as well as residential) fixed-location connections per 100 population inFigure 4, which is a statistic routinely reported by the Organization for Economic Cooperation and Development(OECD). This ratio incorporates connections to business locations into a comparison to persons. A more accuratelyU.S. Federal Communications CommissionInternet Access Services: Status as of December 31, 2010 10
Other report highlights.Residential subscribership Residential fixed-location Internet access connections over 200 kbps in at least one directionincreased by 2% during the second half of 2010, to 77 million. See Table 3. Reported residential mobile wireless service subscribers with mobile devices and data plans forfull Internet access increased by 21%, to 63 million, during the second half of 2010. See Table 3. The reported data show a 10% increase between June 2010 and December 2010 in the number ofresidential fixed-location connections that are at least 6 mbps downstream and 1.5 mbps upstream(from 22.3 million to 24.6 million) and an 11% increase in the number of connections that are atleast 10 mbps downstream and 1.5 mbps upstream (from 21.8 million to 24.2 million). See Chart12.13Household adoption by speed tier As a national average in December 2010, there were 35 residential fixed-location connections per100 households for connections with speeds that were reported to be at least 3 mbps downstreamand 768 kbps upstream. That was slightly more than half as large as the ratio for residentialfixed-location connections of any reportable speed.14 See Tables 15 and 16.measured indicator of this type would include only connections to residential locations, but OECD does not havecomprehensive, consistent information about residential connections in the member countries. (We note that theratio of accurately measured residential fixed-location connections to population has a maximum value for anygiven country and point in time – the value when every household is connected – if we assume that no householdwould have more than one fixed connection to its premises. For the United States in June 2010, for example, themaximum value would be 38 because there were about 119.7 million households in the United States and inhabitedinsular areas and a population of about 313.2 million.)12For consistency of presentation, we include only mid-year ratios in Figure 4. We calculated total fixedconnections per 100 population using U.S. Census Bureau population estimates for the United States and PuertoRico – which are as of July 1 each year – and Census 2000 population for the remaining inhabited insular areas. Wecalculated residential fixed connections per 100 households using U.S. household estimates from the CensusBureau’s Current Population Survey (CPS) for July of each year and Census 2000 households for the inhabitedinsular areas. (The CPS also estimates U.S. households for March and November of each year.)13Using revised data that were filed after our most recent report was released, the increases over the preceding sixmonth period, from December 2009 to June 2010, had been 12% (from 19.8 to 22.3 million) and 12% (from 19.5 to21.8 million), respectively.14Increases over time in the ratio of residential fixed-location connections to households indicate that increasingshares of households are connected at home. The ratio is somewhat different from the “take rate” of offered servicebecause, as discussed in connection with Figure 3(a), some households are located in areas where apparently nofixed-location service is offered (as none is purchased).U.S. Federal Communications CommissionInternet Access Services: Status as of December 31, 2010 11
Census tract and county shares of households with reportable connections We estimate the share of households with fixed-location Internet access connections over 200kbps in at least one direction in individual census tracts and counties as of December 31, 2010.Our estimates continue to indicate that there are substantial areas of relatively low and relativelyhigh household adoption around the national average. See Charts 15 and 16. For both census tracts and counties, we continue to find estimates above 100% for the share ofhouseholds with reportable fixed-location Internet access connections. These results suggest thatsome filers are not accurately assigning customer connections to census tracts, and anecdotalevidence supports that conclusion.15Household adoption rates and subscribership demographics The report includes charts that illustrate correlations between household subscribership, oradoption, rates and demographic measures. We update charts based on income, householddensity, education, age, and race. The data indicate that some demographic variables arecorrelated with the adoption of Internet access service. See Charts 17-29.Maps of providers by census tract Maps depict the number of providers of reportable connections by census tract. These maps aresimilar to previously published maps of providers by ZIP Code, but differ in important respects.In particular, instead of a single map combining providers of connections over all technologiesand to both residential and business end users, now separate maps depict: (1) providers of total(combined residential and business) reportable fixed-location connections, (2) providers ofresidential reportable fixed-location connections, (3) providers of residential fixed-locationconnections at least 3 mbps downstream and 768 kbps upstream, and (4) providers makingreportable mobile wireless service available.16Remainder of the report. The remainder of the report consists of tables, charts, and maps that highlightdifferent aspects of Internet access service subscriptions. This information is organized into four sections,as described below. As always, publicly accessible data that are too voluminous to include in this reportare available online at http://www.fcc.gov/wcb/iatd/comp.html. Detailed Summary Statistics: The Nation. Tables 1-14 and Charts 1-14 focus in order on:number of connections, speed of connections, technology of connections, and number ofproviders. Detailed Summary Statistics: The States. Tables 15-24 present comparable information for theindividual states and our estimates of the shares of households that are connected at differentspeeds.15For example, while contacting Form 477 filers with questions about reported data, FCC staff continue to findsituations in which all connections reported for a county have been assigned to a single, anomalous census tract.16As discussed in the Technical Notes, a mobile wireless provider should only report service availability in censustracts where the provider operates a network capable of sending or receiving data at speeds above 200 kbps.U.S. Federal Communications CommissionInternet Access Services: Status as of December 31, 2010 12
Detailed Summary Statistics: Counties and Census Tracts. Charts 15-16 and Tables 25-29present information about differences among counties and census tracts. This section concludeswith two maps that illustrate differences among census tracts in the estimated share of connectedhouseholds and the four maps (discussed above) that illustrate providers by census tract. Detailed Correlation Results: Demographic Measures. Charts 17-29 present details of thecorrelations observed between the estimated share of connected households and demographicmeasures.****We invite users of this information to suggest improvements in the data analysis by using the attachedcustomer response form or sending comments to IATDreports@fcc.gov for subject: December 2010Internet services data, and to participate in proceedings the Commission undertakes to improve the datacollection.U.S. Federal Communications CommissionInternet Access Services: Status as of December 31, 2010 13
Detailed Summary Statistics: The NationContents of this sectionNumber of connectionsTable 1Table 2Table 3Table 4Connections over 200 kbps in at Least One Direction 2006-2010.16Connections at Least 3 mbps Downstream and 768 kbps Upstream 2008-2010.16Residential Connections over 200 kbps in at Least One Direction 2006-2010 .16Residential Connections at Least 3 mbps Downstream and 768 kbpsUpstream 2008-2010 .16Speed
Internet Access Services: Status as of December 31, 2010 Industry Analysis and Technology Division Wireline Competition Bureau October 2011 . 4 The Commission benchmarked broadband as a transmission service that enables an end user actually to download Internet content at 4 megabits per second (mbps) and to upload Internet content at 1 mbps .