Transcription
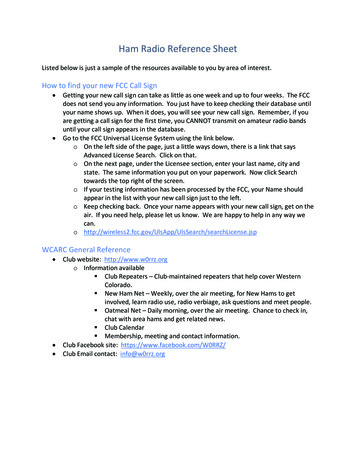
The Poor Ham’s Scalar Network AnalyzerNick Kennedy—WA5BDUkennick@gmail.comIcan’t seem to start a talk or article without first mentioning that it’s a great timeto be a ham builder and experimenter.Availability of inexpensive componentsand modules, free software and a hugeknowledge base available on the internet,both in static form and in consultations viadiscussion groups. OK, I got that out of theway. Onward to the Poor Ham’s ScalarNetwork Analyzer (PHSNA).In September 2013, Jim Giammanco,N5IB and Jerry Haigwood, W5JHannounced via discussion group postingstheir collaborative project for a versatilemeasurement system integrating a DDSRF generator, an Arduino microcontrollerboard, and an RF log power meter basedon the AD8307 chip.What’s in a Name?In the original announcement post, theproject was jokingly called SSNAFHU, forSimple Scalar Network Analyzer for Hams—Unveiled. We’ve standardized onPHSNA, Poor Ham’s Scalar NetworkAnalyzer, emphasizing the low cost ofconstruction and because it’s the name ofthe Yahoo Group. Lately I also hear SSNAfor Simple Scalar Network Analyzer.But the key term is “scalar,” suggestinga modest reference to the fact that this isn’ta Vector Network Analyzer (VNA). Itgives the magnitude of gain or loss througha network, but not the phase shift. But Ithink we’re seeing that magnitude onlymeasurements can be quite useful.What is it? What does it do?The system is built around two off-theshelf modules. Refer to Figure 1 for thisdiscussion. First is an AD9850 DDS boardwhich includes the clock module and othercomponents necessary to make a completeDDS RF generator, excluding controller.Next is an Arduino board which will provide user interface communications, control of the DDS, and necessary ADC conversions on the signal from the log powermeter.The heart of the project is a small (2.75"by 4") motherboard onto which both modules are mounted. The board has 0.1"female headers on both faces to accommodate matching pins on the DDS andwww.qrparci.org/Figure 1—PHSNA block diagram.Arduino modules, putting it in the middleof a three board stack. The board makes therequired connections between the twomodules, plus provides voltage regulation,post-DDS filtering, an amplifier stage, andattenuators to control level and keepimpedances constant. The DDS andArduino modules and their motherboardreside within the dashed rectangle of Figure1. Figures 2 and 3 show the DDS andArduino sides of the board, respectively.Thus far, we have a functional and useful RF signal source. To turn this into ananalyzer we need an RF detector. The project uses a version of the circuit publishedin 2001 in QST by Wes Hayward and BobLarkin [Ref. 1], with several variationspublished in succeeding years. It uses theamazing AD8307 chip which can measureRF signal strength from about –80 dBm to 15 dBm. Originally, the project wasgoing to let participants be on their own forthis component, but then Jim found that hecould squeeze the circuit onto the standardproduction board size when he did the layouts, and got the OK from Mr. Hayward topublish his circuit on the PHSNA Yahoosite. Because of its extreme sensitivity, theThe QRP Quarterlylog power measurement circuit needs to bein a separate enclosure and its board isseparated from the main board. Users caninclude an analog meter to make it a standalone instrument as in the original article,or omit the meter and just let the Arduinoconvert the voltage output to a dBm reading.Which brings us to the “what does itdo?” part. Again turning to Figure 1, we seethe system in action, sourcing a signalthrough a Device Under Test (DUT) (crystal, filter, amplifier, attenuator, etc.) andthen into the log power detector, whichsends a DC voltage output proportional tothe log of RF power back to the Arduino.The Arduino converts that signal to a number representing RF power in dBm andreports it back to the user via serial / USBport. By sweeping the DDS over a desiredrange of frequencies, we can create an arrayof data showing the response of the DUTand display it graphically as seen in thelovely plots we’ve included in the article.As hams, we know the value of seeingthe response curves of our filters: lowpass,highpass, bandpass, IF, and other networks. Also, we can characterize individuSpring 2014 · 43
Figure 3—Main board from the Arduino side.Figure 2—Main board with DDS, filter and post amplifier.al crystals and use the parameters we’vemeasured to design and build our owncrystal filters. And we can see how “broadband” our broadband amplifiers actuallyare. Add a simple outboard bridge and wecan check the SWR of our antennas.Board DetailsThe power supply section requires 11to 13 VDC input and uses an LM7805 regulator to provide 5 VDC for the Arduinoand DDS. The full supply voltage isrequired for the post-DDS amplifier. Alsoprovided is an adjustable LM317L regulator circuit to allow setting the ADC reference voltage used by the Arduino to thedesired value.The DDS module includes a filter, butit is made from tiny SMT components ofquestionable Q value, so a higher qualityreplacement filter using toroidal inductorsis included in the board layout. It’s flat outto 33 MHz. (That’s for the AD9850 version. The AD9851 version will allow goingbeyond 6 meters.) There are resistive attenuators before and after the filter and afterthe amplifier to maintain 50 ohm terminations for the filter and assure a 50 ohm generator output resistance. These also set thetarget output level of approximately –10dBm. The basis for this choice is to allowdriving crystals at a proper level.What about that amplifier? This is anevolving project and two versions weredesigned with separate board runs madefor each. The first was based on EMRFDFigure 2.57 and used a 2N5109 transistor44 · Spring 2014Figure 4—Log power meter board.providing about 16 dB of gain. Anotherversion uses a MMIC amplifier. This mightbe a good choice for anyone choosing tosubstitute an AD9851 module for theAD9850 originally proposed, taking themaximum frequency from about 30 MHzto about 60 MHz. I built the 2N5109 version and adjusted the amplifier and attenuator chain to get about 8.5 dBm output.When putting it all into a box, theseconnectors and controls are needed: AnRF output jack, typically BNC. A logpower signal input jack. A 12 VDC powerjack. For serial / USB communication andprogramming the Arduino, a cutout isneeded to allow access to the Arduino’sUSB jack. My Arduino came supplied witha USB cable. A USB to serial driver makesit look like a serial port within my PC. Inaddition, a reset pushbutton for theArduino is a good idea so you don’t haveto interrupt power to re-start the program.Not Too Complicated So Far, eh?The design for the log power board follows the Hayward / Larkin version (Ref. 1)fairly closely. It contains a battery, 5V regulator, the AD8307 chip, and a followingop-amp with adjustable gain, plus an inputcompensation circuit giving it a widebandwidth of over 500 MHz. Jim madeboards for both DIP and SOIC versions ofthe AD8307. A number of suitable opamps have also been proposed in lieu ofthe original LM358, so use your junk box.A unique feature of the board is inclusionof ground foils placed to allow building aThe QRP Quarterlycopper “Quonset hut” shield over theAD8307 chip. This is optional and sincemy enclosure for this board is very RFtight, I did not include it in my build.Calibration pots will allow scaling themaximum output of the log power board tomatch the ADC reference voltage set in thePHSNA board.Controlling it—The User InterfaceNo display, no keyboard and almost noswitches. The simplicity of this designcomes in part from having the user interface made via a serial terminal. It seemsalmost archaic, but even in this modern agewe can still find serial terminal programsto run on our PCs and talk to the Arduinovia its virtual serial port. The Arduinospools out a menu when booted and waitsfor the user’s input. I chose term232.exe asmy terminal program. It’s free, small andsimple and runs fine on my laptop underWindows Vista. When working in theArduino IDE environment, one can alsojust pull up its serial monitor and talk to thePHSNA from there. This project is a hacker’s delight though. One user has alreadyadded an LCD to his PHSNA box showingcurrent frequency and dBm reading.The SoftwareHere’s another place where hackers canhave some fun. The PHSNA software iscompletely open source, so if you like toprogram, dive in. The software was rolledout with two functions. The SNA functionscans a user specified range and step sizewww.qrparci.org/
and outputs to the serial terminal the current frequency and the level in dBm readback for each frequency. This informationis transmitted in the “comma delimited”format that can be picked up by Excel orother programs for graphing. Just do a“capture” with the terminal program andyou’ve got your data file.The second function is the Generatorfunction. The user specifies a frequencyand the DDS goes there. A dBm reading isalso displayed. Arrow keys and adjustablestep size allow moving the DDS aroundand seeing the change in response, if theAD8307 board is connected.I jumped on the software bandwagonand added several functions. Some of themwere developed mindful of users whodon’t want to alter program code, or even“burn” an existing program to the Arduino.I added the ability to calibrate the DDS’sclock to a standard (such as WWV) and todetermine the AD8307’s slope and intercept constants used to convert the ADCreading to dBm. Also the ability to setand/or change the start-up frequency of theDDS was added. All this information issaved to EEPROM and read at each startup, so there’s no need to “hard code” it intothe source code and burn a custom version.I initially did the slope and interceptusing two points of data, but Jim pointedme to a statistics site that gave a methodfor calculating a best fit slope and interceptfrom a set of multiple data points, so Iadded that capability to the routine. SWRmeasurements using the return loss bridgebecame a separate menu item.I also added ten memories accessedwith a keystroke (0 through 9) to act similar to band switches. And finally a “Scan”function simply sweeps the DDS over aspecified range and repeats indefinitely.Normalization and FrequencyCompensationOften when plotting the response of filters, you don’t care about the actual dBmnumbers but instead want zero attenuationto be graphed as a 0 dB reference and everything goes down from that. This is wherenormalization comes in. The software canautomatically normalize readings so thereading with no losses will be 0 dBm.In addition, there will usually be aslight falling off in RF level from thePHSNA as frequency increases. The userjust wants to see amplitude changes causedwww.qrparci.org/Figure 5—Spreadsheet running PLX-DAQ link to PHSNA.by his DUT, not by the RF generator. Thesoftware also can address this, using a 5thorder polynomial equation to flatten thereported response. This hasn’t been automated (yet) but Jim has placed a detaileddescription on how to get Excel to compute the coefficients from a “self scan” ofthe PHSNA in a PDF on the Yahoo site. Iadded a function to allow entering theseconstants from within the program whichthen saves them to EEPROM so no editingof source code is required.For those who do want to edit sourcecode though, note that the IDE is a freedownload and no external programminghardware is required to program theArduino—just plug in the USB cable andgo. Here’s what’s on the start-up screen:Current reference clock frequency is:179987712Mode flag: Normal ModeRetrieved:slope 0.10110 intercept -84.62DDS is running on: 7040000 HzAD9851 modePHSNA Standard rev 3.01Select:0 - Restore this menu screen1 - SNA Functions2 - Generator Functions3 - Return Loss Bridge & SWR4 - Measure Crystal Parameters5 - Memories6 - Scan* - Options & Calibrations MenuThe QRP QuarterlyAnd here’s the separate menu for setup andcalibrations:Choice:A - Calculate or enter AD8307 slope /interceptC - Curve fit polynomical constants:View/Enter/ClearD - Calibrate DDS reference frequencyP - Change start-up mode to PLX(Excel) or terminalS - Set Start-Up FrequencyM - Toggle AD9850/AD9851 modesQ - About PHSNA - Re-display menu - Back to main menuPLX-DAQ Interface to ExcelOption 6 requires some explanation.Jack Generaux, WØFNQ found an Excelmacro widget called PLX DAQ that’s freeware from Parallax, maker of the BasicStamp chips. This add-in gives Excel theability to communicate via serial port,importing data from external hardware.Jack customized the PHSNA’s Arduinosoftware so it would ask for upper andlower limits and step size from specificExcel cells, then proceed to scan that rangeand send the frequency and dBm readingfor each point to back to Excel where itcould be plotted. This avoids the need for aterminal program entirely. Figure 5 showsPLX-DAQ in action. The data for the filterplot was imported directly into Excel fromPHSNA using the PLX-DAQ interface.I’m highly impressed with PLX-DAQSpring 2014 · 45
Figure 6—PHSNA and power meter byKG9DK.Figure 8—N5IB’s PHSNA in a customwood box.Figure 7—WØWPE’s PHSNA andmeter at work testing crystals.Figure 9—WA5BDU’s log power circuitin box.Figure 10—N5EM’s classic meter movement with a custom scale.Figure 11—N5IB’s meter with customscale and box.and decided to integrate it into the mainstream program so instead of having an“either/or” firmware configuration, theuser could toggle between “terminal” and“PLX DAQ” modes as desired. You canmanually tell it to switch modes, but it canalso detect how it’s connected and swapautomatically.I thought it would be a natural application for software to automate this processand wrote routines that automatically findthe resonant peak and loss at that point, aswell as finding the upper and lower halfpower points. With this information, theArduino can (and does) crunch the numbers to get a crystal’s model parameters(including Rs) using standard formulas,and do it in a jiffy. Now you can take astack of crystals and find their motionalparameters in a small fraction of the time ittook previously. You could easily do onecrystal per minute once you get rolling.ble. These prices are postpaid and arewhat I paid. Others paid more or less.Crystal Scanning FunctionFinding the 3 dB bandwidth of crystalsand their series resistance is required todetermine crystal parameters Lm, Cm andRs for use in filter design. One can easilygo through tabulated or plotted data andfind the bandwidth, and the Rs value canbe found by resistor (potentiometer) substitution. This was all outlined by JimKortge K8IQY in a couple of influentialAmQRP articles (Ref. 4) and by Haywardand Demaw before that. Then you crankthrough the math with your calculator orspreadsheet to determine the parameters.46 · Spring 2014How Much Does it Cost?We’d all like a workbench full ofsophisticated test equipment, but price isimportant. I can’t tally up what a completesystem would cost since it varies so much.But I can say approximately what I paidfor the major items. I made good use ofthe eBay / China supply chain when possiThe QRP QuarterlyArduino UNO 12.30DDS AD9850 (30 MHz) 6.88PHSNA board set 6.50(one for the DDS/Arduino andonefor AD8307 power meter)The board set is not currently availableas the last run is sold out. However, if evidence of sufficient interest is shown, theorganizers of this project, N5IB andW5JH, have agreed to run another boardset in the near future. If you are interestedin the project, the best approach is to jointhe PHSNA group on Yahoo and tell theorganizers of your interest. Likely cost fora board set is about 15 plus shipping.Of course you have to populate theboards with the usual resistors, capacitors,regulators, connectors and toroids, andprovide enclosures. I have a pretty deepwww.qrparci.org/
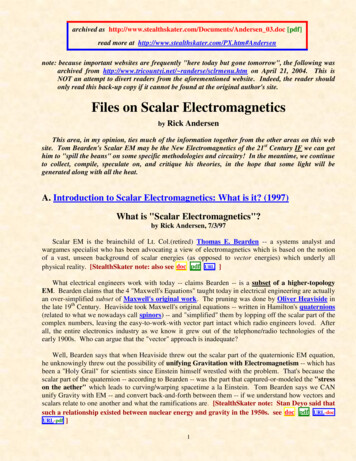
Figure 12—Passband plots for 8 MHz SSB and CW filters.junk box but others might have a prettygood shopping list. The AD8307 chipcould set you back 12 or so, or maybe youcould get a free sample. I went to eBay andbought ten (10) of them in the SOIC-8package for 9.50 postpaid, less than a dollar apiece.On the PHSNA site is a spreadsheetBOM with info on where parts can be purchased. It includes photos of the Arduinoand DDS boards, since you want to buy thecorrect form factor. An eBay search for“AD9850 module” or similar is suggested.Suggested vendors on eBay include“chip partner,”“chipworld,”and“survy2014”. Compare the hits you getwith the photo in Figure 2.Builds and BoxesAs you see from the photos, there aresome real craftsmen in the group. APHSNA in an ugly “repurposed” box (likemine) can work well too, but we’ll focuson the pretty ones here. Figures 6, 7 and 8show implementations by KG9DK,WØPWE and N5IB. I show my own logpower circuit enclosure in Figure 9 as anexample of one without a meter movement. If you do use a meter, it’s hard tobeat the beautiful old Weston movementwith custom scale by N5EM shown inFigure 10. He used the Galva applicationto create the scale. Likewise, look atN5IB’s beautiful meter and custom enclosure in Figure 11.Again, two boxes are required. The onefor the DDS / Arduino “sandwich” doesn’trequire much shielding but the one for theAD8307 log power measurement circuitwww.qrparci.org/Figure 13—Multiple bandpass filter plots.should be in an RF tight box.Getting Down to Business This is the fun part—actual measurements. To measure filters and other networks just put the DUT in circuit perFigure 1 and run a plot. You can save plotted data to a CSV file for plotting by Excelor other plotting programs, or importdirectly into Excel with PLX-DAQ.In Figure 12 you see that I plotted theresponse of CW and SSB bandwidth filterson the same graph. This view will helpdetermine the best placement of the BFOinjection for each mode.Figure 13 shows plots of eight separatebandpass filters in a WØFNQ project.The PHSNA system is great for plotting the SWR of antennas when used witha return loss bridge. Figure 14 shows a plotI did of my tribander on 20 meters. Thereturn loss bridge (RLB) is a simpledevice, discussed later.You needn’t limit yourself to checkingpassive devices. I used the PHSNA to plotthe gain of a homebrew 35 dB gain broad-band utility amplifier over the range of 1MHz to 60 MHz. Just put a big attenuatorat the input end so as not to exceed theAD8307’s measurement range or drive theamplifier into saturation.When doing crystal characterizations,the numerical results tell more than plots.Table 1 shows tabular data captured fromPHSNA in testing a set of several crystals.This data is all you need to design yourown crystal filters using any of a numberof popular programs available free.Accessorize!You can do a lot with just the PHSNAand log power meter, but there are someother gadgets that will extend its usefulness.Power Level CalibrationFor most measurements, the relativelevels of two powers are all that matters.That’s what decibels are all about, after all.So we mostly need an accurate slope measurement on the log power measurementcircuit. But some of us want to know theabsolute power level being measuredPress ‘Y’ to test another w/same parameters,Press other key to return to menuAssign/change crystal ID (Y/N)?ID#, F peak, loss(dB), BW, Rs, Cm (pF), Lm (mH), QJH01, 4432251, 4.25, 74.0, 15.8, 0.0147079, 87.667694, 154899JH02, 4432271, 5.06, 79.0, 19.7, 0.0143055, 90.133056, 127162JH6, 4432243, 9.91, 136.0, 53.2, 0.0140858, 91.540275, 47899JH9, 4432246, 4.55, 75.0, 17.2, 0.0143952, 89.572540, 144944JH10, 4432308, 3.34, 66.0, 11.7, 0.0145663, 88.518142, 210561Table 1—Crystal test results in tabular form.The QRP QuarterlySpring 2014 · 47
the transformers of hisK8IQY circuit for crystalmeasurementswithPHSNA.Return Loss BridgeA return loss bridge(RLB) is a simple deviceconsisting of three 49.9ohm 1% resistors and oneferrite transformer plusthree BNC jacks. But itexpands greatly what youcan do with the PHSNA,notably read the SWR foryour antennas. But, a goodFigure 14—SWR plot of a KT-34A tribander for the 20 50 ohm match can also beMeter band.important in other circuitssuch as filters and amplifier inputs. Jim and Jerryand/or being sourced by the PHSNA gener- came up with a beauty and put it out as aator. You can do adequate calibrations with kit including a Hammond box and a circuitthings like compensated diode detectors or board with holes that align perfectly withoscilloscopes to establish a reference power the BNC pins—no leads. Well worth havlevel. Or you might use a 1 watt QRP trans- ing. RLBs are easy enough to build onmitter and run it through the 40 dB tap your own if you want to go that route.described in the Hayward / Larkin articlelog power meter article [Ref. 1].Mutations, Bifurcations and TangentialBut some of us wanted to get fancy and Developmentstried a simple but accurate calibrationWith a popular “open source” project,source initially described by Bob Kopski it’s hard to keep up with developments.K3NHI in the Jan/Feb 2004 issue of QEX. Hardly a day goes by that I don’t see someIt uses a common computer clock module new customized features added by a user.as a source. The calibrator and an extension At least one person has added a text disof it are described in VE7BPO’s popular play with I2C interface and added codingQRP Homebuilder website (Ref. 2). to the Arduino program to send it frequenSpeaking of accessories, a step attenuator is cy and dBm information. Just yesterday (asnice to have for calibration and slope deter- I write in February) George N2APB andmination. Separate chainable attenuators Dave AD7JT showed preliminary photoswork well too. I built the Kopski standard of a hand held terminal for the SSNA thatand the VE7BPO sine wave source that cal- accepts a keyboard connection and has aibrates to it and now feel like I have a pret- color graphics display. No computerty accurate indication of true power level.required! A run of kits is expected.Jerry, W5JH is working on a “measureCrystal (and other) Measurement Jigsment receiver” to scan and quantify harYou can just stick a crystal in between monic levels from an RF source.the PHSNA’s RF out and the AD8307’sI’m personally working steadily on ainput and measure it in a 50 ohm environ- stand-alone Windows application to interment, but you’re going to want some kind face directly with the PHSNA usingof socket or grabbers. So while you’re at it, Visual C#. The idea is to have the PC dojust make a dual 4:1 transformer arrange- all the hard work and just have thement to put the crystal in a 12.5 ohm envi- Arduino accept frequency informationronment for better accuracy. This was and return ADC (log power) information.described in the K8IQY series [Ref. 4]. In Ideally, the program will also have graphFigure 7 you see WØWPE’s set-up using ing routines so no outside graphing pro-48 · Spring 2014The QRP Quarterlygram will be needed.Where’s the Schematic?Really, I’m not holding anything back.But the project has a number of variationsin configuration. Two or three differentDDS modules, plus some are usingNJQRP / AmQRP DDS-30 and DDS-60boards. Going to 60 MHz changes the filter component values. There is also a version with a 2N5109 post amplifier andanother with an MMIC amplifier. You getthe idea. But the schematic diagrams andother technical information are presentedin depth on the PHSNA Yahoo website. Ifyou are interested in giving it a shot, signup and take a look. Jim has also produceda number of illustrated guides in PDF format to help the user build and use the various components. You’ll also find a lotmore photos, graphs and other informationfrom group participants.AcknowledgementsWe thank Terry WB4JFI, Bill W2EB,Leon G1HSM and Tracy N4LGH for providing some excellent information onworking with the inexpensive DDS modules being sold by offshore electronicsvendors. This allowed Jim and Jerry tomove forward and make the PHSNA project a reality.ConclusionsI believe the PHSNA is a project thatresults in an extremely useful and versatileRF measurement system at low cost andonly moderate building complexity. I hopereaders will see it the same way. We’d loveto have more folks jump in and give thisproject a try.References1. “Simple RF-Power Measurement,”by Wes Hayward, W7ZOI and Bob Larkin,W7PUA, QST June F-workbench5.asp3.PHSNA s/PHSNA/info4. “Tools and Methods for MeasuringCrystal Parameters,” by Jim Kortge,K8IQY, NJQRP Homebrewer Issue #9www.qrparci.org/
copper "Quonset hut" shield over the AD8307 chip. This is optional and since my enclosure for this board is very RF tight, I did not include it in my build. Calibration pots will allow scaling the maximum output of the log power board to match the ADC reference voltage set in the PHSNA board. Controlling it—The User Interface