Transcription
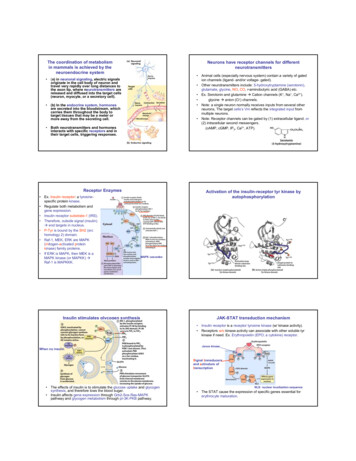
Protein Structure AnalysisMajid MassoSecondary Structure:Computational ProblemsSecondary structure characterizationSecondary structure assignmentProtein structure classificationSecondary structure prediction1
Protein Basic Structure A protein is made of a chain of amino acids. There are 20 amino acids found in nature Each amino acid is coded in the DNA by one or morecodons, i.e. a three base sequence.Cell Informatics2
Transcription and TranslationFrom http://www.agen.ufl.edu/ chyn/age2062/lect /lect 07/of7 1a.GIFFinding the Protein Sequence From DNA sequence From protein sequencer From mRNA sequence3
Amino Acid ResidueAmino Acids4
Amino Acid Residue ClusteringAdopted from: L.R.Murphy et al., 20005
Peptide BondProtein backboneNWVLSTAADMQGVVTDGMASGLDKD6
7
Secondary Structure (Helices)Helix8
Secondary Structure (Beta-sheets)9
Secondary Structure Conformationsφψalpha helix-57-47alpha-L57473-10 helix-49-26π helix-57-80type II helix-79150β-sheet parallel-119113β-sheet antiparallel-13913510
Side-Chain Atom NomenclatureSide-Chain Torsional Angles11
Four Levels of Protein Structure Primary Structure – Sequence of amino acids Secondary Structure – Local Structure such as α-helicesand β-sheets. Tertiary Structure – Arrangement of the secondarystructural elements to give 3-dimensional structure of aprotein Quaternary Structure – Arrangement of the subunits togive a protein complex its 3-dimensional structure.Protein Structure HierarchyAdopted from Branden and Tooze Primary - the sequence of amino acid residues Secondary - ordered regions of primary sequence(helices, beta-sheets, turns) Tertiary - the three-dimensional fold of a protein subunit Quaternary - the arrangement of subunits in oligomers.12
Protein Structure DeterminationX-ray crystallographyNMR spectroscopyNeutron diffractionElectron microscopyAtomic force microscopyMeasuring Protein Structure Determining proteinstructure directly isdifficult X-ray diffractionstudies – must first beable to crystallize theprotein and thencalculate its structureby the way it dispersesX-rays.From aching/inv a.html13
X-ray crystallographyX-ray crystallographyElectron density map created from multi- wavelength data (Arg)14
X-ray crystallographyExperimental electron density map and model fitting(apoE four helix bundle)X-ray crystallography15
Measuring Protein Structure NMR – Use nuclearmagnetic resonance topredict distancesbetween differentfunctional groups in aprotein in solution.Calculate possiblestructures using inside.htmWhy not stick to these methods? X-ray Diffraction –– Only a small number of proteins can be made to formcrystals.– A crystal is not the protein’s native environment.– Very time consuming. NMR Distance Measurement –– Not all proteins are found in solution.– This method generally looks at isolated proteins ratherthan protein complexes.– Very time consuming.16
Structure verification andvalidationBiotech Validation rocheckProcheck programsCLEAN - cleaning PDF fileSECSTR - assigning secondary structureNB - identifying non-bonded interactionsANGLEN - calculating bond lengths and bond anglesTPLOT, PPLOT, BPLOT - graphical output17
Bond lengths ------------------------Bond labeling Value -------------------C-N C-NH1 (except Pro) 1.329 0.014 C-N (Pro) 1.341 0.016 C-O C-O 1.231 0.020 Calpha-C CH1E-C (except Gly) 1.525 0.021 CH2G*-C (Gly) 1.516 0.018 Calpha-Cbeta CH1E-CH3E (Ala) 1.521 0.033 CH1E-CH1E (Ile,Thr,Val) 1.540 0.027 CH1E-CH2E (the rest) 1.530 0.020 N-Calpha NH1-CH1E (except Gly,Pro) 1.458 0.019 NH1-CH2G* (Gly) 1.451 0.016 N-CH1E (Pro) 1.466 --------------------Bond angles -------------------------Angle labeling Value --------------------C-N-Calpha C-NH1-CH1E (except Gly,Pro) 121.7 1.8 C-NH1-CH2G* (Gly) 120.6 1.7 C-N-CH1E (Pro) 122.6 5.0 Calpha-C-N CH1E-C-NH1 (except Gly,Pro) 116.2 2.0 CH2G*-C-NH1 (Gly) 116.4 2.1 CH1E-C-N (Pro) 116.9 1.5 Calpha-C-O CH1E-C-O (except Gly) 120.8 1.7 CH2G*-C-O (Gly) 120.8 -------------------18
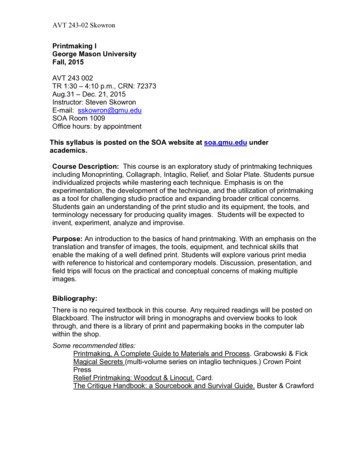
Procheck outputa. Ramachandran plot quality - percentageof the protein's residues that are in the coreregions of the Ramachandran plot.b. Peptide bond planarity - standarddeviation of the protein structure's omegatorsion angles.c. Bad non-bonded interactions - numberof bad contacts per 100 residues.d. Cα tetrahedral distortion - standarddeviation of the ζ torsion angle (Cα, N, C,and Cβ).e. Main-chain hydrogen bond energy standard deviation of the hydrogen bondenergies for main-chain hydrogen bonds.f. Overall G-factor - average of different Gfactors for each residue in the structure.Procheck output19
Procheck outputProcheck output20
Procheck output - backbone G factorsProcheck output - all atom G factors21
Secondary Structure Assignment DSSP StrideStructural classes of proteinsall αall βα/β22
Protein Structure ClassificationSCOP - Structural Classification of Proteinshttp://scop.mrc- lmb.cam.ac.uk/scop/FSSP - Fold classification based onStructure-Structure alignment of Proteinshttp://www.ebi.ac.uk/dali/CATH - Class, architecture, topology andhomologous lSCOP: Structural Classification of ProteinsEssentially manual classificationCurrent release: 1.6925973 PDB Entries (July 2005). 70859 Domains.http://scop.mrc- lmb.cam.ac.uk/scop/The SCOP database aims to provide a detailed and comprehensive descriptionof the structural and evolutionary relationships between all proteins whosestructure is known. Proteins are classified to reflect both structural andevolutionary relatedness. Many levels exist in the hierarchy; the principallevels are family, superfamily and foldFamily: Clear evolutionarily relationshipSuperfamily: Probable common evolutionary originFold: Major structural similarity23
SCOP: Structural Classification of ProteinsFamily: Clear evolutionarily relationshipProteins clustered together into families are clearly evolutionarilyrelated. Generally, this means that pairwise residue identitiesbetween the proteins are 30% and greater. However, in somecases similar functions and structures provide definitive evidenceof common descent in the absense of high sequence identity; forexample, many globins form a family though some membershave sequence identities of only 15%.SCOP: Structural Classification of ProteinsSuperfamily: Probable common evolutionary originProteins that have low sequence identities, but whose structuraland functional features suggest that a common evolutionaryorigin is probable are placed together in superfamilies. Forexample, actin, the ATPase domain of the heat shock protein, andhexakinase together form a superfamily.24
SCOP: Structural Classification of ProteinsFold: Major structural similarityProteins are defined as having a common fold if they have thesame major secondary structures in the same arrangement andwith the same topological connections. Different proteins withthe same fold often have peripheral elements of secondarystructure and turn regions that differ in size and conformation. Insome cases, these differing peripheral regions may comprise halfthe structure. Proteins placed together in the same fold categorymay not have a common evolutionary origin: the structuralsimilarities could arise just from the physics and chemistry ofproteins favoring certain packing arrangements and chaintopologies.SCOP StatisticsClassFoldsSuperfamiliesFamiliesAll alpha proteins179299480All beta proteins126248462Alpha and beta proteins (a/b)121199542Alpha and beta proteins (a b)234349567Multi-domain proteins383853Membrane and cell surface proteins 366673Small proteins6695150Total8001294232725
FSSP DatabaseEssentially automated classificationCurrent release: September 20053724 sequence families representing 30624 protein structuresThe FSSP database is based on exhaustive all-against-all 3Dstructure comparison of protein structures currently in theProtein Data Bank (PDB). The classification and alignmentsare automatically maintained and continuously updated usingthe Dali search engine.Structure processing for Dali/FSSPAdopted from Holm and Sander, 199826
Dali Domain Dictionaryhttp://www.ebi.ac.uk/dali/Structural domains are delineated automatically using thecriteria of recurrence and compactness. Each domain isassigned a Domain Classification number DC l m n p ,where:l - fold space attractor regionm - globular folding topologyn - functional familyp - sequence familyHierarchical clustering of folds in Dali/FSSPAdopted from Holm and Sander, 199827
Dali Domain DictionaryStructural domains aredelineated automaticallyusing the criteria ofrecurrence and compactness.Fold space attractor regionsα/β meanderα/ββ barrelsall βDensity distribution of domainsin fold space according to Daliall αDali Domain DictionaryFold typesFold types are defined asclusters of structuralneighbors in fold space withaverage pairwise Z-scores(by Dali) above 2.Structural neighbours of1urnA (top left). 1mli(bottom right) has the sametopology even though thereare shifts in the relativeorientation of secondarystructure elements28
Dali Domain DictionaryFunctional familiesThe third level of the classification infers plausibleevolutionary relationships from strong structural similaritieswhich are accompanied by functional or sequencesimilarities. Functional families are branches of the folddendrogram where all pairs have a high average neuralnetwork prediction for being homologous. The neuralnetwork weighs evidence coming from: overlappingsequence neighbours as detected by PSI-Blast, clusters ofidentically conserved functional residues, E.C. numbers,Swissprot keywords.Dali Domain DictionarySequence familiesThe fourth level of the classification is arepresentative subset of the Protein Data Bankextracted using a 25 % sequence identitythreshold. All-against-all structure comparisonwas carried out within the set of representatives.Homologues are only shown aligned to theirrepresentative.29
CATH - Protein Structure ClassificationCombines manual and automated classificationCurrent release: 2.6.0 (April 2005)http://www.cathdb.info/latest/index.htmlCATH is a novel hierarchical classification of proteindomain structures, which clusters proteins at four majorlevels:ClassArchitectureTopologyHomologous superfamilyCATH - Protein Structure Classification30
CATH - Protein Structure ClassificationClass, C-levelClass is determined according to the secondary structurecomposition and packing within the structure. It can beassigned automatically (90% of the known structures) andmanually.Three major classes:mainly-alphamainly-betaalpha-beta (alpha/beta and alpha beta)A fourth class is also identified which contains proteindomains which have low secondary structure content.CATH - Protein Structure ClassificationArchitecture, A- levelThis describes the overall shape of the domain structure asdetermined by the orientations of the secondary structuresbut ignores the connectivity between the secondarystructures.It is currently assigned manually using a simple descriptionof the secondary structure arrangement e.g. barrel or 3- layersandwich. Reference is made to the literature for well-knownarchitectures (e.g the beta-propellor or alpha four helixbundle).Procedures are being developed for automating this step.31
CATH - Protein Structure ClassificationTopology (Fold family), T-levelStructures are grouped into fold families at this leveldepending on both the overall shape and connectivity of thesecondary structures. This is done using the structurecomparison algorithm SSAP.Some fold families are very highly populated and arecurrently subdivided using a higher cutoff on the SSAPscore.CATH - Protein Structure ClassificationHomologous Superfamily, H- levelThis level groups together protein domains which are thoughtto share a common ancestor and can therefore be describedas homologous. Similarities are identified first by sequencecomparisons and subsequently by structure comparison usingSSAP.Structures are clustered into the same homologoussuperfamily if they satisfy one of the following criteria: Sequence identity 35%, 60% of larger structureequivalent to smaller SSAP score 80.0 and sequence identity 20%60% of larger structure equivalent to smaller SSAP score 80.0, 60% of larger structure equivalent tosmaller, and domains which have related functions32
CATH - Protein Structure ClassificationSequence families, S-levelStructures within each H-level are further clustered onsequence identity. Domains clustered in the same sequencefamilies have sequence identities 35% (with at least 60% ofthe larger domain equivalent to the smaller), indicatinghighly similar structures and functions.Predicting Protein Structure from theAmino Acid Sequence Goal: Predict the 3-dimensional (tertiary) structure of aprotein from the sequence of amino acids (primarystructure). Sequence similarity methods predict secondary and tertiarystructure based on homology to know proteins. Secondary structure predictions methods include ChouFasman, GOR, neural network, and nearest neighbormethods. Tertiary structure prediction methods include energyminimization, molecular dynamics, and stochastic searchesof conformational space.33
Evolutionary MethodsTaking into account related sequences helps inidentification of “structurally important” residues.Algorithm:find similar sequencesconstruct multiple alignmentuse alignment profile for secondary structure predictionAdditional information used for predictionmutation statisticsresidue position in sequencesequence lengthSequence similarity methods forstructure prediction These methods can be very accurate if there is 50%sequence similarity. They are rarely accurate if the sequence similarity 30%. They use similar methods as used for sequence alignmentsuch as the dynamic programming algorithm, hiddenmarkov models, and clustering algorithms.34
Secondary Structure PredictionAlgorithms These methods are 70-75% accurate at predictingsecondary structure. A few examples are– Chou Fasman Algorithm– Garnier-Osguthorpe-Robson (GOR) method– Neural network models– Nearest-neighbor methodSecondary Structure PredictionThree-state model: helix, strand, coilGiven a protein sequence:– NWVLSTAADMQGVVTDGMASGLDKD.Predict a secondary structure sequence:– LLEEEELLLLHHHHHHHHHHLHHHL.Methods: statistical stereochemicalAccuracy: 50-85%35
Statistical MethodsResidue conformational preferences:Glu, Ala, Leu, Met, Gln, Lys, Arg - helixVal, Ile, Tyr, Cys, Trp, Phe, Thr - strandGly, Asn, Pro, Ser, Asp turnChou-Fasman algorithm:Identification of helix and sheet "nuclei"Propagation until termination criteria metChou-Fasman Algorithm Analyzed the frequency of the 20 amino acids in α helices,β sheets and turns. Ala (A), Glu (E), Leu (L), and Met (M) are strongpredictors of α helices. Pro (P) and Gly (G) break α helices. When 4 of 5 amino acids have a high probability of beingin an α helix, it predicts a α helix. When 3 of 5 amino acids have a high probability of beingin a β strand, it predicts a β strand. 4 amino acids are used to predict turns.36
Garnier-Osguthorpe-Robson Method Chou-Fasman assumes that each individual amino acidinfluences secondary structure. GOR assumes the the amino acids flanking the centralamino acid also influence the secondary structure. Hence, it uses a window of 17 amino acids (8 on each sideof the central amino acid). Each amino acid in the window acts independently oninfluencing structure (to save computational time). Certain pair-wise combinations of amino acids in thewindow also contribute to influencing structure.Garnier - Osguthorpe - Robson(GOR) AlgorithmLikelihood of a secondary structure state depends onthe neighboring residues:L(S j) Σ (S j;Rj m)Window size - [j-8; j 8] residuesAccuracy for a single sequence - 60%Accuracy for an alignment - 65%37
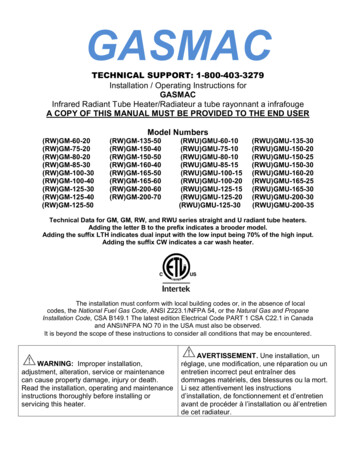
Neural Networks MethodsHelixSheetOutput layer(2 units)Hidden layer(2 units)Input layer(7x21 units)MKFGNFLLTYQP [ PELSQTE ] VMKRLVNLGKASEGC.Rost and Sander Neural Network ModelFrom Bioinformatics: Sequence and Genome Analysisby David Mount38
Nearest Neighbor Method Like neural networks, this is another machine learningapproach to secondary structure prediction. A very large list of short sequence fragments is made bysliding a window (n 16) along a set of 100-400 trainingsequences of know structure but with minimal similarity. A same-size window is selected from the query sequenceand the 50 best matching sequences are found. The frequencies of the of the secondary structure of themiddle amino acid in each of the matching fragments isused to predict the secondary structure of the middle aminoacid in the query window. Can be very accurate (up to 86%).Hydrophobicity/Hydrophilicity Plots Charge amino acids arehydrophilic, i.e. Asp (D), Glu(E), Lys (K), Arg (R). Uncharged amino acids arehydrophobic, i.e. Ala (A), Leu(L) Ile (I), Val (V), Phe (F), Trp(W), Met (M), Pro (P). In an α helix, hydrophobic aminoacids might line up on one side,which suggests that that side ison the interior of a protein orprotein complex.From Bioinformatics: Sequence and Genome Analysisby David Mount – Helicalwheel plot by GCG39
Stereochemical MethodsPatterns of hydrophobic and hydrophilic residuesin secondary structure elements: segregation of hydrophobic and hydrophilic residues hydrophobic residues in the positions 1-2-5 and 1-4-5 oppositely charged polar residues in the positions1-5 and 1-4 (e.g. Glu (i), Lys (i 4))Definitions of hydrophobic and hydrophilicresidues (hydrophobicity scales) are ambiguousStereochemical MethodsHydropathic correlations in helices and sheetsαβF-FF-LL-FL-Li, i 2- -i, i 3 -- i, i 4 -- i, i 5- -i, i 1- -i, i 2 -- i, i 3- -40
Accuracy of predictionEVA (http://cubic.bioc.columbia.edu/eva/)Accuracy of PredictionPH PE PCQ3 NW logTP x TNFP x FNRange: 50-85%41
Energy Potential Functions Contains terms for electrostatic interatction, van der Walsforces, hydrogen bonding, bond angle and bond lengthenergies. Common software packages have their ownimplementation: Charmm, ECEPP, Amber, Gromos, andCVF. Structural predictions only as good as the assumptionsupon which it is based (mainly the energy potentialfunction).Bonded TermsBond LengthEbond-length Σ bonds kb(r – r0 )2Bond AngleEbond-angle Σ angle kθ (θ – θ0 )2rθ42
Bonded TermsDihedral AngleEdihedral-angle Σ dihedrals Kφ (1 cos [nφ(R)-γ]φφNon-Bonded TermsLennard-Jones potential (van der Waals force)EvdW Σ i,j Aij/rij12 – Bij/rij6repulsivedispersionElectrostatic interactionsrEelec Σ i,j qiqj/(4πε 0εrrij)ε0 permittivity of free spaceεr dielectric constant of medium around charges43
Non-Bonded TermsHydrogen Bonding – Some atoms (O, N, and to a lesserdegree S) are electronegative, i.e. the attact electrons to filltheir valence shells. Hydrogen tends to donate electrons tothese atoms forming hydrogen bonds. This is common inwater.Salt Bridges – A positively charged lysine or arginine residuecan form a strong interaction with a negatively chargedaspartic acid or glutamic acid residue.Energy Minimization Assumes that proteins are found at or near the lowestenergy conformation. Uses a empirical function that describes the interaction ofdifferent parts of the protein with each other (energypotential function). Searches conformation space to find the global minimumusing optimization techniques such as steepest descentsand conjugate gradients. To avoid the multiple- minima problem, approaches such asdynamic programming, or simulated annealing have beenused.44
Molecular DynamicsFi miaiMotionforce by Newton’s Second Law ofai dvi/dtaccelerationvi dri /dtvelocity-dE/dri FiWork force x distance-dE/dri mi d2 ri/dt2put it all togetherMolecular Dynamics Model System – Choose protein model, energy potentialfunction, ensemble, and boundary conditions. Initial Conditions – Need initial positions of the atoms, aninitial distribution of the velocities (assume no momentumi.e. Σ i mi vi 0), and the acceleration which is determined bythe potential energy function. Boundary Conditions – If water molecules are not beingexplicitly included in the potential function, the solventboundary conditions must be imposed. The water moleculesmust not diffuse away from the protein. Also, usually alimited number of solvent molecules are included.45
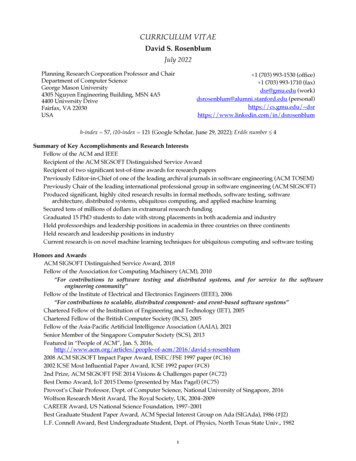
Molecular Dynamics Result– The result of the simulation is a time series of thetrajectories (path) followed by the atoms governed byNewton’s law of motion.– The time scales are usually very small (picoseconds).– The motion of the molecule can be seen.– The motion will move the atoms into the nearequilibrium conformation of the protein.Delaunay Tessellation of Protein StructureD (Asp)Ca or center of massAbstract each amino acid to a pointAtomic coords – Protein Data Bank (PDB)A22L6D3F7G62K4S64R5C63Delaunay tessellation: 3D “tiling” of space into non-overlapping,irregular tetrahedral simplices. Each simplex objectively definesa quadruplet of nearest-neighbor amino acids at its vertices.46
Counting Amino Acid QuadrupletsOrdered quadruplets: 20 4 160,000 (too many)Order-independent quadruplets (our approach):C D E F 20 4 C C D E 19 20 2 C C D D 20 2 C C C D2019 C C C C20Total: 8,855 distinct unordered quadrupletsFour-Body Statistical PotentialTraining set: over 1,000 diversehigh-resolution x-ray structuresPDBTessellate 1bniAbarnase1jliIL-31efaBlac repressor3lzmt4 lysozymePool together the simplices from all tessellations, andcompute observed frequencies of simplicial quadruplets.47
Four-Body Statistical Potential Modeled after Boltzmann potential of mean force:? Ei –KT ln(pi / pref) For amino acid quadruplet (i,j,k,l), a log-likelihood score(“pseudo-energy”) is given by s(i,j,k,l) log(f ijkl / pijkl) f ijkl proportion of training set simplices whose four vertexresidues are i,j,k,l pijkl rate expected by chance (multinomial distribution, based ontraining set proportions of residues i,j,k,l) Four-body statistical potential: the collection of 8855 quadruplet(or simplex) types and their respective log- likelihood scoresApplication: Protein Topological Score Global measure of sequence-structure compatibility Obtained by summing log-likelihood scores of allsimplicial quadruplets defined by the tessellationS ? î s(î), sum taken over all simplexquadruplets î in the entire tessellation.s(R,D,A,L)A22L6 s(R,G,F,L)F7D3s(R,D,K,S)G62K4S64R5s(R,S,C,G)C6348
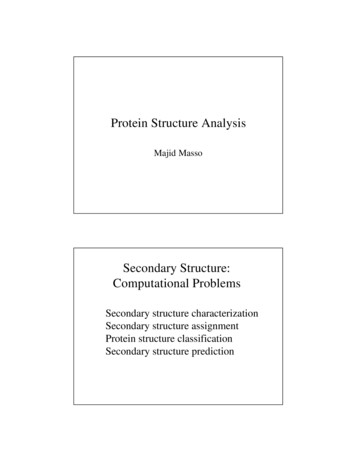
Application: Residue Environment Scores For each amino acid position, locally sum the scores ofonly simplices that use the amino acid point as a vertexs(R,D,A,L)A22L6 s(R,G,F,L)F7D3s(R,D,K,S)G62K4S64R5q5 q(R5) ? î s(î), sum takenover only simplex quadruplets îthat contain amino acid R5s(R,S,C,G)C63 The scores of all the amino acid positions in the proteinstructure form a Potential Profile vector Q q1, ,qN (N length of primary sequence in the solved structure)Computational Mutagenesis Methodology Observation: mutant and wild type (wt) protein structuretessellations are very similar or identical Approach: obtain mutant topological score and potential profilefrom wt structure tessellation, by changing residue labels at pointsand re-computings(I,D,A,L) Residual Score mutant – wttopological scores Smut – SwtA22L6 s(I,G,F,L)F7D3s(I,D,K,S) Residual Profile mutant – wtpotential profiles Qmut – QwtG62K4S64R5 à I5s(I,S,C,G)C63 For single point mutants only,residual score º residual profilecomponent at the mutant position49
SCOP: Structural Classification of Proteins Superfamily: Probable common evolutionary origin Proteins that have low sequence identities, but whose structural and functional features suggest that a common evolutionary origin is probable are placed together in superfamilies. For example, actin, the ATPase domain of the heat shock protein, and