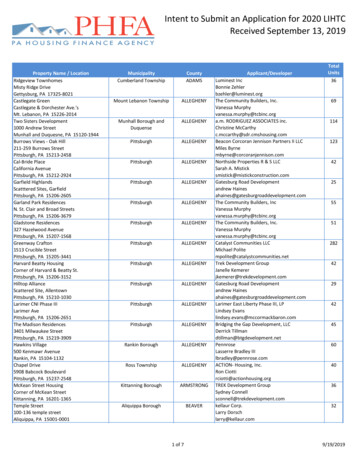
Transcription
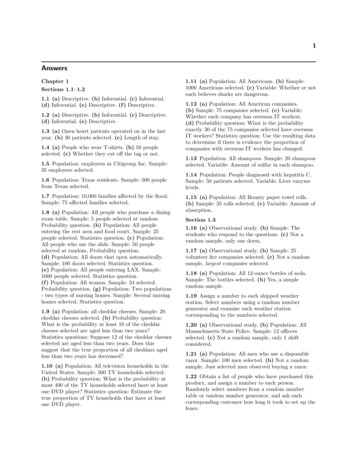
1AnswersChapter 1Sections 1.1–1.21.1 (a) Descriptive. (b) Inferential. (c) Inferential.(d) Inferential. (e) Descriptive. (f ) Descriptive.1.2 (a) Descriptive. (b) Inferential. (c) Descriptive.(d) Inferential. (e) Descriptive.1.3 (a) Open heart patients operated on in the lastyear. (b) 30 patients selected. (c) Length of stay.1.4 (a) People who wear T-shirts. (b) 50 peopleselected. (c) Whether they cut off the tag or not.1.5 Population: employees at Citigroup Inc. Sample:35 employees selected.1.6 Population: Texas residents. Sample: 500 peoplefrom Texas selected.1.7 Population: 10,000 families affected by the flood.Sample: 75 affected families selected.1.11 (a) Population: All Americans. (b) Sample:1000 Americans selected. (c) Variable: Whether or noteach believes sharks are dangerous.1.12 (a) Population: All American companies.(b) Sample: 75 companies selected. (c) Variable:Whether each company has overseas IT workers.(d) Probability question: What is the probabilityexactly 30 of the 75 companies selected have overseasIT workers? Statistics question: Use the resulting datato determine if there is evidence the proportion ofcompanies with overseas IT workers has changed.1.13 Population: All shampoos. Sample: 20 shampoosselected. Variable: Amount of sulfur in each shampoo.1.14 Population: People diagnosed with hepatitis C.Sample: 50 patients selected. Variable: Liver enzymelevels.1.15 (a) Population: All Bounty paper towel rolls.(b) Sample: 35 rolls selected. (c) Variable: Amount ofabsorption.1.8 (a) Population: All people who purchase a diningroom table. Sample: 5 people selected at random.Probability question. (b) Population: All peopleentering the rest area and food court. Sample: 25people selected. Statistics question. (c) Population:All people who use the slide. Sample: 50 peopleselected at random. Probability question.(d) Population: All doors that open automatically.Sample: 100 doors selected. Statistics question.(e) Population: All people entering LAX. Sample:1000 people selected. Statistics question.(f ) Population: All women. Sample: 34 selected.Probability question. (g) Population: Two populations- two types of nursing homes. Sample: Several nursinghomes selected. Statistics question.1.17 (a) Observational study. (b) Sample: 25volunteer fire companies selected. (c) Not a randomsample, largest companies selected.1.9 (a) Population: all cheddar cheeses. Sample: 20cheddar cheeses selected. (b) Probability question:What is the probability at least 10 of the cheddarcheeses selected are aged less than two years?Statistics questions: Suppose 12 of the cheddar cheesesselected are aged less than two years. Does thissuggest that the true proportion of all cheddars agedless than two years has decreased?1.20 (a) Observational study. (b) Population: AllMassachusetts State Police. Sample: 12 officersselected. (c) Not a random sample, only 1 shiftconsidered.1.10 (a) Population: All television households in theUnited States. Sample: 500 TV households selected.(b) Probability question: What is the probability atmost 400 of the TV households selected have at leastone DVD player? Statistics question: Estimate thetrue proportion of TV households that have at leastone DVD player.Section 1.31.16 (a) Observational study. (b) Sample: Thestudents who respond to the questions. (c) Not arandom sample, only one dorm.1.18 (a) Population: All 12-ounce bottles of soda.Sample: The bottles selected. (b) Yes, a simplerandom sample.1.19 Assign a number to each shipped weatherstation. Select numbers using a random numbergenerator and examine each weather stationcorresponding to the numbers selected.1.21 (a) Population: All men who use a disposablerazor. Sample: 100 men selected. (b) Not a randomsample. Just selected men observed buying a razor.1.22 Obtain a list of people who have purchased thisproduct, and assign a number to each person.Randomly select numbers from a random numbertable or random number generator, and ask eachcorresponding customer how long it took to set up thefence.
21.23 Assign a number to each challenge. Randomlyselect numbers from a random number table orrandom number generator.Section 2.22.101.24 (a) Assign a number to each mile-long stretch.Randomly select numbers from a random numbertable or random number generator. (b) Observationalstudy.1.25 (a) Experimental study. (b) Variable: Lifetimeof each blossom. (c) Flip a coin: heads is treated, tailsis untreated.1.26 (a) Experimental study. (b) Variable: Whichcar is most comfortable. (c) Conversation with thedriver, peeking, sound of the engine, legroom.2.2 (a) Numerical, continuous. (b) Numerical,discrete. (c) Numerical, continuous. (d) Numerical,continuous. (e) Categorical. (f ) Categorical.2.9 (a) Discrete. (b) Categorical. (c) Continuous.(d) Continuous. (e) Categorical. (f ) Continuous.421.0000RelativeFrequency equency mp 802001.000(a) 200 (b) Trump Plaza: largest (relative) frequency.2.13(a)RelativeFrequency FrequencyIssue(b)SalaryHealth InsuranceRetirement BenefitsClass SizeTemporary 00.22500.6250Total4001.00001201002.6 (a) Continuous. (b) Continuous. (c) Discrete.(d) Continuous. (e) Continuous. (f ) Discrete.80Frequency2.8 (a) Continuous. (b) Discrete. (c) Continuous.(d) Discrete. (e) Categorical. (f ) Categorical.TotalClass2.4 (a) Numerical, discrete. (b) Numerical,continuous. (c) Categorical. (d) Categorical.(e) Categorical. (f ) Numerical, discrete.2.7 (a) Continuous. (b) Discrete. (c) Discrete.(d) Continuous. (e) Discrete. (f ) .3 (a) Numerical, discrete. (b) Numerical, discrete.(c) Categorical. (d) Numerical, continuous.(e) Numerical, continuous. (f ) Categorical.2.5 (a) Continuous. (b) Continuous. (c) Discrete.(d) Continuous. (e) Continuous. (f ) Discrete.71037105ArtChapter 2Section 2.12.1 (a) Numerical, continuous. (b) Numerical,discrete. (c) Categorical. (d) Numerical, discrete.(e) Numerical, continuous. (f ) s2.111.27 (a) Population: All ceramic tile from thismanufacturer. Sample: 25 tiles selected. (b) Not arandom sample. All tiles from the same box.1.28 (a) Observational study. (b) Variables:proportion of white feathers, proportion of down,proportion of other components. (c) Randomly selectstores from around the country that sell comforters.Visit the selected stores, and randomly purchasecomforters on display.RelativeFrequency FrequencyCategory6040200SalHIRBIssueCSTFPark
32.14(a)2.16(a) PoliticalRelativeaffiliation Frequency FrequencyRelativeFrequency mocratPSfrag replacementsIndependentRepublican(b) 0250.000ACa ChGLi Lv Ma MePSc SuCounty2.15(a)RelativeAnswer Frequency FrequencyVLLNUVU8127815Total50PSfrag replacementsNeutralUnlikelyUnited StatesUnited KingdomGermanyFranceSwedenSwitzerlandAll 4420.03240.1917Total6781.0000(b)PSfrag replacements0.160.240.140.160.30United StatesUnited KingdomAll othersGermany1.00Likely(b)RelativeFrequency FrequencyVery LikelyVery 490.17570.1014Total1481.0000
cy 7140.22860.20000.11430.08571751.0000(b) 175 (c) 0.5714Budget(d)PSfrag replacementsPSfrag replacementsAvisACAlamoEnterpriseEValueD(c) 148; 0.8986ThriftyHertz2.19(a)Ice CreamRelativeFrequency frequencyThe Big DigCashew TurtleChocolate ChipPistachioStrawberryVanilla with 252001.0002.21(a)ResponseRelativeFrequency frequencyExcellentVery Frequency3003020200100100Ex0Big Dig C TurCCPistStrawVGVanGoodFairPoorResponseIce CreamCashew TurtleGoodVery GoodPSfrag ntThe Big DigPoorVanilla with OreosPistachioStrawberryFair(c) 0.7980
52.22(a) Table sawRelativebrandFrequency .00990.01(b)Relative 200010BDCraftDelta DeWalt MakitaTable saw brandCraftsman(c) 0.3214 (d) 0.7857Relativefrequency(b)Relative sBuilding MaterialsElectrical EquipmentHazmat StorageSecurity ProductsSignaling SystemsBlack & DeckerMakitaRelative Frequency2002Year(c) Both graphs show an increase, each with a largejump in 2004.DeWalt2000200120022003200420012.24(a) ProductDeltaPSfrag 032004EEHSSPSS
6 lersBuilding windowAlarmsVehicle windowPSfrag replacementsSignaling SystemsBuilding MaterialsSecurity ProductsElectrical EquipmentHazmat Storage2.25(a) BookRelativetypeFrequency 0(b) 0.25LampsTableware2.27(a) 0.40.35Relative nologyContainers0.30.250.20.150.10.050Relative FrequencyChildRelFinPSfrag MedSciTechBook typeEducationMedicineTechnologyScience(c) Perhaps medicine. However, no book type isoverwhelmingly ctWork-life issuesFrequency(b) IssueLawLiteraturePSfrag replacementsRelative ildrenFinancesReligionWork-life 40.38790.2069
PSfrag replacements7Brookings(b) son2.302 years(a)PSfrag replacementsMore than two years1 year6 monthsStucco1 monthDon’t knowAluminumPSfrag replacementsUntil thrivingVinyl2.29(a) 0660.0413(b)500Frequency4003002001000AE Br Ca CB EP ES He Hu II Mi PP UrThink tank(b) Length of timeFrequencyOne monthSix monthsOne yearTwo yearsMore than two yearsUntil thrivingDon’t manySlovakiaSpainUnited KingdomNorwayPolandCanadaUnited 0.08430.1506
00.10300.23330.25000.11000.24000.1667ExcellentVery GoodGoodFairPoor3002001000Sw Fr Au It Ge Sl Sp UK No PO Ca USCountryRelative FrequencyRelative Frequency0.25(b)0.30.20.150.10.20.100.05Excel Very Good GoodFairPoorJob rating0Sw Fr Au It Ge Sl Sp UK No PO Ca USCountryThe graphs are the same except for the scale (label)PSfragon replacementsthe vertical axis.2.34(a) 0.8ShotgunAir/Gas gunBowCrossbow¾¾ Unknown OtherHandgunPSfrag 5-5455-6465 Age group(b) No. We do not know the frequency in each agegroup.PheasantSection e Frequency2.32(a)(c) The total number of men who responded isdifferent from the total number of women whoresponded.Duck/Geese(c) No. These two tables do not show the weapon andthe game involved with each injury.2.352334455667795666 911277901124577891444681
9Stem: ones; Leaf: tenths.The center of the data is between 5.0 and 5.5. Atypical value is 2244490445689245669917Stem: hundreds and tens; Leaf: 112334677770029Stem: hundreds and tens; Leaf: ones.The center of the data is between 545 and 550. Atypical value is 1702Stem: thousands and hundreds; Leaf: tens.Outliers: 474, 520, 1408, 14242.39 (a) 543, 543, 549. (b) 574 (c) The data tails offslowly on the low end. (d) There do not appear to beany 780Stem: thousands; Leaf: hundreds.(b)13 901415 0516 45 4517 17 19181920 6721 19222324 30 49 9725 73 842627 30 6728 40 4429 9130 21 2431 24 9232 15 28 923334 26 66 693536 6437 3938 30394041424344454647484950 86Stem: thousands and hundreds; Leaf: tens and ones.(c) Neither plot presents a very good picture of thedistribution. The first is too compact, and the secondis very spread out. The second plot is slightly better.
44401236792583Stem: ones; Leaf: tenths.(b)0 41 162 127793 34494 01111255557995 6996 0234447 01236798 2589 3Stem: ones; Leaf: tenths.(c) These two graphs are identical. Typical value 33334444445667891Stem: tens; Leaf: ones.(b)6 8997 01347 556677778898 00001111112222333334444448 5667899 1Stem: tens; Leaf: ones.(c) The second plot is better: two more stems,presents a better picture of the shape of thedistribution.2.43(a)Lower 006650Upper 9122234567888999022345888244(b) The lower floors distribution is more compact andhas, on average, smaller values. The upper floorsdistribution has more variability and has, on average,larger 55560245557770122235689022334452267262Stem: hundreds and tens;Leaf: ones.(b) Typical value: 400. One outlier: 69225981Stem: tens; Leaf: ones.(b) Typical value: 32. No outliers.
001222279900237923345028Stem: ones and tenths;Leaf: hundredths.(b) Unimodal, approximately symmetric, no 355002245566089273799122167781222247917763Stem: tens, ones, and tenths; Leaf: hundredths.(b) Typical time: 31.47. Little chance of winning.Only three winning times 31.70 or greater. (c) Splitbetween ones place and the tenths place: no, only twostems. Split between tens place and the ones place: no,only one stem.2.50(a)With0Stem: tens; Leaf: ones.(b) Typical value: 40. One outlier: 4559235889474601142Stem: ones and tenths;Leaf: hundredths.(b) Unimodal, positively skewed, lots of variability.(c) Typical lifetime: 11.5. Outliers: 19.4, 82336732623Stem: hundreds, tens, and ones;Leaf: tenths.(b) With distribution: unimodal, compact,approximately symmetric. Without distribution:unimodal, lots of variability, slightly positively skewed.It appears the humidifier does help a piano stay intune. The With humidifier distribution is morecompact and centered near 256.
123345400 410 420 430 440 450 460 470 480 490 5002.560.2Frequency0.150.10.0500.5 1 1.5 2 2.5 3 3.5 4 4.5 5 5.5 6 6.5 73Stem: tens; Leaf: ones.(b) Typical weight: 17. One outlier: 33.2.57CumulativeRelativerelativeClass Frequency frequency ss Frequency frequency frequencySection 2.42.5320–2222–2424–2626–2828–308Stem: ones; Leaf: tenths.(b) Yes. All durations are between 3 and 6 seconds,and a typical duration is near Class Frequency frequency eRelativerelativeClass Frequency frequency 00.93331.0000
132.59CumulativeRelativerelativeFrequency frequency CumulativeRelativerelativeClass Frequency frequency 3040506070802.62(a)CumulativeRelativerelativeClass Frequency frequency 1.002001234567890(b) Unimodal, symmetric, bell-shaped. (c) M 45(d) Q1 31.8 (e) Q3 13CumulativeRelativerelativeClass Frequency frequency frequency9 10 11 12 1320(b) Unimodal, negatively skewed. Two possibleoutliers: 0.5, 1.916Frequency1284036912151821Maximum wind speed2427
1410(b) Approximately symmetric. One possible outlier: iveFrequency frequency frequency42000.40.81.21.622.42.8Diamond weight(b)CumulativeRelativerelativeFrequency frequency .96671.0000Frequency610482050 100 150 200 250 300 350 400 450 500 550Cold cranking amps(a) Positively skewed. (b) M 110420CumulativeRelativerelativeClass Frequency frequency mond weight(c) The shapes are similar. The first frequencydistribution and histogram has one more class. Bothhistograms appear to be positively skewed.2.65(a) 0.25Relative US niacin intake182124
15Relative 2124Europe niacin intake(b) United States: unimodal, positively skewed.Europe: unimodal, negatively skewed. On average, itappears Europeans have a greater daily niacin ncyCumulativeRelativerelativeFrequency frequency frequency10105110115120125130135140(c) 0.4252.68(a)Class151050RelativeFrequency frequency Width 070.01430.01110.00620.00090.0007(b) The classes are of unequal width.(c)0.020.015Density(c) 24.220Air gap20Lug weight301003020 20.5 21 21.5 22 22.5 23 23.5 24 24.5 mulativeRelativerelativeFrequency frequency frequency0.010.0050050100Depth150200
162.69(a) 9Chapter Exercises2.72(a)Employment ) 1098Employed (white collar)Employed (blue .400.060.100.19Total5001.00(b) 200150FrequencyLength(b) Center is approximately 1464, little variability,and the shape is not symmetric, and not quitepositively skewed.RelativeFrequency frequency1005070Frequency6WCBCUEHMRet54Employed (white collar)32PSfrag replacementsEmployed(blue collar)10102030405060708090 100 110Penalty minutes(b) The distribution appears to be approximatelybimodal. Center: approximately 55. Lots of variability.(c) m 90.Unemployed2.73(a)122334452.71(a) 654FrequencyRetired321033.544.555.56Ice area(b) No discernible shape. Center around 4.5. Lots ofvariability. (c) Q1 3.45, Q3 5.25 (d) Should be0.5 40 20 values between Q1 and Q3 . There are 20values between Q1 and Q3 34892Stem: tenths; Leaf: hundredths.(b) Approximately bell-shaped, center around 32,little variability.
172.74(a)Social issue(b)HousingTransportationHealth 0.10980.15000.06960.13040.309010201.00000– ass Frequency frequency frequencyRelativeFrequency frequencyHousingPSfrag replacementsHealth CareEducationFoodOther815127667242211101(c) 0.3500 (d) 0.9304Totals75(c) 0.4667 (d) s Frequency frequency frequency65– 7010.020.0270– 7540.080.1075– 8070.140.2480– 85100.200.4485– 90120.240.6890– CumulativeRelativerelativeFrequency frequency 0.88440.94311.0000250820064150206570758085Peak noise level(c) 0.24 (d) 30.01330.01330.00000.0133100500502.76 (a) Positively skewed.100 150 200 250 300 350 400 450 500Selling Price(b) Positively skewed, center around 206, lots ofvariability. (c) Typical selling price around 200. Nooutliers. (d) 0.2330
182.78(a) Class2.80(a)Frequency Width 4120.05880.29410.35290.47060.52940.0021Class450– 500500– 550550– 600600– 650650– 700700– 750750– 800800– 850850– 900900– verelativeFrequency frequency 430330316Stem: tens and ones, Leaf: tenths.(b) New equipment times tend to be smaller, thedistribution is more compact. Traditional equipmenttimes are more spread out, and tend to be larger.(c) The new equipment times tend to be better,shorter response times. The majority of the times areless than the traditional equipment times.Frequency1086420500 550 600 650 700 750 800 850 900 950 1000Output(b) 0.1067(c)ClassRelativeFrequency frequencyExcellentVery GoodGoodFairPoorNot 0.0267Total751.0000PSfrag replacementsVery GoodExcellentNot ServiceablePoorGoodFair
192.81(a)(b)Placebo3025Frequency201510503456789 10 11 12 13 14DurationVitamin s Frequency frequency .710.890.991.0018516045678Duration(b) Both graphs appear to be centered at about thesame duration. Both appear to be symmetric andbell-shaped. The Placebo durations are slightly morecompact than the Vitamin C durations. (c) There isno graphical evidence to suggest Vitamin C reducedthe duration.012108642060646872768084889296AFUE(c) Negatively skewed, center around 86, lots ofvariability. One outlier: 60. (d) 0.09(e) 335Stem: tens, Leaf: ones.40Frequency2.82(a)666667777788888999149 10 11 12 13 14Frequency33020100ExcellentGoodFairAFUE classificationPoor
20Exercises0Chapter 3Section 3.12.83(a)CumulativeRelativerelativeClass Frequency frequency 0.98180–19010.021.00TotalCumulative rel. freq.(b)PSfrag replacements501.001 0.8 0.6 0.2 3.4 (a) 11.5 (b) 19 (c) 59 (d) 32.53.5 (a) 6.6667, 7 (b) 6.6364, 9 (c) 10.6889, 7.7(d) 107.69, 109.13.6 xe 5.5. There is an outlier (27) pulling the meanin its direction.3.7 (a) Skewed left. (b) Symmetric. (c) Skewed left.(d) Skewed left.3.8 (a) 30.75 (b) 76.1667 (c) 152.9167 (d) 6.953.11 (a) 68.5238 (b) 67.0 (c) Slightly skewed right. Game scoresRelativeFrequency frequencySmoking, .Heating equipmentCooking, .Children .Arson / 1.00(b)e 25514.5 (b) Skewed3.12 (a) x 25661.3333, xright.3.13 (a) x 6.5833, xe 6.4 (b) x 6.6944, xe 6.4.The mean is higher, pulled in the direction of the new,higher value. The median stays the same.e 0.3950 (b) 0.43333.14 (a) x 0.4730, xe 620.0 (b) 619.16673.15 (a) x 619.5, x(c) Approximately symmetric.3.16 (a) x 6.5357, xe 7.0 (b) mode 7.5.(c) x 17.6464, xe 18.9. The new values are 2.7times the values found in part (a).3.17 (a) x 80.0 (b) x 84. The new mean is 4more than the original mean.3.18 (a) x 10.0667 (b) x 22.5191. The new meanis the original mean times 2.237.Heating.Smoking.PSfrag replacementsCooking.3.3 (a) 105.7 (b) 13.1852 (c) 6.9583 (d) 0.1232(e) 2.4933 (f ) 17.74323.10 (a) 0.4286 (b) 0.7619 (c) 0.4100 110 120 130 140 150 160 170 180 1902.84(a)Class3.2 (a) 26727.4 (b) 1418420.806 (c) 447.4(d) 262963.84 (e) 0 (f ) 73.25713.9 (a) 6 (b) 0 (c) No mode. 0.43.1 (a) 82 (b) 3474 (c) 32 (d) 2779 (e) 164 (f ) 164Arson.Children.3.19 (a) x 12.0632, xe 12.0700 (b) Approximatelysymmetric. (c) 0.883.20 (a) x 627784.6, xe 121676.5 (b) Median:because of the outlier.3.21 (a) 0.8438 (b) 0.8438. The two values are thesame. (c) No. Need 36 successes to produce pb 0.9.Even if all 8 additional panels are successes, the totalnumber of successes will only be 35.3.22 (a) x 3.8917, xe 3.6550 (b) 3.7821 (c) Twomodes: 3.37 and 3.883.23 (a) x 61.3, xe 61.0 (b) 61.75 (c) mode 61
213.24 (a) x 16.5588, xe 15.1 (b) Skewed right.(c) There is no value that will make the sample meanequal to the sample median.3.25 (a) 38.325 (b) No. We need to know the 7thand 8th observations in the ordered list.3.26 (a) x5 9414 (b) x5 6250.753.27 Traditional: x 23.1429, xe 23.0Cooperative: x 26.4286, xe 25.0On average, the Cooperative learning scores are higherthan the traditional scores.3.28 75.8, 67.83.29 (a) xF 57.1667, xeF 57.5 (b) xC 13.9815(c) xC (xF 32)/1.83.30 x 1.7903, xe 1.5Section 3.23.31 (a) R 3.9, s2 2.1690, s 1.4728(b) R 20.6, s2 27.2812, s 5.2231(c) R 98.32, s2 1096.2665, s 33.1099(d) R 5.7, s2 2.5843, s 1.60763.32 (a) s2 323.7757, s 17.9938(b) s2 479.7322, s 21.9028(c) s2 31.3735, s 5.6012(d) s2 2.4892, s 1.57773.33 (a) 15.5, 45.5 (b) 10, 30 (c) 25.5, 75.5(d) 12.5, 36.53.34 (a) Q1 20, Q3 35, IQR 15(b) Q1 2.3, Q3 7.75, IQR 5.45(c) Q1 21, Q3 13, IQR 8(d) Q1 44.1, Q3 59.2, IQR 15.13.35 (a) s2 430.4, s 20.7461(b) s2 430.4, s 20.7461 Same.(c) s2 172160.0, s 414.9217 The same variance ismultiplied by 202 400, and the sample standarddeviation is multiplied by 20.3.41 (a) s2 4.2958, sL 2.0726, IQRL 2L(b) s2 12.2632, sM 3.5019, IQRM 5.5M(c) The More than two hours data set has morevariability.3.42 (a) Q1 300, Q3 401, IQR 101(b) Q1 300, Q3 401, IQR 101(c) 401 (d) 3003.43 (a) 158.1429 (b) (c) Same.3.44 (a) Q1 170, Q3 1187, IQR 1017(b) s2 483822.7967, s 695.5737(c) IQR 1162, s2 1022065.1714(d) The new values are larger. 3687 is much largerthan any other number in the data set. Thiscontributes more variability.3.45 (a) Q1 291, Q3 313, IQR 22(b) s2 536.4889, s 23.1622(c) IQR 22, s2 1160.3222(d) IQR is the same, s2 is larger. s2 is more sensitiveto outliers.3.46 (a) s2 234671415.9556, s 15318.9887(a) s2 190085861.8222, s 13787.1629(c) The sample variance and the sample standarddeviation are smaller for the number of flightsscheduled in August. Note: The new sample varianceis approximately (0.9)2 0.81 times the original, andthe new standard deviation is approximately 0.9 timesthe original. it is not an exact equality due torounding the number of scheduled flights to thenearest whole number.3.47 (a) 4.6667, 9.3333, 13
The Big Dig Cashew Turtle Chocolate Chip Pistachio Strawberry Vanilla with Oreos 2.20 (a) Relative Agency Frequency frequency Alamo 10 0:0571 Avis 25 0:1429 Budget 30 0:1714 Enterprise 40 0:2286 Hertz 35 0:2000 Thrifty 20 0:1143 Value 15 0:0857 Total 175 1:0000 (b) 175 (c) 0:5714 (d) PSfrag replacements Alamo Avis Budget Enterprise Hertz Thrifty

