Transcription
How To TradefPullbacks With 5 KeyTechnical Tools.By FXTechstrategy TeamHow To Trade Pullbacks With 5 Key Technical Tools Fromcwww.fxtechstrategy.com1
IntroductionTrading forex can be both interesting and rewarding if onecan spend the time learning how it really works. First youhave to build a base or foundation. That includesdeveloping a strategy that works for you, finding goodmoney management techniques and training your mind tobe disciplined in all facets of trading. Remember, at the endof the day you must muster up enough courage to pull thetrigger for any strategies developed to work.What you will learn in this article is a pullback tradingstrategy that utilizes stochastics, simple support andresistance as well as Fibonacci retracement ratios to timetrades in the direction of the primary trend. In my opinion,simple strategies work best in trading. And as simple asthis strategy appears, keep in mind that no system is a badsystem as long as it works and produces results for theowner. My honest advice is that you should stick to whatworks for you. If your strategy produces more winners(profits) than losers (losses) stick with it but re-evaluate itfrom time to time. This is because market conditions mightchange so re-evaluations allow you to incorporate newchanges in the market you trade into your strategy.fTerminology Used In This ArticleBefore we go into the discussion of this strategy, it isimportant for us to understand the key technical analysistools we will utilize in this strategy. Don't worry if you don'tfully grasp the definitions below. They will become clearerwhen I walk you through my strategy.How To Trade Pullbacks With 5 Key Technical Tools Fromcwww.fxtechstrategy.com2
StochasticsIt is based on the rule that, within a period of strongmarket action, a market will tend to close towards theupper end of the range, while in downtrends, the price willclose near the bottom of the range. Stochastics consists oftwo lines; %K and %D that oscillate between 0 and 100.Overbought and oversold conditions are functions of thisindicator, which could range between 80 on the upside and20 on the downside. In addition, stochastics sometimesproduces a divergence condition, which occurs when theindicator fails to confirm a move to a new price high or lowin the price action.fSupport and ResistanceResistance is a price level above the market where supplyis strong enough to overcome demand while support is aprice level below the market where demand is strongenough to overcome supply. Price highs and lows as welltrading ranges can exemplify support and resistance.Rectangle pattern tops and bottoms can serve as goodexamples of support and resistance levels.Fibonacci RatiosThese are a sequence of numbers in which each successivenumber is the sum of the two previous numbers: 1, 1, 2, 3,5, 8, 13, 21, 34, 55, 89, 144, 610, etc. Leonardo Fibonacci,an Italian born mathematician around 1170 discovered therelationship of what is now referred to as Fibonacci ratioswhile he was studying the Pyramid in Egypt.How To Trade Pullbacks With 5 Key Technical Tools Fromcwww.fxtechstrategy.com3
These numbers possess interrelationships, such as anygiven number is approximately 1.618 times the precedingnumber and any given number is approximately 0.618times the following number. Fibonacci levels are relevant totraders because markets often bounce off key Fibonacciprice levels. These levels can also act as support andresistance and can be used as projected profit targets.fCandlesticksThese is a way of displaying the relationship betweenopening and closing prices during a time interval.If the close is higher than the open - the candle is white.If the open is higher than the close - the candle is black.Now that the meanings of our technical tools areunderstood, we will now move on to the fundamentals ofthis strategy. The parameters are set below:1. The strategy takes a top-down approach to analyzeallowing it to start from the higher time frames (weeklycharts) and drill down to lower time frames (240minscharts)2. We look for overbought and oversold readings on thestochastics indicator after a pullback in an uptrend and arally in a downtrend.3. We then watch price actions at our defined support andresistance levels to see if it would hold or violate theselevels.How To Trade Pullbacks With 5 Key Technical Tools Fromcwww.fxtechstrategy.com4
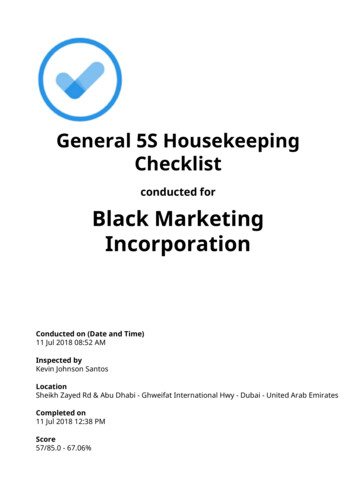
4. After establishing support and resistance, we will nowplot our Fibonacci ratios to determine which Fib levelscoincide with support and resistance zones, keeping an eyeon the stochastic extreme readings.f5. Our focus is on signals that are going in the direction ofthe primary trend. We do not take trades or open positionsagainst the primary trends, whether downtrends or uptrends.6. Lastly, we use reversal candle patterns as our entrytriggers. These reversal candle patterns include hammers,bullish engulfing patterns and dojis etc.7. Putting it altogether: A close above the high of theprevious day’s low when the stochastic indicator crossesover from the oversold zone and is above 20 (reading)coinciding with our established support andresistance/Fibonacci retracement and a reversal candlestickpattern gives us an entry.Step OneEstablishing A Trend: Establish an uptrend (downtrend)on the weekly time frame. In this case, EMAs (50,100 &200) and trendlines are used to determine the direction ofthe main trend. Below is a weekly chart of EURNZD cross,which has been in an uptrend since July 2007.How To Trade Pullbacks With 5 Key Technical Tools Fromcwww.fxtechstrategy.com5
fFigure 1How To Trade Pullbacks With 5 Key Technical Tools Fromcwww.fxtechstrategy.com6
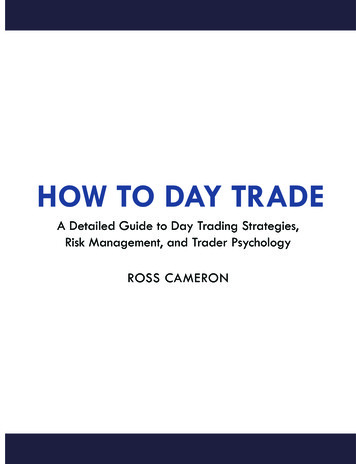
Step TwoMonitoring Pullbacks: After determining thedirection of the trend on the weekly time frame, wewill drill down to the daily chart to establish thetrend (in the direction of the weekly trend) andmonitor pullbacks to know if it meets our strategyas defined above.As you can see below, a pullback is already in placeand price has moved into our defined support zone.However, we still need to drill down further to 240minute chart to see what price action and thestochastic indicator are doing. If price is hesitatingor consolidating while stochastic is oversold, wethen look for a reversal candle and a bullishstochastic crossover above oversold zone (readingabove 20).fHow To Trade Pullbacks With 5 Key Technical Tools Fromcwww.fxtechstrategy.com7
fFigure 2How To Trade Pullbacks With 5 Key Technical Tools Fromcwww.fxtechstrategy.com8
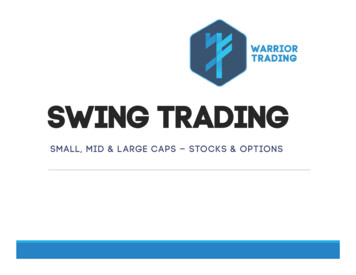
Step ThreeOn the 240-minute chart, price actually stalled ahead of ourdefined support and Fibonacci levels from the daily chart and afew ours later closed above the previous bearish candle to forma bullish candle pattern (bullish harami pattern). Furthermore,our stochastic indicator has already turned bullish above theoversold zone on the formation of the bullish engulfing patterngiving us an entry on the formation of the next candle. Stoplosses are set 10 pips below the reversal candle.fHow To Trade Pullbacks With 5 Key Technical Tools Fromcwww.fxtechstrategy.com9
ConclusionThis strategy works on both downtrends and uptrendsprovided its defined parameters are followed. I use it as aswing trading strategy but for those interested in using itfor day trading, a little adjustment might be needed. Also,refining your entries for low risk trades may take you belowthe 240mins chart, it is still all right as long as you aretrading in the direction of the main trend. Depending onhow you want to use the strategy, either as day trading orswing trading you can set your exit points based on yourpreferences but for me, I like using trailing stops. As statedin the beginning, simplify, simplify, simplify are the words Iread every day as I begin my trading day. I love simplestrategies because they work.fRecommended:Premium Technical Reports For Forex and CommodityTradersThe Professional Suite – Our Most Popular AndValuable Subscription ServiceHow To Trade Pullbacks With 5 Key Technical Tools Fromcwww.fxtechstrategy.com10
Monitoring Pullbacks: After determining the will drill down to the daily chart to establish the trend (in the direction of the weekly trend) and monitor pullbacks to know if it meets our strategy as defined above. As you can see below, a pullback is already in place and price has moved into our defined support zone.