Transcription
Seeking Historical Ground Deformations from Archival AerialPhotographyRobert PAQUET and Harvey MITCHELL, AustraliaKeywords: Deformation measurement; aerial photogrammetry; digital elevation modelsSUMMARYAttempts to monitor ground subsidence caused by mining can mean that past records of theground surface are wanted, but of course they are not always available. Historical aerialphotographs present themselves as a source of ground surface data waiting to be processed.The effect of longwall mining on surface subsidence is essential in the prediction of this effectfor future longwalls. This assessment is primarily empirical as it is difficult to account for theunknown geological variables and their effect on the ground surface. The aim of theprediction of ground subsidence due to mining is to protect the integrity of natural featuresand man-made infrastructure on the surface. Traditionally subsidence is measured andmonitored by surveyors on foot. The surveys are of high accuracy, observing subsidencealong the centre-line and cross-lines of the longwalls, and along lines of local interest (roads,etc). It is felt that 3D data observed remotely could bring further light on the shape of thesubsidence trough, although the same level of accuracy as that observed by surveyors on footwould not be attained. Archival photography could be used to assess the subsidence troughwhere subsidence data does not exist. Aerial photographs taken at three epochs over twodecades over a coal mine south of Newcastle have been examined to see whether any usefulground change information can be gleaned from them. The photography, having not beentaken for this purpose, is not ideal, and various detective tasks have been undertaken in aneffort to detect change in landform in the face of the various difficulties: the scale of thephotography is not as large as desirable; coverage of individual images is inconsistent fromone epoch to another; camera calibration information has not been available; and controlpoints have been hard to place when the cultural and natural features have changed.Moreover, control points can be influenced by the deformation being studied. Comparingsurfaces without using control is a novel approach. It can be affected by inappropriate surfacemodels across areas of water and wide areas of ever-changing vegetation. Experiences in thematching of surface models without control points and the lessons learnt from it will bereported.TS 8D - Photogrammetry, RMS and Image Data ProcessingRobert Paquet and Harvey MitchellSeeking Historical Gound Deformations form Archival Aerial PhotographyFIG Congress 2010Facing the Challenges – Building the CapacitySydney, Australia, 11-16 April 20101/12
Seeking Historical Ground Deformations from Archival AerialPhotographyRobert PAQUET and Harvey MITCHELL, Australia1. BACKGROUNDThe investigation concerns the detection of ground subsidence due to the longwall method ofunderground coal mining. Longwall coal mining is widely used in Australia. Coal mining is asignificant industry for the economy of the state of New South Wales in which the study islocated. Indeed, coal mining is so extensive in the valley of the Hunter River as well asfurther afield in the hinterland, that Newcastle, at the mouth of the Hunter River, is currentlythe largest coal exporting port in the world. In the latter half of last century, the coal miningindustry turned towards longwall mining methods (where appropriate), whose characteristic isa full extraction of the coal within a panel. The panels can measure in excess of threekilometres in length by up to more than 400m in width (typically 200-350m). The longwallpanels are separated by large pillars which support the roof above access and ventilationroadways. A consequence of the method is that the overburden above the longwall minecollapses almost immediately behind the extraction face. Evidence of subsidence is likely tobe found at the surface as the overburden fills up the mining void. The extent of thesubsidence effects is function of the extraction thickness, the overburden nature and thickness,and the mine geometry. This obviously can have important consequences for the surfaceinfrastructure, notably buildings, roads, railway lines, subterranean cables and pipelines. Thisstudy was initiated by the subsidence group of Industry and Investment NSW, in collaborationwith the surveying section of the University of Newcastle, NSW. The aim of the project waseducational, providing tertiary students with a final year project subject. It also serves thepurpose of examining the feasibility of using archival photogrammetric data to revisit pastland deformation events due to mining.2. OPTIONS FOR DEFORMATION DETECTIONSubsidence is easily measured and monitored by surveyors on foot. Those surveys aretypically of high accuracy, with emphasis on the observing of subsidence along the centre-lineand cross-lines of the longwalls, and along lines of local interest, such as roads. It is felt that3D data observed remotely could bring further light on the shape of the subsidence trough,although the same level of accuracy as that observed by surveyors on foot would not beattained. Archival photography could be used to assess the subsidence trough wheresubsidence data does not exist. However, the determination of landform subsidence fromhistorical aerial photography has a number of characteristics that make it problematical.Because the photography is historical, permanent visible ground markers which might bemonitored are not available. Although ordinary ground points may reveal any subsidence, itis felt that 3D data observed remotely could bring further light on the broader shape of thesubsidence trough, even though the same level of accuracy as that observed by surveyors onfoot would not be attained. Archival photography could be used to assess the subsidencetrough in those cases where subsidence data does not exist. To this end, DEMs can be createdTS 8D - Photogrammetry, RMS and Image Data ProcessingRobert Paquet and Harvey MitchellSeeking Historical Gound Deformations form Archival Aerial PhotographyFIG Congress 2010Facing the Challenges – Building the CapacitySydney, Australia, 11-16 April 20102/12
from aerial photography to enable change in surface shape to be detected by a simplecomparison of topographies.Control points are normally used in DEM creation, of course, to place surface models on acommon datum, but placing control for historical photographs can be difficult when theground features in terms of both vegetation and visible infrastructure have changed. Moreimportantly, ground control is expensive, and the resources required for placing precisecontrol may be hard to justify when the likelihood of detecting any ground subsidence is low.If the aerial photography technique is to be used to monitor a large number of mines, the costmay be unjustifiable. Only in the event of possible expensive consequences of subsidencewill the cost of control be worth bearing.For these reasons, a different approach, which is somewhat novel and which is the real subjectof this investigation, has been adopted here: the digital elevation models from the same areasare placed only approximately in the same datum, but then compared by a surface matchingtechnique. The surface matching technique rotates and re-positions one surface relative toanother, until the position of closest fit is obtained where surface separations are minimised.It uses a least squares technique based on conformal coordinate transformations.The residual differences between the two aligned models can be examined to see whether anyground subsidence is apparent. In practice, the appropriate stereo-pairs of photographs maybe firstly controlled inexactly by minimal and/or approximate, low cost (e.g. kinetic GPS)ground survey. Further details of the theory are given by various writers on the topic, but thewriters’ approach is described by Pâquet (2004) and by Mitchell and Chadwick (1999).The analysis of the residuals requires that we recognise that there are three distinct causes ofdifferences between the surface models:- The noise in the DEMs, due to the non-systematic errors, primarily the errors occurring inimage matching at the DEM creation stage.- Changes other than subsidence, in vegetation and cultural features, which is especiallylikely for roads and buildings due to mining work in sites where subsidence is being studied.In this category we can also include errors which can occur matching over water.- The subsidence under investigation, which may be small, even of a magnitude which issimilar to the noise level, especially on historical photography which is not purposely takenfor subsidence detection and which is of lower historical quality. It must be emphasised thatthe subsidence is presumably regional rather than randomly distributed.The approach being followed here to cope with noise is firstly to provide a quantified estimateof the level of noise by matching two elevation models created from different stereo-pairsfrom the same era. A poorer level of precision for the DEM matching from different epochswill be taken as a sign of significant differences between the DEMs, perhaps due tosubsidence, but also perhaps due to the vegetation and cultural changes.TS 8D - Photogrammetry, RMS and Image Data ProcessingRobert Paquet and Harvey MitchellSeeking Historical Gound Deformations form Archival Aerial PhotographyFIG Congress 2010Facing the Challenges – Building the CapacitySydney, Australia, 11-16 April 20103/12
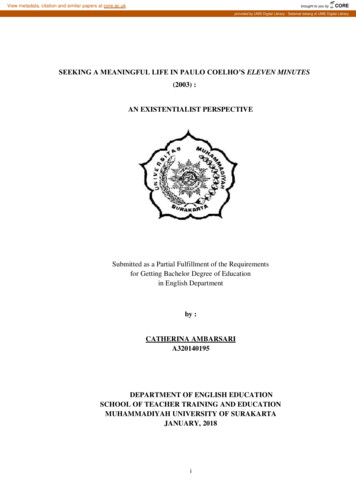
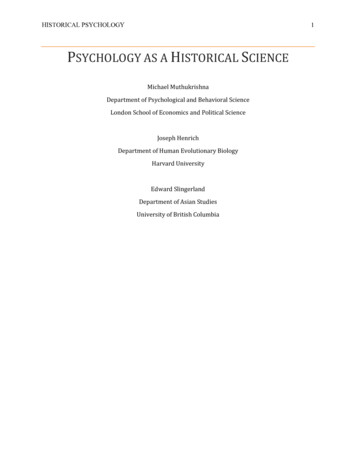
To cope with changes due to vegetation, building and the existence of water bodies, sourcesof the apparent change which may actually be due to the vegetation and cultural features maybe studied by examining them in conjunction with features which are visible on the aerialphotography.3. CASE STUDY3.1 BackgroundThe coal mine which has been used as an example for this work is located at Wyee about 80km south of Newcastle. The mine could be divided into two separate underground longwallworkings, shown as quadrilaterals on Figure 1.Figure 1: The two long-wall coal mines being studied in his investigation, in the vicinity of Wyee.Diagram prepared by Thomas Noirot.TS 8D - Photogrammetry, RMS and Image Data ProcessingRobert Paquet and Harvey MitchellSeeking Historical Gound Deformations form Archival Aerial PhotographyFIG Congress 2010Facing the Challenges – Building the CapacitySydney, Australia, 11-16 April 20104/12
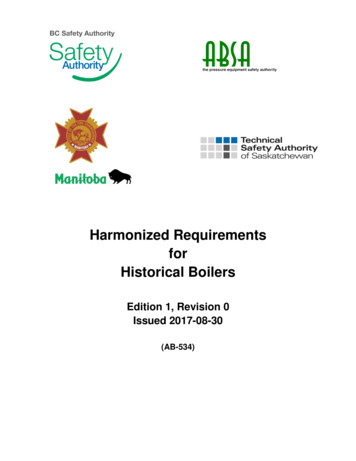
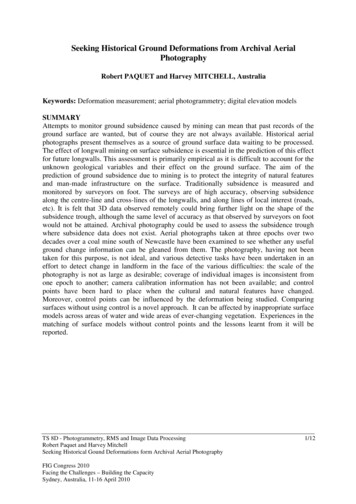
Aerial photography for 1981, 1990 and 1996 exists for the area of the mine. Details of theavailable photography are shown in Table I. Figure 2 shows the coverage provided by stereopairs from 1990. The photography, having not been taken for this purpose, is not ideal: thescale of the photography is not large; coverage of individual images is inconsistent from oneepoch to another; camera calibration information has not been available; and control pointshave been hard to place when the cultural and natural features have changed.Table 1: Archival aerial photography coverage of the Wyee coal mine.EpochRun OrientationPhoto ScaleFocal Length (mm)CameraNegative Film Size1981North – South1/25000151.44Wild RC10-1990East – West, West - East1/16000304.49Wild RC10230mm 230mm1996East - West, West - East1/16000152.74Wild RC30220mm 220mmFigure 2: Stereo-pair coverage from 1990 for the mine area.TS 8D - Photogrammetry, RMS and Image Data ProcessingRobert Paquet and Harvey MitchellSeeking Historical Gound Deformations form Archival Aerial PhotographyFIG Congress 2010Facing the Challenges – Building the CapacitySydney, Australia, 11-16 April 20105/12
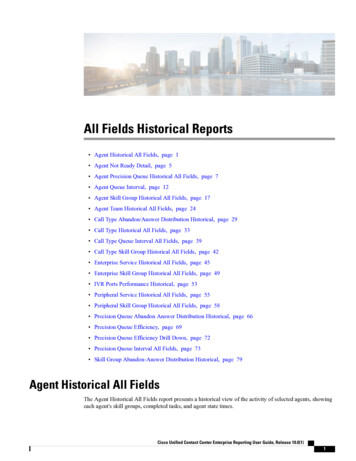
Of the two areas shown in Figure 1, the coverage offered by the stereo-pairs was better for thenorthern panels than for the southern ones, and it was decided that this case study would coverthe former mine area. The longwall mining in the northern area was completed in 1993, sothere was the prospect that the aerial photography from 1990 and 1996 would reveal anysurface subsidence. Digital elevation models from stereo-pairs covering the northern minewere created for both epochs, 1990 and 1996, using the VirtuoZo digital photogrammetrysoftware package (version 5.X) (Supresoft, 2010). DEM creation requires that an absoluteorientation has been undertaken to provide scale location and orientation to the groundcoordinate information, so basic control was provided by a number of points which were notplaced in ideal positions, but which instead were placed in accessible positions which did notrequire access to private property. Control was fixed using kinetic GPS to about 1 metreaccuracy. Positions are shown on Figure 1. The control was regarded as cheap and adequatefor this purpose, even if not acceptable for more conventional photogrammetry at higheraccuracy.4. RESULTS4.1 Noise estimationThe DEMs of the same area which were used to estimate the noise level are shown in Figures3 to 5. Figure 3 shows the DEM created from photographs numbered 90 and 91 of 1996,while Figure 4 shows the adjacent DEM from photographs 91 and 92, also of 8000362000362500363000363500364000Figure 3: DEM from photographs 90 and 91 of 1996, with 5m contours. The area can berecognised in the north western area shown on the aerial photography in Figure 2.TS 8D - Photogrammetry, RMS and Image Data ProcessingRobert Paquet and Harvey MitchellSeeking Historical Gound Deformations form Archival Aerial PhotographyFIG Congress 2010Facing the Challenges – Building the CapacitySydney, Australia, 11-16 April 20106/12
The surface match, when three shift parameters were sought, gave shifts as follows:X-2.66 mY-2.07 mZ0.45 mThe r.m.s. of all separations (in the Z direction) was 0.92 m. The mean absolute value of allresiduals was 0.50 m. The distribution of surface differences is shown in Figure 5. (Whenmore than the three shift parameters were sought, the surface match was too weak to convergebecause of the weakness in determining rotation parameters from surface which areessentially 328000363500364000364500365000Figure 4: DEM from photographs 91 and 92 of 1996, with 2m contours. The area used insurface matching to estimate noise is shown with contour lines.TS 8D - Photogrammetry, RMS and Image Data ProcessingRobert Paquet and Harvey MitchellSeeking Historical Gound Deformations form Archival Aerial PhotographyFIG Congress 2010Facing the Challenges – Building the CapacitySydney, Australia, 11-16 April 20107/12
363400363600Figure 5: Left: The matched area from the DEM of 1996, as extracted from Figure 3, with 5 mcontours. Right: the differences between the two DEMs, with 1 m contours.4.2 Matching of DEMs from 1990 and 1996The DEM created from photographs 118-119 of 1990, were matched with the DEM createdfrom photographs 91 and 92 of 1996, which are both shown in Figure 6.A small section of the overlap area was used in the matching to minimise the use of vegetatedareas, which were subject to change, and water areas where contours were unlikely to bevalid. Again, the surface match when more than the three shift parameters were sought wastoo weak to converge. The surface match when three shift parameters were sought gave shiftsas follows:X5.37 mY3.73 mZ-0.23 mThe r.m.s. of all separations (in the Z direction) was 1.81 m. The mean absolute value of allresiduals was 1.08 m. The distribution of surface differences is shown in Figure 7,superimposed on a DEM to indicate the location of the match area.TS 8D - Photogrammetry, RMS and Image Data ProcessingRobert Paquet and Harvey MitchellSeeking Historical Gound Deformations form Archival Aerial PhotographyFIG Congress 2010Facing the Challenges – Building the CapacitySydney, Australia, 11-16 April 20108/12
000363500364000364000364500365000364500Figure 6: Left: DEM created from photographs 118-119 of 1990; Right: DEM created fromphotographs 91 and 92 of 8000363500364000364500365000Figure 7: The distribution of surface differences, showing the matched area relative to the fullDEM area.TS 8D - Photogrammetry, RMS and Image Data ProcessingRobert Paquet and Harvey MitchellSeeking Historical Gound Deformations form Archival Aerial PhotographyFIG Congress 2010Facing the Challenges – Building the CapacitySydney, Australia, 11-16 April 20109/12
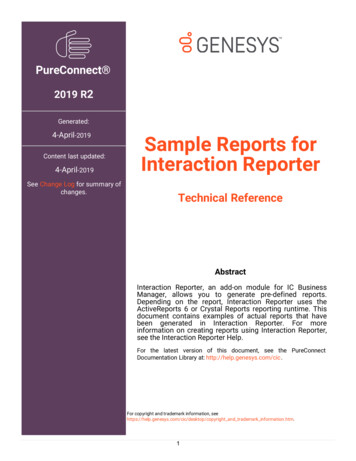
Figure 8 shows more detailed contours which might reveal broader trends. Although there iscorrelation with topography, there are no apparent regional differences which could beattributed to subsidence.Superimposing the differences on the original air photographs is a technique which can revealcorrelations between the apparent differences and vegetation or buildings which may havechanged, which can indicate that the differences are not due to subsidence. No correlationbetween the contours and the vegetation can be detected in this case, although this has beenobserved in other cases at the same mines.5. DISCUSSIONIn this case, the contours of surface differences appear to be randomly distributed withoutapparent correlation with the mines underground. DEMs can be affected by inappropriatesurface models across areas of water and wide areas of ever-changing vegetation, but in thiscase small areas were matched, to obviate this problem. There was also no obviouscorrelation between the contours and vegetation or buildings, but this has been observed inother cases at the same 64200364400632820063280006327800TS 8D - Photogrammetry, RMS and Image Data ProcessingRobert Paquet and Harvey MitchellSeeking Historical Gound Deformations form Archival Aerial PhotographyFIG Congress 2010Facing the Challenges – Building the CapacitySydney, Australia, 11-16 April 201010/12
0364200364400Figure 8: Top: The matched area from the DEMs of 1990 and 1996, with 5 m contours. Middle:The differences between the two DEMs, with 5 m contours.Bottom: The differences between the two DEMs, with 1 m contours.The surface matching method is not without faults, but it must be recognise that a number ofprecautions have to be taken with any DEM comparison which is undertaken to detectsubsidence, that is, even in those cases where first order control points are available andwhere markers have not been placed for the specific purpose of monitoring subsidence. Thecomparison of surface shapes is affected by noise and changes in vegetation and infrastructurein all cases. In this case, therefore, we have to recognise that these changes may additionallyaffect the surface matching. Overall, the outcomes provide confidence that the technique canbe used. The technique will probably now be modified and refined by the investigators.6. CONCLUSIONSComparing surfaces without using control is a novel approach. The surface matchingtechnique has been a cheap and simple means of examining aerial photographs for thedetection of subsidence. In the case reported here, subsidence has not been detected, and itjustifies the low cost approach. However, it is the technique which is more important than theresult and continued improvement is seen as worthwhile.REFERENCESMitchell, H.L. & R.G. Chadwick, 1999, Digital Photogrammetric Concepts applied to SurfaceDeformation Studies, Geomatica, 53(4): 405-414.Pâquet, R., 2004, Accurate Registration of ALS Data without Control Points, InternationalArchives of Photogrammetry, Remote Sensing and Spatial Information Sciences,(Proceedings of IVXXth ISPRS Congress ISPRS Congress Istanbul 2004) CD, CommissionIV: 1172-1177.Supresoft, 2010, http://www.supresoft.com.cn. Accessed 8 January 2010.TS 8D - Photogrammetry, RMS and Image Data ProcessingRobert Paquet and Harvey MitchellSeeking Historical Gound Deformations form Archival Aerial PhotographyFIG Congress 2010Facing the Challenges – Building the CapacitySydney, Australia, 11-16 April 201011/12
Wheaton, T., 2009, Estimating the Accuracy of Digital Aerial Photogrammetry: Detection ofPast Longwall Mining Induced Subsidence, Bachelor of Surveying Undergraduate Studentthesis, University of Newcastle, 2009, unpublished.ACKNOWLEDGEMENTThe work described in this paper has benefited to a great extent from associated investigationscarried out by the following students: Thomas Noirot, of the Institut National des SciencesAppliquées de Strasbourg, France, in 2008; Jakob Altenstein, of the Hochschule Karlsruhe –Technik und Wirtschaft, Karlsruhe, Germany, in 2009; and Todd Wheaton, of the Universityof Newcastle, in 2009.BIOGRAPHICAL NOTESDr Robert Pâquet has degrees in both civil engineering and surveying, and a doctorate inphotogrammetry, and is employed by Industry and Investment NSW. His current work andresearch includes analysis of subsidence data.Dr Harvey Mitchell is a Senior Lecturer in Surveying at the University of Newcastle,Australia, with teaching experience in general surveying, geodesy, remote sensing,positional astronomy, and photogrammetry. Current research interests lie primarily inphotogrammetry, and notably in medical and dental applications of photogrammetry.CONTACTSDr Robert PâquetMine Safety OperationsIndustry and Investment NSWMining Subsidence EngineerPO Box 344Hunter Region MC2310NSWAUSTRALIATel. 61-2-49316647Fax 61-2-49316790Email robert.paquet@industry.nsw.gov.auWeb site:Dr Harvey MitchellSchool of EngineeringUniversity of NewcastleUniversity DriveCallaghan2308NSWAUSTRALIATel. 61-2-49216055Fax 61-2-49216991Email harvey.mitchell@newcastle.edu.auWeb site: www.newcastle.edu.auTS 8D - Photogrammetry, RMS and Image Data ProcessingRobert Paquet and Harvey MitchellSeeking Historical Gound Deformations form Archival Aerial PhotographyFIG Congress 2010Facing the Challenges – Building the CapacitySydney, Australia, 11-16 April 201012/12
Aerial photography for 1981, 1990 and 1996 exists for the area of the mine. Details of the available photography are shown in Table I. Figure 2 shows the coverage provided by stereo-pairs from 1990. The photography, having not been taken for this purpose, is not ideal: the