Transcription
Han et al. Health and Quality of Life Outcomes 2014, Open AccessIs marital status associated with quality of life?Kyu-Tae Han1,2, Eun-Cheol Park2,3, Jae-Hyun Kim1,2, Sun Jung Kim1,2 and Sohee Park2,4*AbstractBackground: The divorce rate has been increasing rapidly in Korea; the single rate and trends in divorce are alsochanging rapidly. This study aimed to examine the relationship between marital status and quality of life (QOL) inan attempt to understand these changes. We also investigated the relationship between QOL and marital statusby age group.Methods: We used data from the Community Health Survey (2008: n 200,800; 2009: n 227,700; 2010: n 229,229)administered by the Korean Centers for Disease Control and Prevention. After excluding 63,527 participants withincomplete information on QOL and/or marital status, the final analysis involved 594,202 participants. The analysis usedt-tests and Chi-square tests to compare demographic variables between men and women, and ANOVA to compareQOL scores among comparison groups. We also performed a multilevel analysis on the relationship between QOLand marital status while accounting for the provincial differences.Results: The multilevel analysis by marital status showed that single men had significantly worse QOL (both EQ-VASand EQ-5D) than married men. On the other hand, the QOL measured by EQ-VAS was better in single women than inmarried, and separated or divorced women. When QOL was assessed using EQ-5D, single and separated or divorcedwomen had worse scores than married women. In the analysis by age group, the QOL of married men under theage of 30 years was lower than that of single men or men with marriage problems as measured by EQ-VAS. However,among 40–69-year-old men, married men had the highest QOL values. Similarly, for women in their 30s, singlewomen had the highest EQ-VAS values, but for 40–69-year-old women, single women had lower EQ-VAS scoresthan married women.Conclusion: There was significant relationship between marital status and QOL, and this relationship appeared todiffer by gender and age.Keywords: EQ-VAS, EQ-5D, Marital status, Quality of lifeBackgroundLife Satisfaction as measured by the Better Life Index isan indicator of quality of life (QOL) and is calculatedbased on 11 indicators. In a report issued by the OECD in2013, among the 37 countries examined, South Korea helda low position, 27th place (Korea’s score: 6.0; OECD average:6.6/10). It is apparent that life satisfaction among Koreansis low, even in comparisons using other indicators [1], nodefinitive factors have been identified that explain why lifesatisfaction or QOL is so low. Previous studies to clarifyfactors affecting QOL have considered relevant socio* Correspondence: soheepark@yuhs.ac2Institute of Health Services Research, Yonsei University College of Medicine,Seoul, Republic of Korea4Department of Biostatistics, Graduate School of Public Health, YonseiUniversity, 50 Yonsei-ro, Seodaemun-gu, Seoul 120-752, Republic of KoreaFull list of author information is available at the end of the articleeconomic conditions and socioeconomic status generally.However, few studies have examined how marriage statusimpacts QOL [2-4].Marital status has been classified as single, married,and marriage problems (including separation, divorce,and bereavement). The situation for each group in thisclassification in South Korea is as follows. According tothe 2008 OECD Family Database, the divorce rate inKorea is at a high level relative to other OECD countries(Korea: 2.6; OECD average: 2.1 of 7), and the divorcerate increased rapidly from 1970 to 2008 (change from1970 to 2008: 2.2/4 total points) [5]. Moreover, accordingto the Population Trends Survey of the Korean NationalStatistical Office in 2000–2012, the divorce rate for menover 40 increased from 46.5% in 2000 to 70.5% in 2012,and the divorce rate for women increased from 54.2% to74.5%. These numbers indicate that trends in divorce rates 2014 Han et al. licensee BioMed Central Ltd. This is an Open Access article distributed under the terms of the CreativeCommons Attribution License (http://creativecommons.org/licenses/by/2.0), which permits unrestricted use, distribution, andreproduction in any medium, provided the original work is properly credited. The Creative Commons Public DomainDedication waiver ) applies to the data made available in this article,unless otherwise stated.
Han et al. Health and Quality of Life Outcomes 2014, 12:109http://www.hqlo.com/content/12/1/109are changing [6]. According to the Population and HousingCensus department of Statistics Korea, the single rateamong men 25–39 years old rose from 30.0% in 1995 to52.8% in 2010. Similarly, the single rate among 25–39year-old women rose from 13.2% to 35.6% during the sameperiod [7]. Thus, given that the trends in marital statusamong the Koreans are changing rapidly, a study onwhether sudden changes in marital status influence QOLis needed.Of course, there have been previous studies of QOL related to marital status. However, those studies focused ontopics such as the social role of the spouse in mentalhealth, the impact of marital status on a particular disease,or the impact of marital status in preventing certain diseases [8-15]. However, reported research on the impact ofthe rapid changes in marital status and on the relationshipbetween marital status and QOL in each age group is lacking. Thus, in this study, we analyzed the differences inQOL by marital status and examined the relationship ofmarital status with QOL according to sex and age group.MethodsStudy populationThe data used were from the Community Health Surveyadministered by the Korean Centers for Disease Controland Prevention, which was designed to facilitate interprovincial comparisons [16]. The Community HealthSurvey was administered by investigators who conductedone-on-one visits and interviews targeting adults 19 yearsof age or older in 253 health centers nationwide startingin 2008. Data were gathered for 200,800 people in 2008,227,700 people in 2009, and 229,229 people in 2010.These were integrated and sampling weights were incorporated for the analysis. The final analysis used data from594,202 people from the total of 657,729 after excluding63,527 people for whom information on QOL and/ormarital status was incomplete and therefore could not beanalyzed. Because the Community Health Survey data is asecondary data that do not contain private informationand is available to public domain, our study did not haveto address ethical concerns.VariablesThe outcome variables were scores on the EQ-VAS andEQ-5D Index. EQ-VAS is a self-rated health questionnaire presented as a vertical visual analog scale, wherethe endpoints are labeled “best” and “worst imaginablehealth state”. Participants completed the scale rangingfrom 0 to 100 on the study day. Responses to this scalewere used as a quantitative measure of participants’ selfrated health. The EQ-5D is an index of five dimensions ofhealth-related QOL. The five dimensions are mobility,self-care, usual activities, pain/discomfort, and anxiety/depression. Original EQ-5D index has values ranging from 0Page 2 of 10to 1. For the purpose of comparing the two indicators(EQ-VAS and EQ-5D), the EQ-5D Index was multipliedby 100 before the data were analyzed.The variable of major interest in its association withthe outcome variables was marital status. Marital statuswas divided into married, single, and marriage problems(separation, divorce, bereavement). Other independentvariables considered in the analysis were frequent depression for more than 2 weeks, awareness of stress, age, familyincome, education level, perceived health status, and survey year. Stress awareness was defined as the endorsing “alot” or “very much” as descriptive of stress in one’s dailylife. Age was classified into 5-years intervals. Family income was classified into four groups. Education levels wereclassified as “less than high school”, “high school education,” and “university education.” Subjective health statuswas defined describing one’s subjective health level as“good” or “very good”.The provincial variables in the analysis reflected thecharacteristics of the Community Health Survey dataused in the analysis. Provincial variables were based onthe e-provincial indicators of the survey conducted byStatistics Korea by year, as follows: resident population,gross provincial domestic product (GRDP), crude divorcerate, and married couple [17]. The e-provincial indicatorswere variables representing the 16 provinces. GRDP asvalue-added on the production side was used as an indicator to measure how much value added to economic activities in each region.Statistical analysisFor comparisons related to QOL, we analyzed men andwomen separately. For the analysis of the relationshipbetween QOL and marital status, the following variableswere adjusted: frequent depression for more than 2 weeks,stress awareness, age, family income, education level, perceived health status, survey year, and provincial variables.To compare the relationship between QOL and marital status by age group, age was divided into 5-year intervals. Wefirst examined the distribution of each variable to analyzethe general characteristics of each group, and we performedt-tests and χ2 tests to examine differences in each variableaccording to gender. Next, to compare the average valueson the QOL indices according to the independent variables,we performed analyses of variance (ANOVAs). Finally,to analyze the relationship between QOL and maritalstatus, considering the characteristics of the CommunityHealth Survey, we performed a multilevel analysis. All analyses were performed using SAS software (ver. 9.2). P-values 0.05 were considered to indicate statistical significance.ResultsOf the 594,202 participants in the final sample, 46.0%were men, and 54.0% were women. A higher proportion
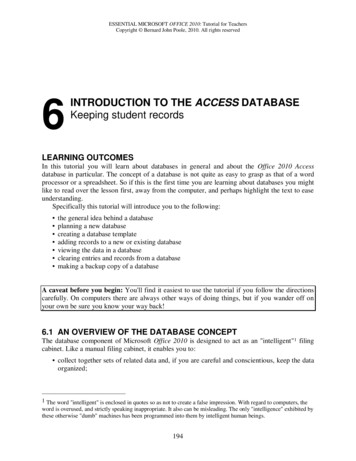
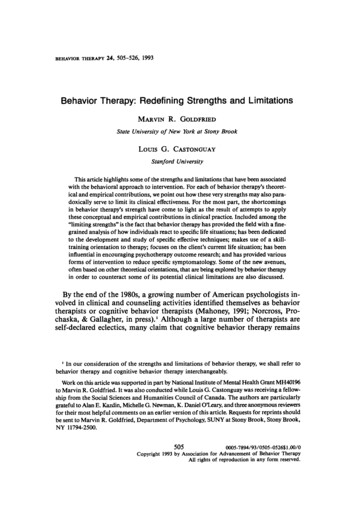
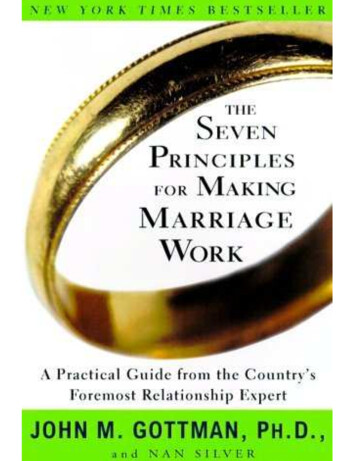
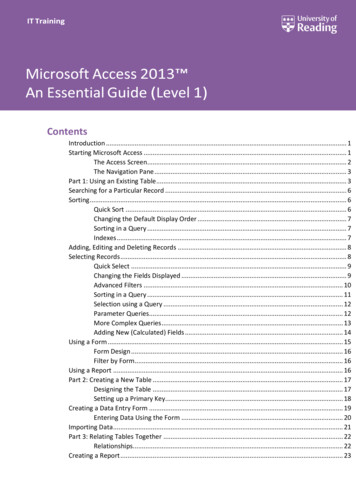
Han et al. Health and Quality of Life Outcomes 2014, 12:109http://www.hqlo.com/content/12/1/109of married persons were in men than in women. Womenwere almost twice as likely as were men to report frequentdepression for more than 2 weeks, and awareness of stresswas higher in women than for men. The subjective healthstatus of men was higher than that of women. Regardingprovincial variables, the resident registration population ofmen was slightly higher than that of women, and the average of GRDP was higher in men than in women (Table 1).The overall ANOVA revealed that the average EQVAS score was higher for men than for women. In termsof the relationship between QOL and marital status,men and women had similar results. EQ-VAS scores werehigher in the order single married marriage problemsfor both men and women. The overall QOL, measured bythe EQ-5D Index, was higher for men than women. TheQOL measured by the EQ-5D Index was higher in theorder single married the marriage problems in bothmen and women (Table 2).A multilevel analysis of the EQ-VAS was conducted toinvestigate the relationship between QOL and marital status while adjusting for potential confounding variablessuch as age, depression, stress, and socioeconomic status.Based on marital status, men had higher EQ-VAS valuesin the order married single marriage problems, andwomen had higher values in the order single married marriage problems (male single: 0.567, separation/divorce/bereavement: 0.966; female single: 0.760, separation/divorce/bereavement: 0.544; p 0.05). The multilevelanalysis of EQ-5D by marital status revealed that menhad higher values in the order married marriage problems single. EQ-5D values for women were higher inthe order married single marriage problems (male single: 0.904, separation/divorce/bereavement: 0.707; femalesingle: -0.273, separation/divorce/bereavement: 0.822;p 0.05; Table 3).When examined in detail the relationship betweenQOL and marital status by sex and age group, EQ-VASscores in men younger than 30 years old who weresingle or had marriage problems indicated better QOLthan was found in married men (age 19–24, single: 2.028,p 0.05; separation/divorce/bereavement: 0.2906, p 0.05;age 25–29, single: 0.977, p 0.05; separation/divorce/bereavement: 1.894, p 0.05). In the 35–69-year age groupamong men, single men tended to have lower QOL scoresthan did married men. In the 40–64-year interval, the estimated QOL score was higher in the order married marriage problems and single. In the analysis of the EQ-5D,there was a slightly different tendency from that seen forEQ-VAS. Regardless of age, in men, QOL was in the ordermarried marriage problems and single.EQ-VAS scores in women under 30 years showed higherQOL scores in the order single married marriage problems (age 19–24, single: 2.160, p 0.05; separation/divorce/bereavement: 2.756, p 0.05; age 25–29, single: 1.236,Page 3 of 10p 0.05; separation/divorce/bereavement: 0.054, p 0.05).In women aged 40–49 years, QOL scores were loweramong single than among married women, and between45 and 54 years, marriage problems were associated withpoorer QOL than was married status (Figure 1).The EQ-5D scores of women under 30 years showedhigher QOL scores in the order single married marriageproblems (age 19–24, single: 0.042, p 0.05; separation/divorce/bereavement: 0.431, p 0.05; age 25–29, single:0.190, p 0.05; separation/divorce/bereavement: 0.444,p 0.05). Among women over 35 years of age, QOL washigher in the order married marriage problems single(Figure 2).In an additional analysis by dividing the marital statusinto five groups (single, separation, bereavement, divorcedand married), the overall results between marital statusand QOL were similar to those when “separation, bereavement and divorced” were collapsed in the analysis.EQ-VAS scores were the lowest in men and womenwith marital status of separation (single: 0.563, separation: 1.922, and bereavement: 1.152 comparedwith married in men; single: 0.763, separation:-1.205,bereavement: 0.507 compared with married in women;p 0.05). EQ-5D scores showed similar trends as EQ-VAS(male single: 0.902, separation: 1.290, bereavement: 0.792; female single: 0.242, separation:-0.980,bereavement: 1.156; p 0.05). The coefficients for divorced men or women were not statistically significant.DiscussionTo clarify the causes of low QOL among South Koreansat a national level, targeting adults 19 years of age orolder, we focused on marital status as one socioeconomicissue and then analyzed its association with quality of life.Some differences were evident depending on whether weused EQ-5D or EQ-VAS, but we nonetheless observeddifferences in quality of life depending on marital status inmen and women. The EQ-VAS scores of men were amore sensitive indicator of the decline in the quality of lifethat occurred with marriage problems than the declineassociated with single status. However, the decline inQOL associated with single status was greater than thatassociated with marriage problems using the EQ-5D.In the case of women, the quality of life of singlewomen was good according to EQ-VAS, and the declinein QOL with marriage problems was high using scoreson the EQ-5D. The analysis based on age groups showedthat, at younger ages, QOL as measured by EQ-VAS washigher in single men and women. Furthermore, thedecrease in QOL due to the marriage problems and beingsingle increased gradually with age. Scores on the EQ-5Dfor men indicated that QOL was lower among those whohad marriage problems and were single regardless of age,but in the case of women, marriage problems and being
Han et al. Health and Quality of Life Outcomes 2014, 12:109http://www.hqlo.com/content/12/1/109Page 4 of 10Table 1 Characteristics of study participants (frequency, %)TotalMenWomen5942022735373206658834550625 (18.5)37720 (11.8)P-value**Marital 189 (8.5)76789 (23.9)Married405879199723 (73.0)206156 (64.3)Yes4275113566 (5.0)29185 (9.1)No551451259971 (95.0)291480 (90.9) .0001Frequent depression for more than 2 weeks .0001Stress awarenessYes15785772630 (26.6)85227 (26.6)No436345200907 (73.4)235438 (73.4)3307414950 (5.5)18124 (5.7)0.8208Age (years)19–2425–294141819842 (7.3)21576 (6.7)30–344772822592 (8.3)25136 (7.8)35–396004829041 (10.6)31007 (9.7)40–445914028984 (10.6)30156 (9.4)45–496214730098 (11.0)32049 (10.0)50–545926328178 (10.3)31085 (9.7)55–594822322464 (8.2)25759 (8.0)60–644501020909 (7.6)24101 (7.5)65–694844421340 (7.8)27104 (8.5)70–744240518059 (6.6)24346 (7.6) 754730217080 (6.2)30222 (9.4) .0001Family income (thousands won) 1200016802468474 (25.0)99550 (31.0)12000–2400014213068491 (25.0)73639 (23.0)24000–4200015151073286 (26.8)78224 (24.4) 4200013253863286 (23.2)69252 (21.6)24256487985 (32.2)154579 (48.2)High school graduate203879104923 (38.4)98956 (30.9)College graduate14775980629 (29.5)67130 (20.9)Good247659129014 (47.2)118645 (37.0)Bad346543144523 (52.8)202020 (63.0)200817691981547 (29.8)95372 (29.7)200921058897326 (35.6)113262 (35.3)201020669594664 (34.6)112031 (34.9) .0001EducationLess than high school .0001Perceived health status .0001Year of survey0.0554
Han et al. Health and Quality of Life Outcomes 2014, 12:109http://www.hqlo.com/content/12/1/109Page 5 of 10Table 1 Characteristics of study participants (frequency, %) (Continued)Provincial variablesResident population*Gross provincial domestic product (GRDP, million won)*Crude divorce rate*Married (couple)*4613502 (3973307)4603006 (3953958)0.308999153215 (82449380)99145655 (82397934)0.97192.3 (0.2)2.3 (0.2) .000129482.1 (27,431.7)29400.6 (27,317.1)0.2529*shown as Mean, SD for all 16 provinces.**P-values are for results of χ2 tests for categorical variables and independent t-tests for continuous variables.single were associated with lower QOL in all groupsexcept for women under 30 years of age.These results show some similarities and differencescompared with those of previous studies. According toprevious studies, married people have improved mentalhealth compared with those who are single, divorced,or bereaved due to the social relationship with thespouse [13,18-20]. In the present study, married peoplehad higher QOL scores than did those in differentmarriage status groups generally, but when the resultswere analyzed by age group, married people under 30did not have better quality of life than their nonmarried peers.Another study examined the relationship of marriagestatus with mortality and morbidity and found that thosewho were single, divorced, or bereaved showed highermortality and morbidity in specific diseases comparedwith those who were married or cohabiting [21-23]. Inthe present study, we considered health-related QOLrather than any particular disease, but the positive impact of marriage was similar in both cases. Additionally,previous research on mental health by age group showedthat the mental health of single people was better thanthat of married people in individuals younger than 30 yearsof age. These results are similar to our study, whichshowed high QOL among single participants 30–39 yearsold. However, age groups were not analyzed in detail inthe previous study, as they were here, but were dividedinto three groups. Also, the previous study focused ondermatological patients [10].This study has some strengths and some limitations.First, the data used were national-level data, making itpossible to understand the health of provincial residents,to establish health policies based on evidence, and toevaluate them. Above all, these data reflected the experiences of residents of particular provincialities, not justpatients. As also shown in another study, differences inthe relationship between marital status and well-beingwere shared by culture and regions [24], it was meaningful to be able to simultaneously consider the provincialvariables in analysis. Furthermore, the study used a largerepresentative sample, and data were collected from anationwide population. Next, to our knowledge, this isfirst report on the relationship between QOL (measuredby EQ-VAS and EQ-5D) and marital status by age group.Previous studies focused only on QOL by socioeconomicstatus and the relationship between QOL and maritalstatus in a particular disease. Also, some of those studiesdid not measure QOL using EQ-VAS or EQ-5D. Finally,this study identified differences in QOL by gender andage group. In some age groups, men had higher QOLscores than women, whereas in other age groups, thereverse was found. This result shows that it is necessaryto analyze data for each gender separately when studyingquality of life.However, this study was cross-sectional in nature,hence there is limitation in interpreting the causalrelationship between marital status and QOL. But thequestion about the marital status is for the current timeperiod and the question about the quality of life was onthe day the participant filled out the questionnaire.Therefore, we believe that the direction in this relationship is at least from marital status to the quality of life,and it is unlikely that the participants’ previous qualityof life resulted in the current marital status. To moreaccurately measure the relationship between quality oflife and marital status, other issues must be considered.For instance, studies are needed about the positiveimpact of marital satisfaction on quality of life, aboutmarital quality by age group, and about the increase indepression due to marital disruption. Thus, it is important to consider the marital quality in addition to maritalstatus [25-27]. There is also a need to examine the factorsleading to the rapid changes in marriage status over timeand their impact on the quality of life.Sudden changes in marital status are expected to havea significant impact on the quality of life in Koreans inthe future. Realistically, these changes will be difficult tomanage for married and single people. However, it ispossible to seek means to help people who are experiencing marriage problems. In particular, intensive management for those in their 40s, the age group with the greatestreduction in quality of life due to marriage problems,should be encouraged.It is possible for the quality of life to decline due tofactors other than marital status, so it is necessary to
Han et al. Health and Quality of Life Outcomes 2014, 12:109http://www.hqlo.com/content/12/1/109Page 6 of 10Table 2 Relationships of quality of life with demographic characteristics and health behaviors [mean (SD) and p-values]MenEQ-VASWomenEQ-5DEQ-VASEQ-5DMarital statusSingle78.8 (14.6)Separation/Divorced/Bereavement71.6 (17.6) .000192.3 (15.0)97.9 (8.2) .000177.7 (14.4)65.2 (18.7) .000185.0 (18.5)97.9 (7.1)Married74.9 (15.7)95.3 (12.3)72.9 (16.2)94.2 (11.7) .0001Frequent depression for more than 2 weeksYes62.2 (21.8)No76.0 (15.1) .000182.4 (25.3) .000196.2 (10.4)60.7 (20.6) .000172.7 (16.3)82.2 (21.5) .000193.4 (12.5)Stress awarenessYes70.9 (17.6)No77.0 (14.8) .000193.5 (15.7) .000196.3 (10.3)65.5 (18.9) .000173.9 (15.8)88.5 (17.7) .000193.8 (12.0)Age (years)19–2481.8 (13.5)25–2979.8 (13.6) .000198.9 (5.0) .000198.9 (5.1)78.8 (14.2) .000177.3 (14.0)98.7 (4.5) .000198.4 (5.0)30–3477.8 (13.5)98.7 (5.5)76.5 (14.0)98.2 (5.3)35–3977.3 (13.6)98.4 (6.0)76.8 (13.9)98.0 (5.8)40–4477.3 (13.8)98.1 (6.7)76.3 (14.2)97.5 (6.8)45–4977.1 (14.3)97.5 (8.2)75.3 (14.9)96.6 (8.0)50–5476.5 (14.9)96.9 (9.0)73.5 (15.6)95.1 (9.8)55–5975.5 (15.4)96.0 (10.5)71.5 (16.1)93.3 (11.4)60–6474.0 (16.1)94.6 (12.3)68.8 (16.9)90.2 (13.6)65–6971.2 (17.2)91.7 (15.5)65.3 (17.9)86.0 (16.1)70–7468.4 (18.2)88.6 (17.8)62.2 (18.3)82.4 (17.7) 7563.9 (19.5)81.9 (23.0)59.2 (19.2)76.4 (21.9)Family income (thousands won) 12,00069.2 (18.7) .000189.6 (18.0) .000165.0 (18.8) .000185.7 (17.7)12,000–24,00075.8 (15.2)96.4 (10.3)72.6 (16.2)94.0 (12.2)24,000–42,00077.7 (13.8)97.9 (7.5)75.0 (14.9)95.9 (9.9) 42,00078.9 (13.2)98.3 (6.5)76.4 (14.5)96.5 (9.2) .0001EducationLess than high school70.3 (17.9)High school graduate77.0 (14.8) .000190.8 (16.8)97.2 (9.0) .000166.3 (18.3)75.9 (14.7) .000186.9 (17.2)97.1 (7.4)College graduate78.7 (13.1)98.4 (6.3)77.7 (13.3)98.2 (5.3) .0001Perceived health statusGood82.0 (11.8)Bad69.5 (16.6) .000198.9 (4.7) .000192.5 (15.3)80.5 (12.3) .000166.4 (17.3)98.1 (5.8) .000189.0 (16.1)Years200875.5 (16.4)200975.6 (15.6)95.8 (11.6)71.8 (16.9)92.7 (13.8)201074.9 (15.5)95.6 (11.7)71.5 (16.8)92.3 (13.8)Total*P-values for results by ANOVA.75.4 (15.8) .0001 .000195.1 (12.8)95.5 (12.0) .0001 .000171.6 (17.6)71.6 (17.1) .0001 .000192.3 (14.3)92.4 (14.0) .0001 .0001
Han et al. Health and Quality of Life Outcomes 2014, 12:109http://www.hqlo.com/content/12/1/109Page 7 of 10Table 3 Multilevel analysis results of EQ-VAS and EQ-5D (estimated regression coefficient, P-value*)MenWomenEQ-VASEQ-5DEQ-VASEQ-5DMarital statusSingle 0.567 .0001 0.904 .00010.760 .0001 0.273 .0001Separation/Divorced/Bereavement 0.966 .0001 0.707 .0001 0.544 .0001 0.822 .0001Married----Frequent depression for more than 2 weeksYes 7.242No- .0001 8.545 .0001- 6.164 .0001- 6.783 .0001-Stress awarenessYes 4.424No- .0001 1.654 .0001- 5.914 .0001- 2.998 .0001-Age (years)19–24-25–29 1.630 .0001 0.1180.1215 0.712 .0001 0.2020.017230–34 2.684 .0001 0.375 .0001 0.718 .0001 0.410 .000135–39 2.597 .0001 0.480 .0001 0.0770.5818 0.542 .000140–44 2.363 .0001 0.675 .00010.1270.3804 0.618 .000145–49 2.030 .0001 1.000 .00010.3710.0107 0.844 .000150–54 1.891 .0001 1.143 .0001 0.2760.0699 1.409 .000155–59 2.232 .0001 1.651 .0001 0.5770.0004 2.293 .000160–64 2.692 .0001 2.522 .0001 1.958 .0001 4.442 .000165–69 3.815 .0001 4.140 .0001 3.887 .0001 7.695 .000170–74 5.303 .0001 6.656 .0001 6.300 .0001 11.378 .0001 75 8.989 .0001 12.833 .0001 9.805 .0001 17.716 .0001Family income (thousands won) 12,000 3.599 .0001 2.830 .0001 3.009 .0001 1.943 .000112,000–24,000 1.245 .0001 0.329 .0001 1.313 .0001 0.243 .000124,000–42,000 0.660 .0001 0.0330.4518 0.602 .0001 0.0780.0948 42,000----EducationLess than high school 2.609 .0001 2.089 .0001 2.375 .0001 2.088 .0001High school graduate 0.958 .0001 0.382 .0001 0.627 .0001 0.210 .0001College graduate----Perceived health statusGoodBad9.323 .0001-2.517 .0001-9.067 .0001-2.792 .0001-Years2008-2009 0.549 .00010.1020.217 0.4610.0005 0.2980.00152010 1.374 .0001 0.1050.0877 0.744 .0001 0.427 .0001 0.071 .00010.030 .0001 0.066 .00010.092 .0001 .0001Provincial variables (per 100,000 people)Resident populationGross provincial domestic product (GRDP, million won)Crude divorce rateMarried (couple)*P-values for results of multilevel analysis. 0.001 .0001 0.001 .0001 0.001 .0001 963.0000.824112.0000.0003 2.0000.234712.900 .0001 5.0000.0225
Han et al. Health and Quality of Life Outcomes 2014, 12:109http://www.hqlo.com/content/12/1/109Page 8 of 10Figure 1 Regression coefficient estimates for EQ-VAS by marital status and age. A) Differences in EQ-VAS according to marital status byage group in men, B) Differences in EQ-VAS according to marital status by age group in women; *P-value 0.05, P-values for results ofmultilevel analysis. Adjusted for frequent depression for more than 2 weeks, stress awareness, age, family income, education, perceivedhealth status, year of survey, provincial variables. Whiskers in each bar represent standard error estimates of regression coefficients.Reference group is “Married”.prevent the decline in QOL in advance through government-level support for people experiencing marriageproblems. There is also a need to consider the culturalbackground of South Korea. Under the influence of Confucianism, Korean society is characterized by a conservativeperspective. Thus, bias may occur against people who haveexperienced a divorce. It is important to develop countermeasures to revise the cultural atmosphere in Korea as partof the solution to the issues faced for those who have experienced marital problems.
Han et al. Health and Quality of Life Outcomes 2014, 12:109http://www.hqlo.com/content/12/1/109Page 9 of 10Figure 2 Regression coefficient estimates for EQ-5D by marital status and age. A) Differences in EQ-5D according to marital statusby age group in men, B) Differences in EQ-5D according to marital status by age group in women; *P-value 0.05, P-values for results ofmultilevel analysis. Adjusted for frequent depression for more than 2 weeks, stress awareness, age, family income, education, perceivedhealth status, year of survey, provincial variables. Whiskers in each bar represent standard error estimates of regression coefficients. Reference groupis “Married”.ConclusionThere was a significant relationship between marital status and QOL, and this relationship appeared to differ bygender and age. The results of this study would providethe reference information for developing the management policy for declined QOL.Competing interestsThe authors declare that they have no competing interests.Authors’ contributionsKTH and SP led the design and conception of the study, performed the dataanalysis, and wrote the manuscript. ECP and JHK participated in the studydesign, and provided intellectual input to the development of the
Han et al. Health and Quality of Life Outcomes 2014, pt. SJK assisted to draft this manuscript. All authors read andapproved the final manuscript.Author details1Department of Public Health, Graduate School, Yonsei University, Seoul,Republic of Korea. 2Institute of Health Services Research, Yonsei UniversityCollege of Medicine, Seoul, Republic of Korea. 3Department of PreventiveMedicine, Yonsei University College of Medicine, Seoul, Republic of Korea.4Department of Biostatistics, Graduate School of Public Health, YonseiUniversity, 50 Yonsei-ro, Seodaemun-gu, Seoul 120-752, Republic of Korea.Page 10 of 1025. Robert H, Aseltine J: Marital disruption and depres
and EQ-5D) than married men. On the other hand, the QOL measured by EQ-VAS was better in single women than in married, and separated or divorced women. When QOL was assessed using EQ-5D, single and separated or divorced women had worse scores than married women. In the analysis by age group, the QOL of married men under the