Transcription
AE260Principles and Practices of Irrigation Management forVegetables1M. D. Dukes, L. Zotarelli, G. D. Liu, and E. H. Simonne2This section contains basic information on vegetablewater use and irrigation management, along with somereferences on irrigation systems. Proper water managementplanning must consider all uses of water, from the sourceof irrigation water to plant water use. Therefore, it is veryimportant to differentiate between crop water requirementsand irrigation or production system water requirements.Crop water requirements refer to the actual water needs forevapotranspiration (ET) which are related to soil type andplant growth, and primarily depend on crop developmentand climatic factors which are closely related to climaticdemands. Irrigation requirements are primarily determinedby crop water requirements, but also depend on the characteristics of the irrigation system, management practices,and the soil characteristics in the irrigated area.all major aspects of irrigation such as irrigation systemdesign, system maintenance, erosion control, and irrigationscheduling.Best Management Practices (BMP)for IrrigationFigure Dek9fc1h8l.BMPs have historically been focused on nutrient management and fertilizer rates. However, as rainfall or irrigationwater is the vector of off-site nutrient movement of nitratein solution and phosphate in sediments as well as othersoluble chemicals, proper irrigation management directlyaffects the efficacy of a BMP plan. The irrigation BMPs inthe “Water Quality/Quantity Best Management Practicesfor Florida Vegetable and Agronomic Crops” (accessibleat http://www.floridaagwaterpolicy.com) manual coverUnderstanding irrigation water quality is critical forsustainability of vegetable production. In some areas ofFlorida, water quality impacts crop productivity morethan soil fertility, pest and weed control, variety, and otherfactors. Irrigation water quality is determined by thefollowing: (1) salinity hazard: total soluble salt content; (2)sodium hazard: ratio of sodium (Na ) to calcium (Ca2 )and magnesium (Mg2 ) ions; (3) water pH; (4) alkalinity:carbonate and bicarbonate; specific ions: chloride (Cl-),Irrigation Water Quality Criteria1. This document is AE260, one of a series of the Horticultural Sciences Department, UF/IFAS Extension. Original publication date June 1995. RevisedJanuary 2012. Reviewed May 2021. Visit the EDIS website at https://edis.ifas.ufl.edu for the currently supported version of this publication.2. M. D. Dukes, professor; L. Zotarelli, assistant professor, Agricultural and Biological Engineering Department; G. D. Liu, assistant professor; and E. H.Simonne, professor, Horticultural Sciences Department, UF/IFAS Extension, Gainesville, FL 32611.The Institute of Food and Agricultural Sciences (IFAS) is an Equal Opportunity Institution authorized to provide research, educational information and other servicesonly to individuals and institutions that function with non-discrimination with respect to race, creed, color, religion, age, disability, sex, sexual orientation, marital status,national origin, political opinions or affiliations. For more information on obtaining other UF/IFAS Extension publications, contact your county’s UF/IFAS Extension office.U.S. Department of Agriculture, UF/IFAS Extension Service, University of Florida, IFAS, Florida A & M University Cooperative Extension Program, and Boards of CountyCommissioners Cooperating. Nick T. Place, dean for UF/IFAS Extension.
sulfate (SO42-), boron (BO3-), and nitrate-nitrogen (NO3-N);(5) organic contaminates: oil pollutants; and (6) otherfactors such as heavy metals. Among these factors, salinityis most significant particularly in those areas close to thecoast where salt content in ground water is frequently high.Irrigation water quality can be evaluated based on electricalconductivity (Table 1).There are two main issues related to salinity: short term, i.e.,effect of water electrical conductivity on a particular cropand long term, namely, soil salinization. There is abundantbiodiversity in crop tolerance to salinity stresses (Tables2 and 3). Generally speaking, vegetable crops are moresusceptible than cereal crops.Also, different vegetable species differ significantly intolerance to salinity stress. For example, tomato is relatively tolerant to salinity stress. At 1 dS m-1, tomato yieldincreased with N rate but there was no yield response to Nfertilization at 5 dS m-1. However, carrot is rated as a sensitive crop. Root yield declines 14% for every unit increasein salinity beyond the threshold of 1 dS m-1. Therefore,irrigation management for vegetable production needs tobe more careful. To avoid any accidental economic loss,before irrigating vegetable crops, irrigation water qualityshould be checked based on electrical conductivity with anappropriate salinity meter at least once a year, particularlyin the near coastal areas. Vegetable growers may need toconsult their extension agent to interpret the results.Uses of Irrigation WaterIrrigation systems have several uses in addition to waterdelivery for crop ET. Water is required for a preseasonoperational test of the irrigation system to check for leaksand to ensure proper performance of the pump and powerplant. Irrigation water is also required for field preparation,crop establishment, crop growth and development, withinseason system maintenance, delivery of chemicals, frostprotection, and other uses such as dust control.Field PreparationField preparation water is used to provide moisture to thefield soil for tillage and bed formation. The water usedfor field preparation depends on specific field culturalpractices, initial soil moisture conditions, the depth tothe natural water table, and the type of irrigation system.Drip-irrigated fields on sandy soils often require an additional irrigation system for field preparation because driptubes are not installed until the beds are formed. Manydrip irrigated vegetable fields may also require an overheador subirrigation system for field preparation. However,Principles and Practices of Irrigation Management for Vegetablessprinkler irrigation systems can meet different waterrequirements. For example, sprinkler irrigation systemsinstalled in many strawberry production fields can workfor both irrigation and frost protection. These systems arealso used for field preparation and may apply one or moreinches of water for this purpose. Subirrigated fields usethe same system for field preparation as well as for cropestablishment, plant growth needs, and frost protection.Subirrigation water management requirements dependon the soil characteristics within the irrigated field andsurrounding areas. Sufficient water must be provided toraise the water table level as high as 18 to 24 inches belowthe soil surface. Water is required to fill the pores of thesoil and also satisfies evaporation and subsurface runoffrequirements. As a rough guide, 1.0 to 2.5 inches of waterare required for each foot of water table rise. For example,a field with a pre-irrigation water table 60 inches deep mayneed about 2 inches of water to raise the water table to 18inches, while a pre-irrigation water table at 48 inches mayrequire 5 inches of water for the same result.Crop EstablishmentVegetables that are set as transplants, rather than directseeded require irrigation for crop establishment in excess ofcrop ET. Establishment irrigations are used to either keepplant foliage wet by overhead sprinkler irrigation (to avoiddesiccation of leaves) or to maintain high soil moisturelevels until the root systems increase in size and plantsstart to actively grow and develop. Establishment irrigation practices vary among crops and irrigation systems.Strawberry plants set as bare-root transplants may require10 to 14 days of frequent intermittent overhead irrigationfor establishment prior to irrigation with the drip system.The amount of water required for crop establishment canrange widely depending on crop, irrigation system, andclimate demand. Adequate soil moisture is also needed forthe uniform establishment of direct-seeded vegetable crops.Crop Growth and DevelopmentIrrigation requirements necessary to meet the ET needs ofa crop depend on the type of crop and growth stage, fieldsoil characteristics, irrigation system type and capacity.Different crops vary in growth characteristics that result indifferent relative water use rates. Soils differ in texture andhydraulic characteristics such as available water-holdingcapacity (AWHC) and capillary movement. Because sandsgenerally have very low AWHC values (3% to 6% is common), a 1% change in AWHC affects irrigation practices.2
Water Application (IrrigationRequirement)Irrigation systems are generally rated with respect toapplication efficiency (Ea), which is the fraction of thewater that has been applied by the irrigation system andthat is available to the plant for use (Table 4). Appliedwater that is not available to the plant may have been lostfrom the crop root zone through evaporation or winddrifts of spray droplets, leaks in the pipe system, surfacerunoff, subsurface runoff, or deep percolation within theirrigated area. Irrigation requirements (IR) are determinedby dividing the desired amount of water to provide to theplant (ETc), by the Ea as a decimal fraction (Eq.[1]). Forexample, if it is desired to apply 0.5 inches to the crop witha 75% efficient system, then 0.5/0.75 0.67 inches wouldneed to be pumped. Hence, when seasonal water needs areassessed, the amount of water needed should be based onthe irrigation requirement and all the needs for water, andnot only on the crop water requirement. For more information, consult IFAS bulletin 247 “Efficiencies of Floridaagricultural irrigation systems” (https://edis.ifas.ufl.edu/ae110) and Bulletin 265 “Field evaluation of microirrigationwater application uniformity” (https://edis.ifas.ufl.edu/ae094). Catch cans can be used in the field to measure theactual amount of water applied.Eq. [1] Irrigation requirement Crop water requirement / Application efficiencyIR ETc/EaFertigation/ChemigationIrrigation systems are often used for delivery of chemicalssuch as fertilizers, soil fumigants, or insecticides. The cropmay require nutrients when irrigation is not required, e.g.after heavy rainfall. Fertilizer injection schedules basedon soil tests results are provided in each crop productionchapter of this production guide. Fertigation should notbegin until the system is pressurized. It is recommendedto always end a fertigation/chemigation event with a shortflushing cycle with clear water to avoid the accumulation offertilizer or chemical deposits in the irrigation system, and/or rinse crop foliage. The length of the flushing cycle shouldbe 10 minutes longer than the travel time of the fertilizerfrom the irrigation point to the farthest point of the system.System MaintenanceIrrigation systems require periodic maintenance throughout the growing season. These activities may require systemPrinciples and Practices of Irrigation Management for Vegetablesoperation during rainy periods to ensure that the systemis ready when needed. In addition, drip irrigation systemsmay require periodic maintenance to prevent cloggingand system failure. Typically, cleaning agents are injectedweekly, but in some instances more frequent injections areneeded.Frost ProtectionFor some crops, irrigation is used for frost protectionduring winter growing seasons. For strawberry production,sprinkler irrigation is primarily used with application ratesof about 0.25 inches per hour during freeze events. Waterfreezes at 32ºF, while most plant tissues freeze at lowertemperatures. Overhead freeze protection is efficient forair temperature as low as 26ºF-28ºF, but seldom below. Forvegetable fields with subirrigation systems, the relativelyhigher temperature of groundwater can be used for coldprotection. Growers may also irrigate to raise the watertable throughout the field. Frost protection water requirements vary and depend on the severity and duration offreeze events, the depth to the existing water table level,and field hydraulic characteristics. For more information,consult UF/IFAS bulletin HS931 “Microsprinkler Irrigationfor Cold Protection of Florida Citrus” (https://edis.ifas.ufl.edu/ch182) and bulletin SL296 “Citrus Cold WeatherProtection and Irrigation Scheduling Tools Using FloridaAutomated Weather Network (FAWN) Data” (https://edis.ifas.ufl.edu/ss509).Other UsesOther irrigation uses vary according to the type of crop,system characteristics, and field location. Some examplesinclude: periodic overhead irrigation for dust control;wetting of dry row middles to settle dust and preventsand from blowing during windy conditions; and wettingof roadways and drive aisles to provide traction of farmvehicles.Irrigation SchedulingA wide range of irrigation scheduling methods is used inFlorida, with corresponding levels of water management(Table 5). The recommended method (level 5) for scheduling irrigation (drip or overhead) for vegetable crops is touse together: the crop water requirement method that takesinto account plant stage of growth associated with measurements of soil water status, and guidelines for splittingirrigation (see below). A typical irrigation schedule contains (1) a target crop water requirement adjusted to cropstage of growth and actual weather demand, (2) adjustmentof irrigation application based on soil moisture, (3) a rule3
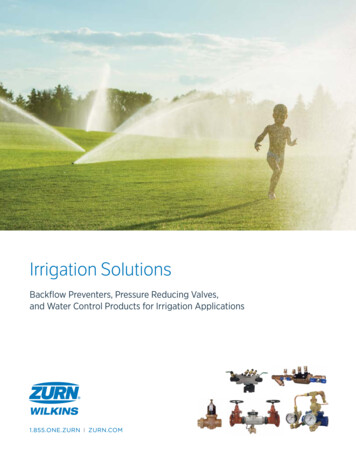
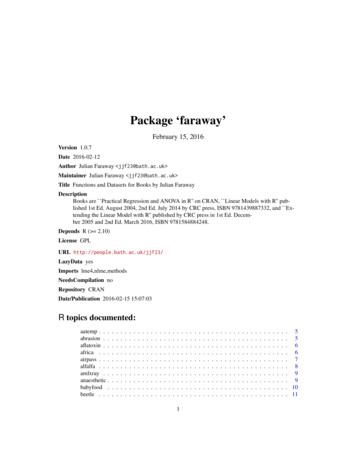
for splitting irrigation, (4) a method to account for rainfall,and (5) record keeping (Table 6). For seepage irrigation,the water table should be maintained near the 18-inchdepth (measured from the top of the bed) at planting andnear the 24-inch depth when plants are fully grown. Watertables should be maintained at the proper level to ensureoptimum moisture in the bed without leading to oversaturation of the root zone and potential losses of nutrients.Water tables can be monitored with a section of PVC pipesunk in the soil with a calibrated float inside the PVC pipe.The calibrated float can be used to determine the exact levelof the water table.in terms of depth (volume of water in soil down to a givendepth over a unit surface area (inches of water)), it can becompared with other hydrologic variables like precipitation,evaporation, transpiration and deep drainage.Practical Determination of Soil FieldCapacity Using Volumetric Soil MoistureSensorsSoil Water Status, Soil Water Tension, andSoil Volumetric Water ContentGenerally, two types of sensors may be used for measurements of soil water status, those that measure soil waterpotential (also called tension or suction) and those thatmeasure volumetric water content directly. Soil watertension (SWT) represents the magnitude of the suction(negative pressure) the plant roots have to create to freesoil water from the attraction of the soil, and move it intothe root cells. The dryer the soil, the higher the suctionneeded, hence, the higher SWT. SWT is commonlyexpressed in centibars (cb) or kilopascals (kPa; 1cb 1kPa; 7 kPa 1psi). For most vegetable crops grown on thesandy soils of Florida, SWT in the rooting zone should bemaintained between 6 (slightly above field capacity) and15 cb. Because of the low AWHC of Florida soils, mostfull-grown vegetable crops will need to be irrigated daily.During early growth, irrigation may be needed only two tothree times weekly. SWT can be measured in the field withmoisture sensors or tensiometers. For more informationon SWT measuring devices, consult UF/IFAS Circular 487“Tensiometers for Soil Moisture Measurement and Irrigation Scheduling” and Bulletin 319 “Tensiometer Service,Testing, and Calibration.”Within the category of volumetric sensors, capacitancebased sensors have become common in recent years due toa decrease in cost of electronic components and increasedreliability of these types of sensors. However, sensorsavailable on the market have substantially different accuracies, response to salts, and cost. Soil moisture sensors aredetailed in the publication, “Field Devices for MonitoringSoil Water Content” (https://edis.ifas.ufl.edu/ae266). Allmethods under this definition estimate the volume ofwater in a sample volume of undisturbed soil [ft3/ft3 orpercentage]. This quantity is useful for determining howsaturated the soil is (or, what fraction of total soil volume isfilled with the soil aqueous solution). When it is expressedPrinciples and Practices of Irrigation Management for VegetablesFigure 2. Example of practical determination of soil field capacity at0-6 inches soil depth after irrigation event using soil moisture sensors.It is very important that the irrigation manager understandthe concept of “field capacity” to establish an irrigationcontrol strategy with the goals of providing optimum soilmoisture for plant growth, productivity, and reduction offertilizer nutrient leaching. Figure 2 represents volumetricsoil water content (VWC) at depth of 0-6 inches measuredby a capacitance sensor during a period of 4 days. For thesoil field capacity point determination, it is necessary toapply an irrigation depth that results in saturation of thesoil layer, in this particular case 0-6 inches. The depth ofirrigation applied is 4,645 gal/ac (equivalent to 0.17 in foroverhead or seepage irrigation, or 34 gal/100ft for dripirrigation with 6 ft. bed centers in plasticulture) in a singleirrigation event. Right after the irrigation events, there wasa noticeable increase in soil moisture content. The degreeto which the VWC increases, however, is dependent uponvolume of irrigation, which is normally set by the durationof irrigation event. For plastic mulched drip-irrigation insandy soils, long irrigation events result in a relatively largeincrease in soil moisture in the area below the drip emitter.The spike in soil moisture appears to only be temporary, asthe irrigation water rapidly drains down beyond the 6-inch4
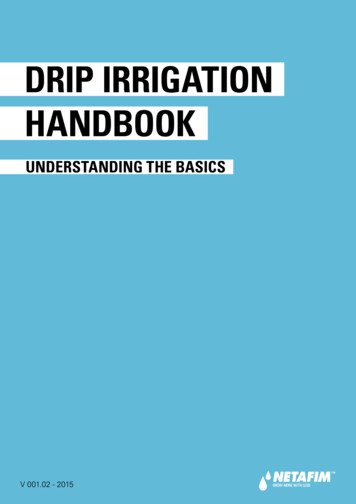
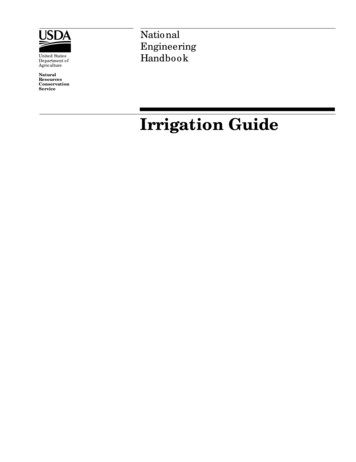
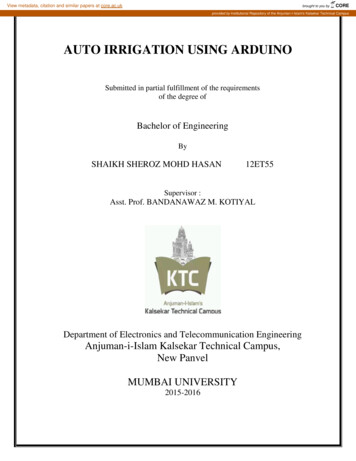
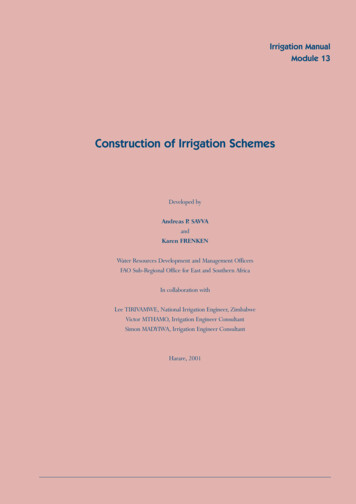
zone (observed by the decrease in VWC). This rapid spikein soil water content indicates that the VWC has rapidlyreached a point above the soil water holding capacityand the water has percolated down to deeper soil layers.Between the end of day 1 and day 3 (Fig. 2), the VWCdeclined at a constant rate due to some soil water extractionby drainage, but most extraction due to evapotranspirationtook place during the day. For sandy soils, the change inthe slope of drainage and extraction lines—in other words,changing from “rapid” to “slower” decrease in soil watercontent—can be assumed as the “field capacity point”.At this time, the water has moved out from the large soilpores (macropores), and its place has been taken by air.The remaining pore spaces (micropores) are still filled withwater and will supply the plants with needed moisture.the soil field capacity is known; the irrigation events startedwhen the volumetric soil moisture content reached valuesbelow the soil field capacity (or 0.09 in3/in3). However,to maintain the soil volumetric water content in the “safeirrigation zone”, a previous determination of the length ofthe irrigation is necessary, to avoid over irrigation (additional information about irrigation depths can be obtainedin the IFAS bulletin AE72 “Microirrigation in Mulched BedProduction Systems: Irrigation Depths” at (https://edis.ifas.ufl.edu/ae049).Examples of Irrigation Scheduling UsingVolumetric Soil Moisture Sensor DevicesIn this section, two examples of irrigation management ofvegetable crops in sandy soils using soil moisture sensorreadings stored in a data logger are provided: one examplewith excessive (“over”) irrigation (Fig. 3) and one withadequate irrigation (Fig.4) using plasticulture. In Figure 3,the irrigation events consisted of the application of a singledaily irrigation event of 4,718 gal/ac (equivalent to 0.18 infor overhead or seepage irrigation, or 36 gal/100ft for dripirrigation with 6-ft bed centers in plasticulture. After eachirrigation event, there was an increase in the soil watercontent followed by rapid drainage. Large rainfall eventsmay lead to substantial increases in soil moisture content.On day 2, right after the irrigation, a large rainfall of 0.44in. occurred, which resulted in a second spike of soil watercontent in the same day. The following irrigation (day 3)started when the volumetric soil water content was abovethe soil field capacity. In this case, the irrigation event of theday 3 could have been safely skipped. Between day 3 and 6,no irrigation was applied to the crop. The volumetric watercontent decreased from 0.14 to 0.08 in3 water/in3 soil. Dueto the very low water holding capacity of the sandy soils,skipping irrigation for several days could lead to unneededcrop water stress especially during very hot days or verywindy days (when high evapotranspiration rates mayoccur), or during flowering stage. Between day 6 and 10,large daily irrigation events were repeated, exceeding the“safe irrigation zone”, and leading to more water drainageand nutrient leaching.Conversely, Figure 4 shows “adequate” irrigation applications for a 10-day period. In this case, the irrigation eventwill start exclusively when the volumetric soil water contentreaches an arbitrary threshold. For this particular situation,Principles and Practices of Irrigation Management for VegetablesFigure 3. Example of excessive (“over”) irrigation of the upper soil layer(0 to 6 inch depth) moisture content for drip-irrigation under plasticmulched condition for sandy soils. Black line indicates volumetricsoil water content using soil moisture sensors. Grey line indicatesirrigation event, single daily irrigation event with volume applicationof 65 gal/100 ft (0.18 in). Dotted line indicates soil field capacity line.Arrows indicate rainfall events.The example in Figure 4 received irrigation depth of 943gal/ac (equivalent to 0.03 in for overhead or seepageirrigation, or 6 gal/100 ft for drip irrigation with 6-ft bedcenters in plasticulture; this irrigation depth was sufficientto increase the volumetric water content to a given moisturewithout exceeding the “safe irrigation zone”. On average,the volumetric soil water content is maintained close tothe field capacity, keeping water and nutrients in the rootzone. For this particular example, there was no deep waterpercolation. In addition, with the information of the soilwater status, the irrigation manager might decide to notirrigate if the soil moisture content is at a satisfactory level.For example, in day 8, due to a rainfall event of 0.04 in,there was no need of irrigation because the soil moisturewas above the field capacity and the arbitrary threshold,therefore the irrigation event of day 8 was skipped. On theother hand, this “precise” irrigation management requiresvery close attention by the irrigation manager. For a givenreason (such as pump issue), the irrigation was ceased5
in day 5 and it was resumed late in day 6. As a result, soilwater storage decreased to a certain level, and if the watershortage is prolonged, the plants would be water stressed.Tips on Installation and Placing of SoilMoisture Sensor Devices in VegetableFieldsThe use of soil moisture monitoring devices (volumetricor soil water tension) has the potential to save irrigationwater application in a given vegetable area by reducing thenumber of unnecessary irrigation events. However, the effectiveness of the use of these sensors depends on a properinstallation in representative locations within vegetablefields. These sensors may be used to monitor water tablelevels in seepage irrigation.Figure 4. Example of adequate irrigation management using soilmoisture sensors for monitoring the volumetric soil moisturecontent of the upper soil layer (0- to 6-inch depth), on drip irrigationunder plastic mulched condition for sandy soils. Black line indicatesvolumetric soil water content using soil moisture sensors. Grey lineindicates irrigation event, single daily irrigation event with volumeapplication of 943 gal/ac (0.03 in.). Dotted line indicates soil fieldcapacity line. Arrows indicate rainfall events.Sensors should be buried in the root zone of the plants tobe irrigated. Most of the vegetable crops have 80% to 90%of the root zone in the upper 12 in., which generally is thesoil layer with higher water depletion by evapotranspiration. For vegetable crops cultivated in rows and irrigatedby drip tapes, the sensors should be installed 2-3 in. awayfrom the plant row. For single row crops (such as tomato,eggplant, or watermelon), the sensor should be placed onthe opposite side of the drip tape; for double row crops(pepper, squash), the sensors should be placed in betweenthe drip tape and plant rows.Sensors need to be in good contact with the soil after burial;there should be no air gaps surrounding the sensor. Soilshould be packed firmly but not excessively around thesensor. In plasticulture, after the installation, the area abovethe sensor should be recovered back with plastic and sealedwith tape.Crop Water Requirement (ET)Crop water requirements depend on crop type, stage ofgrowth, and evaporative demand. Evaporative demandis termed evapotranspiration (ET) and may be estimatedusing historical or current weather data. Generally, reference evapotranspiration (ETo) is determined for use as abase level. By definition, ETo represents the water use froma uniform green cover surface, actively growing, and wellwatered (such as turf or grass covered area).Historical daily averages of Penman-method ETo values areavailable for 6 Florida regions expressed in units of acreinches and gallons per acre (Table 7).Figure 5. Crop coefficient of drip irrigated tomato and strawberry.Principles and Practices of Irrigation Management for VegetablesWhile these values are provided as guidelines for management purposes, actual values may vary above and belowthese values, requiring individual site adjustments. Actualdaily values may be as much as 25% higher on days that arehotter and drier than normal or as much as 25% lower ondays that are cooler or more overcast than nor-mal. Real6
time ETo estimates can be found at the Florida AutomatedWeather Network (FAWN) internet site (http://fawn.ifas.ufl.edu). For precise management, SWT or soil moistureshould be monitored daily in the field.Crop water use (ETc) is related to ETo by a crop coef-ficient(Kc) which is the ratio of ETc to the reference value ETo(Eq. [2]). Because different methods exist for estimatingETo, it is very important to use Kc coefficients which werederived using the same ETo estimation method as will beused to determine the crop water requirements. Also, Kcvalues for the appropriate stage of growth (Tables 8 and9; Fig. 3) and production system (Tables 6 and 7) must beused.With drip irrigation where the wetted area is limited andplastic mulch is often used, Kc values are lower to reflectchanges in row spacing and mulch use. Plastic mulchessubstantially reduce evaporation of water from the soilsurface. Associated with the reduction of evaporationis a general increase in transpiration. Even though thetranspiration rates under mulch may increase by an averageof 10%-30% over the season as compared to a no-mulchedsystem, overall water use values decrease by an average of10%-30% due to the reduction in soil evaporation. ETo maybe estimated from atmometers (also called modified Bellaniplates) by using an adjustment factor. During days withoutrainfall, ETo may be estimated from evaporation from anET gauge (Ea) as ETo Ea/0.89. On rainy days ( 0.2 in)ETo Ea/0.84.Eq. [2] Crop water requirement Crop coefficient x Reference evapotranspirationETc Kc x EToSoil Water Holding Capacity andthe Need to Split IrrigationsAppropriate irrigation scheduling and matching irrigationamounts with the water holding capacity of the effectiveroot zone may help minimize the incidence of excessleaching associated with over-irrigation. In Florida sandysoils, the amount of water that can be stored in the rootzone and be available to the plants is limited. Usually, it isassumed that approximately 0.75 in. of water can be storedin every foot of the root zone. Only half of that should beused before next irrigation to avoid plant stress and yieldreduction (this will help maintain SWT below 15 cb). Anyadditional water will be lost by deep percolation below theroot zone.Principles and Practices of Irrigation Management for VegetablesTable 11 gives approximate amount of water that can beapplied at each event in Florida sandy soil under differentproduction systems. When the calculated volume of waterto be applied in one day exceeds the values in Table 10,then it is necessary to split applications. The number ofsplit irrigations can be determined by dividing the irrigation requirement (Eq. [1]) by the numbers in Table 11,and rounding up the result to the nearest whole number.Splitting irrigation reduces both risks of water loss throughdeep percolation and nutrient leaching. Sandy soil with theavailable water holding capacity of 0.75 in/ft was assumedin these calculations. If a soil contains more clay or organicmatter the amount of water applied during one irrigationevent and stored in the root zone can be increased. It isrecommended to check the depth of wetting after irrigationto assure that the water is not lost from the roots by diggingout a perpendicular profile to the drip line and observingthe wetted pattern.ExampleAs an example, consider drip irrigated tomatoes on 6-ftcenter beds, grown under a plastic mulch productionsystem in central west Florida (sandy soils). For plants ingrowth Stage 5 the crop coefficient is 0.85 (Table 10). If thisperiod of growth occurred in May, the corresponding ETovalue is 4,914 gal/ac/day (Table 7). Daily crop water usewould be estimated as:ETcrop (0.85) x (4,914 gal/ac/day) 4,177 gal/ac/dayIf the drip irrigation system can apply water to the rootzone of the crop with an application efficiency of 85%, theirrigation re
Irrigation systems are generally rated with respect to application efficiency (Ea), which is the fraction of the water that has been applied by the irrigation system and that is available to the plant for use (Table 4). Applied water that is not available to the plant may have been lost from the crop root zone through evaporation or wind