Transcription
FTX Monthly DigestTristan YverDecember 20201
Contents1 FTX in December2 Growth2.1 Volumes: . . . . . . .2.2 Users: . . . . . . . .2.3 Markets: . . . . . . .2.4 Exchange Capacity:2.5 Team: . . . . . . . .3.5556663 “Liquidity Targeting”: Toward More Efficient Liquidity MiningPrograms3.1 Introduction . . . . . . . . . . . . . . . . . . . . . . . . . . . . . .3.2 Method . . . . . . . . . . . . . . . . . . . . . . . . . . . . . . . .3.3 In-depth case study: Curve Finance . . . . . . . . . . . . . . . .3.3.1 Background . . . . . . . . . . . . . . . . . . . . . . . . . .3.4 Analysis . . . . . . . . . . . . . . . . . . . . . . . . . . . . . . . .3.4.1 Step 1: . . . . . . . . . . . . . . . . . . . . . . . . . . . . .3.4.2 Step 2: . . . . . . . . . . . . . . . . . . . . . . . . . . . . .3.4.3 Step 3: . . . . . . . . . . . . . . . . . . . . . . . . . . . . .3.4.4 Step 4: . . . . . . . . . . . . . . . . . . . . . . . . . . . . .3.5 Concluding thoughts . . . . . . . . . . . . . . . . . . . . . . . .88910101111131414154 FTT175 Readers’ Questions172
1FTX in DecemberDecember has been a busy month for FTX. We’ve rolled out an assortment ofproducts, upgrades, and new feature requests. We continue to work on feedbackprovided by the community and are constantly looking for innovative new waysto serve our customer base. Our volume in BTC and ETH derivatives duringDecember was 49.5B and we had a healthy 385B of volume in 2020. FTXalso saw its highest volume day ever - clocking 7.5b.FTX Redesign We conducted many polls about what changes users wouldlike to see from a revamped UI and following months of receiving feedback andproduct iterations, we launched with a completely new UI, with all kinds ofnew bells and whistles: average price and cumulative size when you hover overthe order book; a side panel displaying all of FTX’s markets with the ability tosearch, filter, and favorite; tools for managing subaccounts and more.Pre-IPO Trading With tokenized stocks live, we wanted to innovate furtherand build something even more exciting, something that had never been donebefore in crypto or traditional finance: Pre-IPO futures.Spot Margin Trading From its onset, FTX supported most types of trading(futures, options, spot, OTC, fiat pairs) but one thing that we lacked and customers had been asking for was spot-margin trading. Well, we have that now aswell; users can trade on spot with up to 10x leverage on a wide range of assets.HOT Listings FTX has listed several coins and stocks in November. Stocks(can be traded up to 101x leverage) - ABNB pre-IPO, CB pre-IPO, CRON,TLRY, CGC, ACB, APHA NFLX. Coins - MOB, GRT, BNB-BCH-LTC-XRPLINK-YFI-SUSHI-UNI vs BTC, FIDA, 1INCH, BTC/AUD, BTC/EUR, XMRand CEL. Prediction markets - Superbowl Contracts: NFC-SB-2021.FTX Podcast October was an exciting month for the FTX Podcast withguests including Ghoul of BASED, Bobby Cho co-Founder of CMS Holdings,Dieter Shirley founder of Dapper Labs, Jason Choi Head of Research at Spartan Group, Nishad SinghHead of Engineering at FTX, Soban Saqib CSO atVectorSpace.ai and Ayush Aggarwal President of Blockchain at Berkeley.3
**The Content of the entirety of this digest is for informational purposesonly, you should not construe any such information or other material as legal,tax, investment, financial, or other advice. The content of this digest written byexternal authors do not reflect the views of FTX.4
2GrowthAn extract from the FTX End of Year ReviewOver the course of the year, our tradable assets and markets, users, volumes,and team all grew tremendously:2.1Volumes:This was an explosive year for FTX volumes, increasing by over 1,000% compared to last year with over 385,000,000,000 traded in total and an averagedaily volume of 1,060,000,000, while setting a new all time high (ATH) of 12,000,000,000 in one day; to put that in perspective, in 2019 we saw only 1day with over 1bn in volume, marking our then-ATH, which is lower than our2020 daily average. In December alone, we’ve done nearly 200% of our 2019volume in its entirety, and in one day this year we did more volume than theentire month of December 2019. Also of note, we just recently had our first dayof nearly 1,000,000,000 in daily volume on our spot markets.Our OTC desk has also experienced extreme growth in volumes, increasing10x from the beginning of the year, topping out at 350,000,000 in a single day.We’ve also seen a large increase in volumes for new products on the OTC desk,such as EFPs (exchange of futures for physicals).2.2Users:The FTX user base in total increased by over 1000%, adding well over a hundred thousand new users to the platform, and our active daily users increasedby 786%. In November alone, we added more new users than we had on theexchange in total at the end of 2019.5
2.3Markets:Going into 2020 we had 410 markets listed; those numbers have since grownnearly 3x to a total of 1100 markets. With the rise of assets on the platformcame the ability for traders to utilize more assets as collateral; over the yearwe added support 71 more assets to be used as collateral (31 more cryptos, 10more fiat currencies, and 30 tokenized stocks).In addition to a huge increase in markets and supported crypto assets, we’vealso put in a lot of work to build out our fiat capabilities, adding domesticAUD deposits/withdrawals, SEPA EUR banking, and domestic rails for BRLand TRY via local partners, with more coming out next month!2.4Exchange Capacity:Over the course of 2020 we’ve increased the total number of orders, trades, andusers the exchange can support at once by more than a factor of 10. December2020 was the largest volume month in FTX’s history, and it didn’t have a singleminute of downtime or lag.2.5Team:As we’ve seen a drastic increase in users, volumes, and products, we needed toaggressively grow our team as well. From the 15 employees FTX had at thestart of the year, we’ve hired an additional 37 employees and had the pleasureof welcoming 20 people to our team through the Blockfolio acquisition, bringingour total headcount to 72, a nearly 500% increase. Through these hirings, we’llbe able to better serve our customers and bring you even more of the productsyou want. We’re always in the market for driven, talented people to join ourteam, if you think you’d be a good fit please get in touch! We should add,however, that we have not scaled up to 2,000 employees overnight and have noplans to. As much as our business is expanding, FTX is defined by the qualityand unity of our team, and making sure we don’t endanger that is paramount.We are proud of what we’ve built with a single-digit developer team and would6
not dream of trading that for a huge workforce of disorganized and outsourcedwork.7
3“Liquidity Targeting”: Toward More EfficientLiquidity Mining ProgramsWritten by Benjamin Simon an Analyst at Mechanism Capital andAndrew Kang a Managing Partner at Mechanism Capital: @benjaminsimon97 and @Rewkang3.1IntroductionOf the many new trends to emerge in crypto over the past year, Liquidity Miningis doubtless among the most consequential. In 2019, Synthetix became the firstlarge-scale crypto protocol to successfully launch a Liquidity Mining program.But Compound’s June 2020 release of COMP and its accompanying LiquidityMining program was the true catalyst. In the subsequent months, countlessother crypto protocols—from titans like Uniswap and Balancer to microcapsand forks—have utilized some variant of Liquidity Mining. More than justa network-bootstrapping mechanism, Liquidity Mining has quickly become anintegral part of token distribution strategies.The basic insight behind Liquidity Mining is simple: nascent protocols canhit the ground running, as it were, by offering monetary incentives to participants that provide liquidity to the platform, usually in the form of governance/pseudoequity tokens. As many have noted, Liquidity Mining is just one crypto variantof an incentive strategy frequently employed by companies—think Uber Eats,Seamless, and Grubhub all vying for market share through often-generous promotions.In this article, we propose a rudimentary quantitative framework for analyzing the necessity and effectiveness of Liquidity Mining programs. This ap8
proach—we call it “Liquidity Targeting”—finds an optimal liquidity level for agiven protocol and, from there, backs out a Liquidity Mining rewards schedule.For reasons we will discuss, Liquidity Targeting is far from an exact science andshould not be treated as such. Nevertheless, we hope that this framework mightserve as a quantitative anchor for protocol developers, investors, and communitymembers alike.3.2MethodThe remainder of this article is dedicated to exploring this framework. We beginat the general level, with a discussion of our method, before moving to the moreconcrete realm with a detailed case study.Liquidity Targeting has the following steps: For a given protocol’s product offering (e.g. lending/borrowing, stablecoinswaps), determine the market-leading rate of performance (interest rates,price spreads). Establish the liquidity level (i.e. TVL) that is necessary to achieve orsurpass the desired rate of performance. Determine the rate of yield (APR) that would attract the requisite liquidity level. If Liquidity Mining is already in use, back out the updated emissionsrate that would, at current prices and a target APR, sustain the optimalliquidity level. If Liquidity Mining is not in use and/or if the networktoken is not in circulation, map out various emissions schedules assumingdifferent token prices.There are a few wrinkles in this process worth noting.For one, there may be various metrics by which performance can be measured, leading to more than one “optimal” liquidity level. Moreover, even oncea performance metric has been settled on, establishing a target for performanceis a purely discretionary matter; a protocol may want to match, marginally surpass, or surpass by a considerable amount the performance levels of competitors.The third step in the process (establishing a baseline APR) is tricky as well.A confluence of perceived risks—smart contract risk, economic attack vectors,simple price depreciation—will dictate equilibrium APR for each individual protocol.Last of all, and perhaps most obvious, is the fact that changes in protocolmonetary policy do not take place in a vacuum and themselves have reflexiveeffects. When a revised emission schedule is implemented, the market will likelyincorporate this new information into token price. (For example, the decisionto reduce Liquidity Mining rewards to target a lower TVL might have the second order effect of increasing the token price, such that even with the loweredemissions, liquidity levels remain mostly unchanged.)9
3.3In-depth case study: Curve FinanceIn light of these nuances, Liquidity Targeting might appear confusing. Applyingthis generalized approach to a specific protocol should help to provide a clearerpicture.Of the many Liquidity Mining programs currently in use, Curve’s is one ofthe largest and most well-known—and also perhaps the most hotly-contested—renderingit an ideal candidate for this analysis.3.3.1BackgroundCurve Finance is far and away the leading Decentralized Exchange (DEX) onEthereum for stablecoin and Bitcoin swaps. Unlike Uniswap and other Automated Market Maker (AMM) DEXs which use constant product pricing functions (x * y k), Curve uses a constant sum function (x y k), making ituniquely suited for large trades between equally-priced assets.Though Curve’s AMM achieved product market fit without a token, theteam decided to launch CRV, the DAO governance token, and an accompanyingliquidity mining program in August. Under this program, which is slated tocontinue for another 350 years, CRV tokens are distributed per day to CurveLiquidity Providers across the various stablecoin and BTC pools.The launch of CRV generated a frenzy of activity. Eager buyers marketbought CRV, pushing the price per token above 50 in the first 24 hours (itnow sits around 0.60) and catapulted Curve’s Total Value Locked to over 1.3billionInitially, farming CRV generated three figure annualized yields, but thesehave since settled to between 5% and 30%, depending on the pool, as CRV10
prices dropped and Liquidity Providers were diluted via more capital flowingin. Critics and concerned community members alike have noted the continualdownward pressure that Liquidity Mining puts on the price of CRV. In response,multiple DAO proposals to materially reduce emissions have been put forward,but none have succeeded.Because these debates over token distribution and Liquidity Mining programs are often value-laden—and Curve is no exception—we utilized our Liquidity Targeting approach to see if we could provide a more quantitatively-orientedframework. In what follows, we walk through each of the above-mentioned stepsas applied to this specific case.3.43.4.1AnalysisStep 1:For the protocol’s product offering, determine the market-leading rate of performance.As mentioned previously, Curve’s primary product offerings are swaps between stablecoins and BTC on Ethereum. For the purposes of our analysis, wefocus on the former.Before we can settle on a market-leading rate of performance, there is oneimportant preliminary task: determining the trade size Curve should aim toservice at an optimal price spread. If Curve’s “product offering” is stablecoinswaps with tight spreads, we need to ascertain which swap size Curve shouldregularly support before we can calculate the market-leading performance rate(i.e. the lowest trade slippage).To do so, we tracked stablecoin trades across all of Curve’s pools for a randomperiod of three consecutive days:11
With a sample of just under 300 million in volume and over 2,500 tradesbroken down by trade size, we can infer that stablecoin trades larger than 1million are relatively infrequent. Accordingly, we can settle on the 1 millionlevel as the trade size that Curve’s stablecoin pools should aim to service at amarket leading rate, as larger trade orders can be split up. It should be noted, ofcourse, that this decision is informed by the data but ultimately discretionary:we could have just as easily settled on 2 million or 500,000 trade sizes.After landing on a target trade size, we then move to the task of analyzingmarket performance rates. We compare Curve’s spreads on million dollar stablecoin trades to the performance of other DEXs, CEXs, and a leading OTCdesk:12
These multi-day snapshots1 are not comprehensive, but they provide anaccurate enough portrait of the stablecoin swap landscape at a 1 million tradesize. Curve offers the market leading rate, but not by orders of magnitude.From these data, we can conclude that Curve should target 0.15% spreads (atworst) on million-dollar swaps to retain its edge.3.4.2Step 2:Establish the liquidity level (TVL) that is necessary to achieve or surpass thedesired rate of performance.Once we have defined the “desired rate of performance” as maximum 0.15%price spreads on stablecoin trades of 1 million, the next step of the process isto determine how much liquidity Curve needs in order to guarantee this spread,as spreads are ultimately a function of liquidity levels.At this point in the analysis, we need to get even more granular: each pool onCurve has a different “amplification coefficient” (A), which determines roughlyhow linear the pool’s pricing curve is. The shape of the curve, in turn, dictatesprice spreads for various liquidity levels. Among Curve’s stablecoin pools, theyPool, for example, can perform roughly 5x the trade of the 3pool at the sameslippage and liquidity level, since the yPool has a higher amplification coefficient.Because of this additional differentiating factor, we cannot simply find atarget liquidity level for all stablecoin pools at once, since each will offer differentprice spreads. Therefore, we focus our analysis on the pool that sees the mostthroughput of million dollar trades, which happens to be the yPool.At this point, we have our work cut out for us: we need to establish theTVL necessary for the yPool to sustain 0.15% spreads on 1 million trades.This stage of the process—working backward from an “optimal rate of performance” to a target liquidity level—is perhaps the most involved. Here, wesought out the assistance of Curve’s founder and CEO, Michael Egorov, whoprovided us with an elegant, neatly-derived formula for finding an optimal liquidity level based on a target price spread:L (S / P) * [6 / (1 A)]Where L the liquidity level for one token in the pool, S the trade size,P the desired price spread, and A amplification coefficient of the pool.Running the numbers through this formula with the pre-assigned 15 basispoint price spread yields a minimum yPool TVL of 16 million. If we were totighten our spread target even further to 10 bps, the minimum TVL would be 25 million.1 We snapshotted the Binance order book multiple times within a short time frame toaccount for order book movement.13
It is important to note that the formula assumes a perfectly-balanced pool—whichis often not the case in real time. This, in addition to the fact that not all largestablecoin trades are routed through the yPool, explains the seemingly contradictory result that a lower yPool TVL would have tighter price spreads than atcurrent liquidity levels.Still, the formula enables us to conclude with enough confidence that yPoolliquidity—which has been floating in the 100-200 million range for the pastfew months—is multiples (perhaps even 5-6x) of what it needs to be in order tosupport million dollar stablecoin trades at the market leading rate.3.4.3Step 3:Determine the rate of yield (APR) that would attract the requisite liquidity level.The penultimate step in the process is to settle on a target yield (APR) thatwould, all else equal, attract the requisite liquidity. As mentioned above, thisparticular task is thorny, since Liquidity Mining yield is a function of not onlyliquidity level and emissions rate, but also token price—which itself is affectedby changes to monetary policy.In theory, one could attempt to derive some sort of broader risk-adjusted ratefor crypto yield as a benchmark for yield targeting. Doing so, however, wouldnot be extremely helpful, as each crypto protocol has a unique risk profile thatthe market alone reflects.To keep things simple, we chose to settle on a target range that is slightlyhigher than the current yields in Curve stablecoin pools: 10-15% APR. In practice, this would imply, for example, 20 million in liquidity in the yPool earning10-15% APR, instead of 150 million in liquidity earning 5-10% APR.3.4.4Step 4:If Liquidity Mining is already in use, back out the updated emissions rate thatwould, at current prices and a target APR, sustain the optimal liquidity level. IfLiquidity Mining is not in use and/or if the network token is not in circulation,map out various emissions schedules assuming different token prices.By this point, we have finished the heavy lifting. All that is left is to calculatethe number of tokens distributed weekly to yPool Liquidity Providers. Thebelow matrix shows weekly CRV emissions for various yield and liquidity levels(keeping price constant), with the red box representing our target yield andliquidity level range.14
How do we get from the above data—which is specific to the yPool—to aLiquidity Mining rewards schedule for the entire protocol?Well, a truly comprehensive, protocol-wide Liquidity Targeting analysis wouldrepeat this entire process for each separate pool. However, sparing ourselves thisredundant gruntwork, we can at least use the yPool data as a rough proxy forCurve rewards as a whole.Currently, there are just over 5 million CRV distributed weekly to liquidityproviders. CRV emissions to the yPool represent only 4% of total CRV emissions (or 200,000 CRV per week), based on the “gauge weights” voted on bygovernance. From the yPool data alone, we can infer that yPool weekly emissions can be reduced anywhere from 25% to 75%. And if we use the yPool asan approximation, we can tentatively conclude that total weekly CRV rewardscan be reduced by a proportional amount.3.5Concluding thoughtsThe bottom line is that Liquidity Mining design matters. Inflationary rewardscan be potent weapons for attracting often-fickle liquidity, but they can alsoprove wasteful when exorbitant or unnecessary. Indeed, there is such a thingas over-incentivization, and the price of this mistake is paid not only by tokenholders, but also by the protocol itself, since tokens that are misappropriated forexisting Liquidity Mining programs cannot be conserved for more useful futureincentivization and protocol development purposes. Too often, the marginal costof Liquidity Mining rewards outweighs the marginal benefit. And of course, theopposite can be true as well: protocols that have failed to bootstrap liquiditythrough more organic measures would benefit from ramping up incentives.Attracting liquidity is difficult, and determining how much liquidity is neededis even harder. The process we have outlined in this article is quite involved,even as the methods employed lack scientific precision. Nevertheless, we hope15
that it can serve as a quantitative foundation for the design and evaluation ofboth existing and future Liquidity Mining initiatives.16
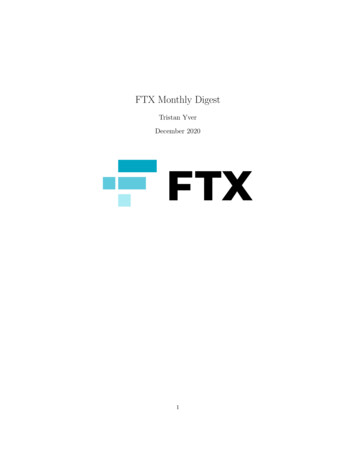
4FTTFTX has burned over 8.9% of the circulating supply of FTT and the insurancefund holds 5.25 million FTT, almost 5% of the circulating supply. Removing13.9% of the circulating supply of FTT from the ecosystem has been achievedin a year and few months. When looking at the graph below, comparing feesbetween exchanges, it is a noteworthy accomplishment. Another exciting occurrence for all FTT holders is that they will receive SRM airdrops for holdingthem on FTX. Find the details here.Figure 1: Fee comparison between exchanges5Readers’ Questionse-mail : research@ftx.com with questions you would like answered about thecryptocurrency and blockchain ecosystem. We shall select certain questionsand dedicate a section to them in next months digest.17
search, lter, and favorite; tools for managing subaccounts and more. Pre-IPO Trading With tokenized stocks live, we wanted to innovate further and build something even more exciting, something that had never been done before in crypto or traditional nance: Pre-IPO futures. Spot Margin Trading From its onset, FTX supported most types of trading