Transcription
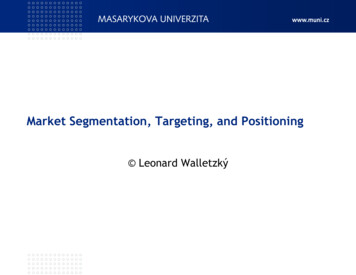
A Method for Segmentation, Matching and Alignment of Dead Sea Scrolls Gil Levi, Pinhas Nisnevich, Adiel Ben-Shalom, Nachum Dershowitz, and Lior WolfThe Blavatnik School of Computer Science, Tel Aviv University, IsraelAbstractThe Dead Sea Scrolls are of great historical significance.Lamentably, in the decades since their discovery, manyfragments have deteriorated. Fortunately, low-resolutiongrayscale infrared images of the Palestinian Archaeological Museum plates holding the scrolls in their discoveredstate are extant, along with recent high-quality multispectral images by the Israel Antiquities Authority. However,the necessary task of identifying each fragment in the newimages on the old plates is tedious and time consuming toperform manually, and is often problematic when fragmentshave been moved from the original plate.We describe an automated system that segments the newand old images of fragments from the background on whichthey were imaged, finds their matches on the old platesand aligns and superimposes them. To this end, we developed a deep-learning based segmentation method and acascade approach for template matching, based on scale,shape analysis and dense matching.We have tested the proposed method on five plates, comprising about 120 fragments. We present both quantitativeand qualitative analyses of the results and perform an ablation study to evaluate the importance of each component ofour system.1. IntroductionThe Dead Sea Scrolls, discovered in caves of the Judeandesert during the years 1947–1956 and dating to the centuries around the turn of the eras, hold great historical, religious and linguistic significance. The tens of thousands ofparchment and papyrus fragments include the oldest known Research supported in part by Grant #01019841 from the DeutschIsraelische Projektkooperation (DIP), Grant #1330/14 of the Israel ScienceFoundation (ISF), and a grant from the Blavatnik Family Fund. It formspart of P.N.’s M.Sc. research and G.L.’s Ph.D. research at Tel Aviv University. This research was made possible thanks to the Israel AntiquitiesAuthority (IAA) Leon Levy Dead Sea Scrolls Digital Library’s digital images. We would also like to thank Orit Rosengarten for her help.Figure 1. Illustration of the matching problem. Left: twosamples of recent color images of fragments taken from plate4Q57 382. Right: an old infrared image of plate M43.022. Oursystem successfully locates the two fragments on the left in thegrayscale image of the whole plate. All images are provided courtesy of the Leon Levy Dead Sea Scrolls Digital Library, Israel Antiquities Authority; color photographer Shai Halevi, infrared byNajib Anton Albina.manuscripts of many works later included in the HebrewBible canon, along with noncanonical and extra-biblicalmanuscripts in Hebrew, Aramaic and Greek that preserveimportant evidence of the diversity and richness of religiousthought in late Second-Commonwealth Judea.Shortly after the scrolls were discovered, grayscale infrared images were taken by the Palestinian Archaeological Museum (PAM) of each plate on which they werestored, often containing dozens of small fragments. Inthe decades since their discovery, many plates have beenreorganized. Currently, high-quality multispectral imagesare being taken at the Israel Antiquities Authority, and areoffered to scholars and the public on the net (at http://www.deadseascrolls.org.il).One of the tasks in this digitization project is that of locating each of the individual fragments on the old grayscaleimages and visually investigating how well they have been
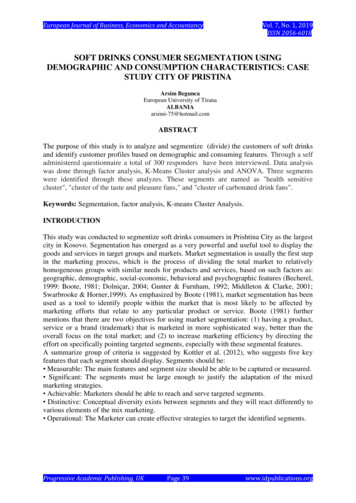
Figure 2. System overview. Our system begins by segmenting theold plate (top left) and the new color image (bottom left). Segmentation results of the old plate and the new fragment are shownat the top middle and bottom middle, respectively. Finally, after amatch is found, the system aligns the two fragments (seen on theright).preserved (see Figure 1). This is a wearisome chore sincethe fragments on a plate can look very similar and be extremely small – often no more than a square centimeter insize – and since many fragments are no longer on the sameplate as when first imaged. Moreover, once the fragment islocated, the conservator needs to visualize in her mind howthe newer image is aligned with the old to reason how wellit has been preserved. There is currently no automated toolto aid in this process.We have developed a two-step method that both automatically locates a given fragment and aligns it against theold images. This will both save time for the conservationteam and provide scholars with a composite image of thenew segment overlayed on top of the old one.First, we segment the fragments on the old plates toobtain a “pool” of candidates. This is challenging as thegrayscale images of the old plates are of low resolution, thebackground has similar intensity to that of the scroll andthere are shadows. We applied both an unsupervised technique based on edge detection [9] and a deep-learning technique that requires some manual labeling to train. Once wehave a set of candidates, we employ a cascade approach tomatch the new high-quality color fragments to the corresponding low-quality grayscale candidate. The cascade iscomposed of a coarse scale test and a coarse shape test, followed by a more detailed dense matching [19, 14] test thatcompares the texture of the two fragments. Finally, we rundense matching again to align the matched fragments. Theoverall system is depicted in Figure 2.We tested our method on five different plates containing a total of 120 fragments and present both quantitativeand qualitative matching and alignment results. We furtherperform an ablation study to investigate the effectiveness ofour system when removing some of the test in our matchingcascade.Our contributions include the following: (i) a deeplearning method for segmentation that is able to work underFigure 3. Alignment example. Left: new high-quality fragmentimage; middle: cropped fragment from old grayscale image; right:the fragment from the old image warped onto the recent image.challenging conditions, which we compare with an edgebased method; (ii) a cascade approach for template matching, wherein each step in the cascade is responsible for adifferent visual feature (scale, shape and texture); and (iii) adense-alignment method to help visualize any degradationa fragment suffered and to enable one to benefit from thecombination of details visible in the old and new images.2. Related workOur method is related to two fundamental lines of workin vision: image segmentation and image registration.Image segmentation. Image segmentation is one of themost studied and fundamental problems in computer vision. Its goal is to separate an image into multiple regions, where typically each region should correspond tosome meaningful information, for example, objects or object parts [6, 40, 18, 20, 1, 29]. Early approaches to image segmentation include thresholding [26], edge detection[33], clustering [7, 28, 37], normalized cuts [35], activecontours [5, 17, 39] and watershed [23, 34, 24].Recently, deep convolutional neural networks (CNNs)which have proven successful in various computer visionapplications [16, 12, 36], have also been applied to imagesegmentation. Specifically, fully convolutional neural networks (FCNNs) were found to be extremely useful for thistask since they are competent in end-to-end training and feature generation and allow one to work with different inputimage sizes. However, the drawback of using CNNs for segmentation is a decrease in segmentation resolution causedby pooling layers. This drawback hinders their applicability to the task at hand, as manuscript-fragment segmentationrequires single-pixel level accuracy.A number of encoder-decoder architectures have beensuggested to cope with this problem, where the spatial information is gradually recovered by a decoder. These include: FCN [20], which performs semantic segmentationusing end-to-end convolutional neural network and introduces skip connections that lead to better performance ofdeconvolution; SegNet [1], which transfers pooling indicesto a decoder from an encoder that makes it more memory
Figure 5. Extracting training patches for segmentation. Bytraversing the boundary of the target (left) and input (right) images, we extract training patches where each point on the boundary corresponds to the center of the patch. Blue squares representpatches and red curves show simultaneous traveling by boundariesof input and target images.Figure 4. Data preparation for training a deep segmentationnetwork. Input image A is transformed into the target image Cvia auxiliary manually-processed image B.efficient; and u-net [29], which was shown to be a good solution for semantic segmentation relying on low amounts ofdata. Of the aforementioned architectures, u-net is the mostapplicable to a situation such as ours where the training setis limited, and we therefore based our network on this architecture.Image registration. Image registration deals with findinglocal correspondences between images that depict the samecontent but have visual differences. Those differences canbe due to illumination, motion blur, view point changes, image quality, etc. A thorough survey can be found in [41].A common pipeline for image registration is composedof applying a local feature detector [31, 30, 13] to identifyinterest points in the image, extracting discriminative localfeatures around those interest-points [21, 2, 4], matchingthem [3, 8, 11] and – if needed – aligning one image to another (e.g. by solving for an affine transformation betweenthe images).A different setting of the problem, one that can be viewedas a generalization of the local approaches, is optical flow,where the goal is to map each pixel in one image to its corresponding pixel in the other [15, 22]. Optical-flow methodslack the discriminative power of local features but enjoy theadvantage of finding dense correspondence where the localmethods are sparse in nature.Recently, a marriage of the two, SIFT flow [19], has beenproposed. In this method, SIFT features [21] are extractedat each pixel, and optical flow is computed between SIFTfeatures instead of raw image intensities.In addition to the general registration approaches described above, there are volumes of work specifically dedicated to document registration. Some approaches use linestructure [10], template matching [27], projective geometry [32] and coarse-to-fine refinement [38].The work most related to ours is probably [38], whichapplies a global alignment step followed by a local refinement step to handle misalignments. The method described herein is different in several respects: First, thatwork assumes the fragments have already been segmented,whereas we handle this task as well. Second, it assumesthat a matching between a pair of fragments has alreadybeen performed, while we handle the matching task as well.Finally, we register the fragments using dense correspondence, which can express finer warping.3. MethodIn the next sections, we describe the pipeline that wehave used to extract the fragments out of the plates and toseparate them from the background. We first describe thesegmentation algorithm that we used for the newly takencolor images of the Dead Sea Scrolls, followed by a description of the pipeline for the old plates that were photographedduring the 1950’s.3.1. New image segmentationRecently, the Israel Antiquities Authority has begun aprocess of taking high resolution images of the all the DeadSea Scroll fragments. They use a high resolution multiwavelength imaging camera. Images of fragments are taken
Figure 6. Network architecture for Deep Segmentation. Our network is based on an encoder-decoder u-net architecture [29] with threelevels and an output level.in different wavelengths in both infrared and visible light,and a color image is created as a composition of a subsetof those. Each fragment is photographed on a black background together with the fragment label, a color target andruler 1.Since the fragments are placed on a dark felt surface,separating them from the background is not a simple task.The ink on the fragment closely resembles the dark background in color and the material preservation condition isgenerally poor, thus there are many holes in the fragment.The first step in our segmentation pipeline is to extractconnected components from the image and detect the fragment boundaries. We do this by converting the color imageto grayscale and then setting a low threshold on the background intensity to extract the foreground components. Thisis followed by a close morphological operation and medianfiltering to remove noise and small holes.Finally, we extract connected components from the binary image, disregard ones whose size is much smaller thanthe full image size and, from the remaining connected components, choose the one that is closest to the center of thebinary image. This seemingly simple pipeline manages tosegment the fragments well enough to perform matching.3.2. Old plate segmentationThe older images of the plates that were photographedduring the 50’s require a different approach for fragmentbackground separation. The images are grayscale and eachplate can contain many small fragments. To segment them,we use an edge-detection segmentation method followed byconnected components extraction. We use a state-of-the-artedge detection method as described in [9]. This method isbased on a learned structured forests model [25] to detectedges.This step is followed by setting a threshold on thegrayscale edge image and computing connected components. We have found that extremely small connected components are usually noise and not real fragments; thus wediscard connected components with area smaller than 0.1%of the whole plate. There are a few drawbacks with thismethod. First, if two fragment boundaries touch one another, it will not segment them accurately but will leavethem connected together. A second drawback of this algorithm is that it is not able to handle shadows very well andoften marks them as part of the fragment instead of marking them as background. Many of the fragments indeed dohave shadows reflected on the plate because they were photographed at some small distance from the plate. For thosefragments, the proposed edge-based segmentation methodmight detect shadow boundary as the true fragment boundary. For domain researchers whose goal is to re-connectfragments this poses a problem. However, for the task ofsearch and alignment it might be suffice.Nevertheless, for more accurate results, we have developed a deep-network based segmentation algorithm. Thisalgorithm is trained on manually segmented plates, and isable to remove shadow reflection more accurately. As opposed to our edge-based method, it is supervised, thus requiring training data that in our case must be manually labeled.
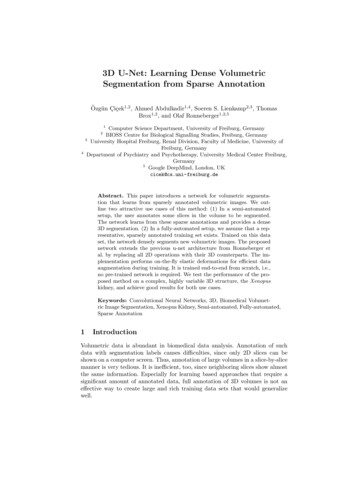
Figure 7. Shape test. On the left two column are segmented images of a candidate fragment pair. On the right are the two segmented fragments on top of one another. It can be visually seenthat their Hamming distance corresponds to measuring how wellthe shapes overlap.3.3. Network-based segmentationSome of the scroll fragment images have a backgroundthat looks similar to the foreground near border points, andfor this reason, correct labeling of each pixel is a difficulttask even for humans who may mark some of border neighboring points incorrectly. To overcome these difficulties, amodel based on a u-net architecture [29] was applied forbinary segmentation of fragments.Data preparation. For training, 21 grayscale images ofscroll fragments were manually separated from the whitishbackground and from shadows, where they occur. Forthis purpose, initial photos (Figure 4A) were manually processed using a basic photo editor, where a background ora shadow were painted black, acquiring images of scrollfragments only (Figure 4B). Binary images of each of thegrayscale images were created by labeling every pixel in thegrayscale images by a binary label, where the foregroundwas labeled 1 and its background 0. Thusly, the background and the foreground were transformed into a blackand white image (Figure 4C) by the following rule, usingIverson brackets: Ci,j [Ai,j Bi,j ], where Ai,j andBi,j are the pixel values of images A and B, respectively, atthe corresponding location (i, j) and Ci,j is the resulting binary value of the binary image C at the same location (i, j),i {1, ., w}, j {1, ., h}, where w and h are the widthand the height, respectively, of images A, B and C. (SeeFigure 4.)By traversing the border of the segment in every binaryimage, 64 64 patches were extracted from both the original images A and their corresponding binary images C. Every boundary point served as the center of each patch. Thepatches were cropped from both A and C images by simultaneous following C’s boundary and corresponding locationon image A – as presented in Figure 5. Figure 4C shows thetarget image C for the network.Network architecture. Our network is an encoder/decoder type of architecture based on the u-netmodel of fully convolutional network suggested in [29]. Inthis model, the spatial dimension of the image is graduallyreduced by the encoder with max-pooling layers, whereasthe decoder retrieves spatial dimension and details ofthe image. The model is suitable for a case of a limitednumber of training images, nevertheless achieving precisesegmentations.Our network architecture is composed of two paths: acontracting path (left) and an expansive one (right), whichcan be viewed as four levels l1 , l2 , l3 , plus output, as illustrated in Figure 6. Each level li , i 1, 2, 3, consists oftwo 3 3 convolution layers and one 2 2 max pooling layerwith a stride of 2 pixels on levels l1 and l2 , where eachconvolution was followed by batch normalization (BN) andrectified linear unit (ReLU) layers.A concatenation of the feature maps from each level li 1and li was performed by upsampling the feature map at levelli with a 3 3 convolution. After concatenation, two 3 3convolutions were applied, each convolution followed bybatch normalization and ReLU layers. At the output levelthe final activation function was sigmoid instead of ReLU.Network training and the loss used. As describedabove, the network was trained using (X, Y ) as a trainingdata, where X is a set of 64 64 grayscale images and Y isa set of 64 64 binary images. For every i {1, . . . , m}Y (i) is the target image for X (i) , where m is the size ofthe training data. ADADELTA was used as an optimizationmethod with learning rate of 0.01 and a batch size of 1200.The loss function was defined as follows:P1loss 5ni,j kYi,j Ŷi,j k1 kŶi 1,j Ŷi,j k1 kŶi,j 1 Ŷi,j k1 kŶi 1,j 1 Ŷi,j k1 kŶi 1,j 1 Ŷi,j k1 .where n is the batch size and Ŷ is the network prediction.This loss function encourages both adherence to the groundtruth as well as additional smoothness of the predicted targets Ŷ .Segment extraction. A trained network with a thresholdθ was used on a plate image I providing segments prediction image Ȳ : [Ŷ (I) θ] · I. Each segment was thenextracted using a connected-components algorithm.3.4. Template matching and alignmentAfter applying segmentation, we obtain a pool of newfragments (taken from the recent high-quality color images)Si , i 1, . . . , n, that need to be matched against a pool ofold fragments (taken from the old grayscale images) Pj , j 1, . . . , m. Next, we employ a cascade approach, in whicheach step handles a particular visual feature of a candidatepair (Si0 , Pj0 ).
Plates4Q574Q574Q574Q574Q57Matches363, M42.002382, M42.000382, M43.022382, M43.162387, M43.0295813318#TP35518Edge Segmentation#FP Recall 8815Deep Segmentation#FP Recall FPR160%1.3%24 100% 7.6%962%3.0%1333%2.2%9127%5.4%Table 1. Matching results. For each set of recent fragment images and corresponding grayscale plate, we show the number of correctmatches found (true positives) – out of the total number of fragments on the plate, as well as the number of false matches (false positives),the true positive rate (recall) and false positive rate (FPR).Scale test. First, we apply a simple scale test to filter outcandidate pairs in which one fragment is much larger thanthe other. The new images Si were taken at an aspect ratio that is about 3 times larger than that of the old images. Assume Si0 is k l pixels and Pj0 is t p pixels. If k 3t Tscale or l 3p Tscale , we discard the pair.We allow a Tscale that is large enough to serve as a coarsetest and will never filter out correct matches.Shape test. Now that we have filtered out candidate pairsthat are vastly different in scale, the second appearance feature we filter for is shape. We found the following simpletest to be extremely useful: resize Si0 to the size of Pj0 , viz.t p, and take both segments’ binary masks by thresholding them (since we applied segmentation, the background isconstant and a simple threshold operation is enough). Denote by Si00 and Pj00 the binary masks, we compute theirPt PpHamming distance kSi00 Pj00 k α 1 β 1 (s0α,β xorp0α,β )/(tp) and discard the candidate pair if this value isabove a predefined threshold Tshape . Again, Tshape is set suchthat this test will filter out fragments that are markedly different, but will be coarse enough not to eliminate any correct matches. This process is illustrated in Figure 7.Figure 8. Segmentation results. We compare between edge segmentation (left) and deep segmentation (right). Notice that shadows remain in edge segmentation, while deep segmentation successfully eliminates them.SIFT flow is defined as:X E(w) min ks1 (p) s2 (p w(p))k1 , t (1)pX η u(p) v(p) (2) min α u(p) u(q) , d (p, q) ε min α v(p) v(q) , d(3)pXDense matching. The final step in our cascade is based ondense matching and compares the texture and content of thetwo images at a finer resolution. We leverage the SIFT flowalgorithm [19]. SIFT flow begins by extracting SIFT [21]descriptors at every pixel of the fragments. Next, the algorithm aims to find the flow w(p) (u(p), v(p)), that is,the displacement of the SIFT feature at pixel p (x, y)at the first image to its location (x u(p), y v(p)) atthe second image. This is done by solving the followingoptimization problem: Let s1 and s2 be the two SIFT images to match. Set ε contains all the spatial neighborhoods(a four-neighbor system is used). The energy function forTerm (1) constrains the corresponding SIFT features to besimilar, term (2) regularizes the flow vectors so that theyare small (η is a parameter) and term (3) forces adjacentpixels to have similar flow values. Optimization is doneusing dual-layer loopy belief propagation.To use SIFT flow as a matching test, we resize the pairof fragments to be the same, apply SIFT flow and use theminimal value of the energy function as a matching score.
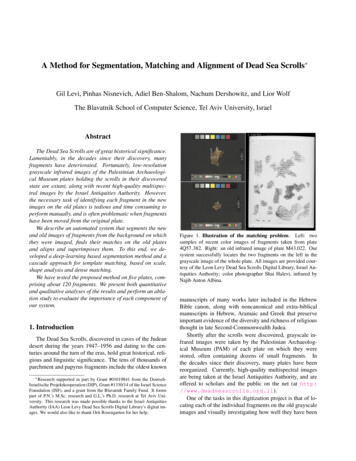
Figure 9. Qualitative alignment results. From left to right: newly taken image of a fragment from set 4Q57 382, corresponding fragmentfrom plate M43.022, registration results of the two; newly taken image of a fragment from set 4Q57 382, corresponding fragment fromplate M42.000, registration of the two.If the score is below a predetermined threshold Tflow , thenthe candidate pair Si0 , Pj0 is considered a match.Alignment. Finally, to align the two matched fragmentsSi0 , Pj0 , we resize Pj0 to the dimensions of Si0 (the newimages Si were taken at higher resolution), run SIFT flowagain and warp Pj0 using the flow w0 obtained. The alignment is illustrated in Figure 3.4. ExperimentsWe apply our proposed pipeline to sets 4Q57 363,4Q57 382 and 4Q57 387 of the recent high-quality colorimages, consisting of fragments of Isaiah found in Cave 4at Qumran written on parchment and dating to the Herodian period. Roughly, 4Q57 363 corresponds to PAM plateM42.002, 4Q57 382 corresponds to M42.000, M43.022and M43.162 and 4Q57 387 corresponds to M43.029.There are five fragments in 4Q57 363, all of which appear on plate M42.002, along with 12 other fragments inM42.002 that are not related to 4Q57 363. There are 18different fragments in 4Q57 382, 8 of which appear onM42.000, 13 on M43.022 and 3 on M43.162. Some ofthe fragments appear on more than one PAM plate. Also,M42.000, M43.022 and M43.162 contain, respectively, 10,4 and 29 fragments that are unrelated to 4Q57 382. Finally,4Q57 387 contains 54 fragments; 18 appear on M43.029along with 13 unrelated fragments. In our experiments, weset Tscale to be 400 pixels, Tshape to be 0.3 and Tflow to be0.7.4.1. Quantitative resultsIn each of our experiments, we chose a pair of recentimage set and its corresponding PAM plate, applied bothof our segmentation methods to the fragments and finallyran our matching and alignment cascade on all candidatepairs of recent and old fragments. This amounts to a largenumber of candidate pairs: when matching 4Q57 363 toM42.002, there is a total of 85 candidate pairs, but only5 of them are positive matches; when matching 4Q57 382to M42.000 there is a total of 324 candidate pairs, only 8of which are positives; 4Q57 382 to M43.022 – 306 candidate pairs, 13 are positives; 4Q57 382 to M43.162 – 576candidate pairs, 3 are positives and finally when matching4Q57 387 to M43.029 there is a total of 1674 candidatepairs to consider, only 18 of which are positives.We summarize the quantitative results in Table 1. Due tothe imbalance between the amount of negative and positivesamples in our test set, we report matching results in termsof both the number of correct matches found (true positives)and the number false matches reported (false positives), andalso give the recall and false positive rates.As can be seen in Table 1, our method is able to achievemarkedly high recall at low false-positive rates. Notice theimproved performance of the deep segmentation method inalmost all cases.4.2. Ablation studyTo further investigate the effect of the different components in our system, we perform an ablation study. To thisend, we repeat the experiments described in Section 4.1 forplates 4Q57 363-M42.002 and 4Q57 382-M42.000, eachtime removing certain tests in our matching cascade. Theresults are presented in Table 2. Note that each of the tests inthe cascade contributes to eliminating false matches, wherethe most important test is measuring dense-correspondenceusing SIFT flow, following by the scale test. Also note thatremoving any of the tests does not increase the number ofcorrect matches.4.3. Comparison of segmentation methodsWe compared the results obtained by the two methods –edge segmentation and deep segmentation. The first methodenabled the system to extract scroll fragments from a plateimage but failed to distinguish between shadows, background and scroll edge sections (Fig. 8, left), whereas withthe second method it was possible to isolate scroll fragmentscontaining written text, thus acquiring the scroll segmentonly (Fig. 8, right). It is feasible to find and align fragments obtained by edge segmentation, but the combinationof fragments obtained by edge segmentation cannot lead tocontinuous text lines since shadows and edge sections interfere with fragment coupling.
Figure 10. Failure cases. The two leftmost image-pairs present false matches of plates 4Q57 382:M43.022 and 4Q57 382:M43.162,respectively. The images on the right of the figure present a correct match that resulted in poor registration. Analyzing these and severalother examples showed that such problems are partially due to errors in the color image segmentation and that, generally, mismatches aremore common when matching very small segments, as one would Q574Q574Q57Matches Scale Shape Flow363, M42.002382, M42.000363, M42.002382, M42.000363, M42.002382, M42.000363, M42.002382, M42.000363, M42.002382, M42.000363, M42.002382, 77733Edge SegmentationDeep Segmentation#TP #FP Recall FPR #TP #FP Recall FPR34 60% 5.0%33 60% 3.7%5 74 63% 23.4%8 101 100% 31.9%31 60% 1.3%32 60% 2.5%5 38 63% 12.0%8 72 100% 22.7%31 60% 1.3%33 60% 3.7%5 22 63% 6.9%8 35 100% 11.0%3 21 60% 26.3%3 15 60% 18.8%6 139 75% 43.9%8 234 100% 74.0%3 16 60% 20.0%3 20 60% 25.0%5 114 63% 36.0%8 186 100% 58.8%33 60% 3.8%36 60% 7.5%5 74 60% 23.4%8 131 100% 41.4%Table 2. Ablation results. Matching performance when removing various tests from our matching cascade.4.4. Qualitative registration resultsTo help analyze the performance of the proposedmethod, we give examples of false matches and of a correct match with poor registration in Figure 10. Such errorsmostly occur when matching very small fragments.matching and aligning segmented fragments, we designed acascade method that is able to obtain high accuracy whilemaintaining a low false positive rate and is able to handlefragments that are extremely difficult to locate (see Figure 1).The feedback we have received from scholars has beenextremely positive and encouraging. Our system alleviatesmuch of the difficulty in fragment matching and registration and will dramatically save time for archaeologists investigating the scrolls. Superimposing multiple images offragments provides scholars with a new tool for determining how well they have been preserved. Furthermore, oursegmentation method can be used for other preservation efforts as well, for example connecting different fragments ofthe same original scroll.5. ConclusionsReferencesIn addition to numerical results for matching, we alsopresent registration results in Figure 9. As can be seen,the ink appears faded on the newly taken images while appearing much sharper on the early grayscale images. Usingsuch visualizations, scholars and conservators can deducethe level of deterioration of the scrolls and their preservation conditions.4.5. F
color images of the Dead Sea Scrolls, followed by a descrip-tion of the pipeline for the old plates that were photographed during the 1950's. 3.1. New image segmentation Recently, the Israel Antiquities Authority has begun a process of taking high resolution images of the all the Dead Sea Scroll fragments. They use a high resolution multi-