Transcription
Create Dashboards thatPeople LoveIntroducing Splunk Dashboard Design GuidelinesIryna Vogler User Experience DesignSeptember 26, 2017 Washington, DC
Forward-Looking StatementsDuring the course of this presentation, we may make forward-looking statements regarding future events orthe expected performance of the company. We caution you that such statements reflect our currentexpectations and estimates based on factors currently known to us and that actual events or results coulddiffer materially. For important factors that may cause actual results to differ from those contained in ourforward-looking statements, please review our filings with the SEC.The forward-looking statements made in this presentation are being made as of the time and date of its livepresentation. If reviewed after its live presentation, this presentation may not contain current or accurateinformation. We do not assume any obligation to update any forward looking statements we may make. Inaddition, any information about our roadmap outlines our general product direction and is subject to changeat any time without notice. It is for informational purposes only and shall not be incorporated into any contractor other commitment. Splunk undertakes no obligation either to develop the features or functionalitydescribed or to include any such feature or functionality in a future release.Splunk, Splunk , Listen to Your Data, The Engine for Machine Data, Splunk Cloud, Splunk Light and SPL are trademarks and registered trademarks of Splunk Inc. inthe United States and other countries. All other brand names, product names, or trademarks belong to their respective owners. 2017 Splunk Inc. All rights reserved.
The SpeakerIryna VoglerDesign Thinking User Experience Collect user requirementsCreate user flow, wireframes, prototypesCreate guidelines
2017 SPLUNK INC.ManyDashboardsAre Not Used
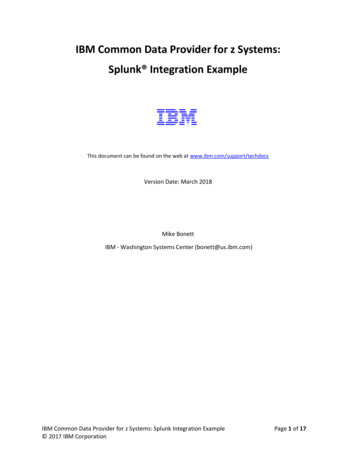
Common Mistakes on DashboardsDefaulting to “All” takesmore resources.Unnecessarydecoration distractsusers.Should put the mostimportant information attop.Waste of spaceThere is not enoughcontext to make thesenumbers meaningful.Notes are too long.Bad choice ofvisualization typeToo long to fit to aoverhead monitor.
Common Mistakes on DashboardsDefaulting to “All” takesmore resources.Unnecessarydecoration distractsusers.Should put the mostimportant information attop.Waste of spaceThere is not enoughcontext to make thesenumbers meaningful.Notes are too long.Bad choice ofvisualization typeToo long to fit to aoverhead monitor.Current Creation Process:DataStyle
Start with the User, Not the Data
Start with the User, Not the Data Questions to ask:who will use this dashboardwhat goals they havewhere will they look at it, for how long, from what devicehow familiar they are with the datawhat they want to see firstwhat they want to do next
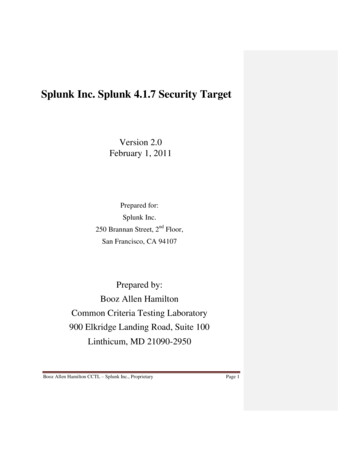
ExampleExampleUserUse CaseBuild a dashboard to monitor and analyze the adoption of a company’smobile apps.Mobile Product Managers. Every PM in the team owns one of the mobile apps.1. PMs want to monitor downloads by platform. The dashboard will bedisplayed on an overhead monitor near where PMs sit.2. PMs want to monitor and analyze user activities by viewing the dashboardon their laptops.
ExampleE-commerce App AdoptionAppEditExportCountryE-commerce AppSubmitUSAWeekly Unique Downloads6,963Total Unique DownloadsWeekly Unique Logins79k57Compared to last weekCompared to an hour beforeDaily Downloads by Device598-145Compared to last week32Compared to an hour beforeDaily User Activity40004000iOSAndroidOthers2000Jul 13,20177,398Weekly Number of OrdersJul 14Jul 15Jul 16Jul 17Jul 18Jul 19Add to cartSave for laterOrder2000Jul 13,2017Jul 14Jul 15Jul 16Jul 17Jul 18Jul 19
Dashboard Design Principles Start with the user, not the data.Organize the layout and interactions to support the user’s workflow.Be succinct.Provide insights at a glance.
2017 SPLUNK INC.Best Practice Example:NoteDon’t.
2017 SPLUNK INC.Best Practice Example:NoteDo. Make sure field names are clear. Renamethem as needed.
2017 SPLUNK INC.Best Practice Example:NoteDo. If necessary put a brief explanatory notebelow a visualization. Note text style is 11pt,#999. Use existing postcss variables wherepossible.
Dashboard Design Guidelines Talk to us: dashboards@splunk.com Stop by at UX Booth and Dashboard Booth
2017 SPLUNK INC.Thank YouDon't forget to rate this session in the.conf2017 mobile app
Example Build a dashboard to monitor and analyze the adoption of a company's mobile apps. User Mobile Product Managers. Every PM in the team owns one of the mobile apps. 1. PMs want to monitor downloads by platform. The dashboard will be displayed on an overhead monitor near where PMs sit. 2.