Transcription
1Physics 1020Experiment 4Force and Acceleration
2Physics 1020Experiment 4Force and AccelerationIntroductionNewton’s second law states that:The acceleration of an object is directly proportional to the net forceacting on it and inversely proportional to its mass 𝐹⃗𝑎⃗ 𝑚Which may be rewritten as' 𝑭 𝑚𝒂
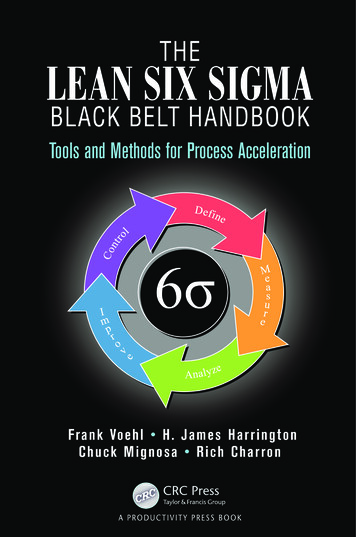
3Physics 1020Experiment 4Force and AccelerationIntroductionFor a system of connected masses, such as is pictured below (Diagram 1),the magnitude of the acceleration of each mass is the same.Diagram 1: Sketch of the system.
4Physics 1020Experiment 4Force and AccelerationIntroductionApplying Newton’s Second law to each of the masses, we obtain the result𝑊, 𝑚- 𝑚, 𝑎 𝑓Where 𝑊𝐵 is the weight of mass B. The symbol 𝑚𝐴 represents the mass ofthe cart and its contents, 𝑚𝐵 is the hanging mass and 𝑓 is the resistive force(friction).
5Physics 1020Experiment 4Force and AccelerationObjectivesIn this experiment, you will investigate Newton’s second law by using asystem of connected masses.You will use the motion detector to determine the acceleration of the system.You will employ unit analysis method to find the meaning of the slope of thegraph of weight of the falling mass vs the acceleration of the system.You will compare your experimental results with the Newton’s second lawtheory analysis.
6Physics 1020Experiment 4Force and AccelerationEquipment ListYou have been provided with:lTracklCartlBlocklPulleylStringlCardlMotion sensorlMass setlMetre stick
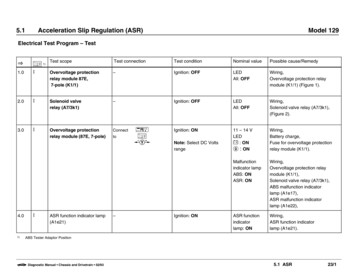
7Physics 1020Experiment 4Force and AccelerationSetup: equipment assemblySetup your experiment:! Place the track with the unblockedend protruding slightly past the edgeof the bench. Place the cart on the track. Place the black block in the cart. Put the 50 g mass and one of the 20 g masses in the cart (lying sideways). Hangthe other 30 g (the 10 g and one of the 20 g) masses from the end of the string. Plug the motion detector into DIG/SONIC 1 on the LabPro and place it at the endof the track.Attach the pulley to the free end ofthe track and run the string from thecart over the pulley.Tape the plastic card to the end of the cart making sure it isn’t low enough totouch the track.
8Physics 1020Experiment 4Force and AccelerationSetup: equipment assemblyCheck your setup:l!–l!Check the levelling by pushing the cart gently left and right to test if it rollsdownhill one way or the other. Adjust the levelling screw as needed.Is the string level?–l!Is the track level?Use a metre stick to make sure the string is exactly parallel to the track. Thelevel of the pulley wheel can be adjusted by first loosening the screw at theside.Is the string too long?–When the cart at the end of the track closest to the pulley, the hanging massshould not be touching the floor. Shorten the string if necessary.
9Physics 1020Experiment 4Force and AccelerationData collectionQQUESTION 1: As the falling weight increases, what happens to the acceleration?lClick on the icon to open Logger ProCLICK HERElCLICK HEREYou should see two graphs on the screen:1.position vs time,2.velocity vs time.If Logger Pro does not contain these graphs, consult an instructor.lClick collect and release the system. Be sure to catch the cart before it hits thepulley.
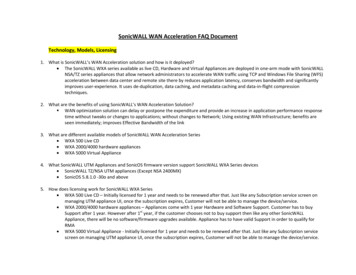
10Physics 1020Experiment 4Force and AccelerationData collectionlActivate the velocity vs time graph by clicking on it.!lHighlight the linear portion of the velocity vs time graph as shown below. Theacceleration of the system is the slope of this part of the graph. UseAnalyze/Linear Fit function in Logger Pro to obtain this.LWlEnter the acceleration in the first line of Table 1.
11Physics 1020Experiment 4Force and AccelerationData collectionIn the first row of Table 1 also:LWCP!LWlrecord the value (in kilograms) of the falling mass,lcalculate and record the weight of the falling mass (𝑊 𝑚𝑔 with 𝑚 in 𝑘𝑔 and𝑔 9.81 𝑚/𝑠2).Have an instructor check the first data set for a reasonable value of a.lExchange the masses so that you have 40.0 g as the falling mass, and 60.0 g on thecart. (The total mass of the system stays constant!)lRun the experiment again. Record the data in your laboratory workbook.lDo five more runs with 50.0 g, 60.0 g, 70.0 g, 80.0 g and 90.0 g as the falling mass,with the total mass constant.lRecord your data in your laboratory workbook Table 1.
12Physics 1020Experiment 4Force and AccelerationAnalysisWe will analyze our data using Graphical Analysis software. Open it by clicking on theicon below.CLICK HERE!CLICK HEREIn Graphical Analysis, plot the weight of the hanging mass versus the accelerationof the system by using Table 1 data.In Graphical Analysis, click Analyze then Linear fit.Double click the pop-up box and turn on Show Uncertainties.LWEnter the slope and its uncertainty in Table 2.Enter the y-intercept and its uncertainty in Table 2.Title your graph and label your axes.PPrint your graph and staple it to your report.
13Physics 1020Experiment 4Force and AccelerationAnalysisQ!QUESTION 2 : From the weight vs acceleration graph, What are the units of theslope? Then do a unit analysis to break this unit down to a simplerunit. Please use SI units.Use a lab balance to weigh the cart, the card, the string and all the masses.Place the cart upside down on the balance so it doesn’t roll off.LWEnter the mass and its uncertainty in Table 3.QQUESTION 3: Compare Table 3 value to the value of your slope. What physicalquantity do you think the slope corresponds to?QQUESTION 4: What are the units of the y-intercept?
14Physics 1020Experiment 4Force and AccelerationAnalysis: TheorylClick here to follow the process of drawing the free body diagrams andwriting the Newton’s second law equations for each mass.!l(link to P1020-lab4-NII-treatment.pdf)lThe information in this file will help you answer questions 5 & 7.
15Physics 1020Experiment 4Force and AccelerationAnalysisQQUESTION 5: By comparing the equation𝑾 𝒎𝒂 𝒎𝒃 𝒂 𝒇!with the equation of a straight line𝒚 𝒎𝒙 𝒃what physical quantities do the slope and intercept of your graphrepresent?QQUESTION 6: Is this answer consistent with your answers to questions 3 and 4?Explain.QQUESTION 7: Compare the value of frictional force you just found with the weight ofthe smallest 30𝑔 falling mass. Is the frictional force 𝑓 smaller, bigger,roughly the same? Is this expected? HINT: What would happen ifthese two values were interchanged?
16Physics 1020Experiment 4Force and AccelerationSummary and ConclusionQQUESTION 8: Identify two sources of uncertainty in this experiment. Are theserandom or systematic?QQUESTION 9: Newton’s second law states that the acceleration of an object willincrease if the net force on it is increased. Did you observe this to betrue? Explain.! Disassemble lab setup. (You will lose marks otherwise!) Close all applications on computer and log out. Submit your laboratory workbook with your graph attached.
Force and Acceleration Analysis QUESTION 2 : From the weight vs acceleration graph, What are the units of the slope? Then do a unit analysis to break this unit down to a simpler unit. Please use SI units. Use a lab balance to weigh the cart, the card, the string and all the masses. Place the cart upside down on the balance so it doesn’t roll off.