Transcription
Industrial and Synchrotron X-ray CT applications for materialscharacterisationGiovanni Bruno, Karsten Ehrig, Holger Haarring, Michael Harwardt, Manfred P. Hentschel, BernhardIllerhaus, Andreas Kupsch, Axel Lange, Dietmar Meinel, Bernd R. Müller, Yener Onel, AndreasStaude, Thomas WolkBAM, Federal Institute for Materials Research and Testing, 12205 Berlin, Germanye-mail: giovanni.bruno@bam.de (and, in general, name.surname@bam.de)AbstractThe combination of tomographic, microstructural data with other experimental techniques and withmodeling is paramount, if we want to extract the maximum amount of information on material andcomponent properties. In particular, quantitative image analysis, statistical approaches, directdiscretization of tomographic reconstructions represent concrete possibilities to extend the power ofthe tomographic 3D representation to insights into the material and component performance. This logicthread holds equally for industrial and academic research, and valorizes expensive experiments such asthose carried out at synchrotron sources, which cannot be daily repeated. We shall show a fewexamples of possible use of X-ray tomographic data for quantitative assessment of damage evolutionand microstructural properties, as well as for non-destructive testing. We will also show how X-rayrefraction computed tomography (CT) can be highly complementary to classic absorption CT, beingsensitive to internal interfaces.Keywords: X-ray Absorption and Refraction CT, Quantitative Image Analysis, Statistical Analysis,Complex Microstructure.1 IntroductionComputed Tomography is nowadays established: a) as a reference technique for calibration of other(non-destructive) techniques; b) in non-destructive testing; c) for 3D material microstructureinvestigations. Its applications, beyond the classic medical ones, span therefore from research toquality control, including artworks and reverse engineering. In many cases, tomography is used as aqualitative tool, in the same wise as microscopy. One grand challenge has in fact always been thereconstruction of 2D radiographs into 3D images with minimal artefacts, especially when complicatedsample shapes are involved. This has perhaps hindered the quantitative use of tomography as acharacterization tool with predictive power. Recently, with the development of all hardwarecomponents (from X-ray generators to disk storage facilities), the technique has greatly progressedtowards quantitative characterization, and even dedicated conferences are running on the subject. Theobvious key to success is the concurrent use of microstructural information from tomography (whoseadvantage lies in its 3D nature, often non-destrucive), other characterization tools (diffraction,mechanical testing etc.), and/or modeling tools (analytic or numeric).In the following, we will show one possible approach that can be used to fully exploit the huge amountof information contained in a 3D tomographic reconstruction.Consider the example of ceramic diesel particulate filters (DPFs). Their macrostructure is typicallyhoneycomb-like (see Figure 1), with channels representing more than 60% of the total filter volume.The ‘solid’ walls are actually highly porous (from 40 to 65% porosity), with a bi-continuousmicrostructure, whereby pores are intermingled with matter. Typical materials for DPFs are low-,sometimes negative expansion ceramics, and usually multi-phase.iCT Conference 2014 – www.3dct.at15
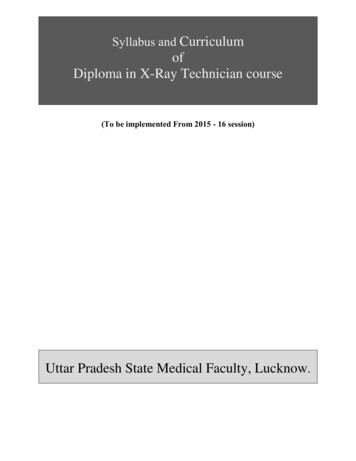
Such complicated materials and components require a truly multi-scale approach, if we want todetermine properties and performance. As mentioned above, tomography can play an effective role,only if other techniques are coupled. This is schematically represented in Figure 1.Neutron DiffractionModelingTomographyMaterials Properties, Microstructure, PerformanceFigure 1: A possible strategy to extract the largest amount of information out of experimental datasets.The strategy adopted in the case of a reaction-sintered SiC DPF was to combine tomography and Finiteelement modeling (FEM) [1,2]; at materials level:- Acquire the 3D microstructure of a wall piece by means of X-ray -CT (microtomography);- Binarize the matter and the pores;- Discretize the structure by means of a cubic mesh (FEM approach);- Apply a virtual compressive load to the single element;- Reconstruct the behavior of the whole ensemble of elements in the wall piece, and generatestress-strain curves for the wall sample;At the same time, independent datasets were needed to assess material properties and performance:- Macroscopic and lattice coefficient of thermal expansion (CTE);- Macroscopic and microscopic strain response to externally applied compressive stress;The microscopic response was measured by neutron diffraction, while the macroscopic behavior wasdetermined by conventional laboratory techniques (dilatometry and extensometry) [3,4].At this point the comparison of the simulated macroscopic and microscopic stress-strain curves withthe experimental data could be used to tailor a few parameters, such as the grain-binding energy . Thiscomparison is shown in Figure 2. There, FEM simulations of the macroscopic stress-strain curvesshow a non-linearity due do increasing local microcracking, also detected by extensometrymeasurements. Simulations could also yield the grain strains, which turn out to be linear as a functionof applied macroscopic stress. The straight lines going through the square symbols (measured latticestrains) represent the calculated lattice strains: the agreement between simulations and experimentaldata is astonishingly good. By changing other simulation parameters, such as the element size and the16
total sample size, we could test the robustness of the FEM approach, and validate the deducted valuesof the grain-binding energy . It is to remark that a direct measurement of is not possible, andcomplicated combinations of experiments (such as high temperature measurements of Young’s moduliby means of sonic resonance) and models (especially Eshleby-like) need to be used to extract roughestimations of it [5,6]. The strategy presented above is much more precise than the analytic approach,and is therefore a very powerful tool to validate other approaches.As one might imagine, this strategy can be extended to the component level; one could:- Acquire a tomogram of a full part;- Discretize the part with a suitable mesh;- Apply the material parameters obtained at the lower level;- Simulate the part response to thermal or mechanical cycle.This approach would be much more realistic than the current industrial standard, since for exampletomograms of full parts would include defect and irregularities, which are not currently inserted inFEM models.aApplied Stress (MPa)-2000b-1500-1000-500c00Micro TransverseMicro AxialMacro Axial -LoadMacro Axial -UnloadFEM Micro AxialFEM Micro TranverseFEM1FEM2FEM3-50-100γ3 0.2 J·m-2γ2 0.3-150γ1 0.4 J·m-d-200Strain (m)Figure 2: (a) Tomogram of a piece of SiC DPF wall; (b) meshing of the tomogram by means of cubic elements; (c)the FEM statement for a compression test; (d) comparison between FEM predictions, mechanical testing (solidblack and grey lines) and neutron diffraction lattice strains (full and hollow squares). Adapted from [1-3].In this overview we will describe the application of this strategy (or at least a part thereof) to a fewselected cases worked out at BAM (Federal Institute for Materials Research and Testing, Berlin,Germany), Division 8.5. We shall show how not only X-ray absorption CT can be effectively used, butalso X-ray refraction, naturally more sensitive to interfaces, can yield complementary and insightfulinformation.iCT Conference 2014 – www.3dct.at17
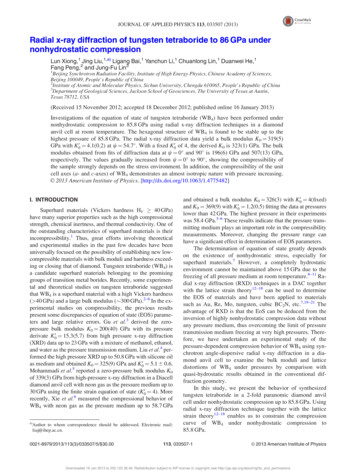
2 Case StudiesIn this section we will review a few case studies, worked out at BAM, Division 8.5.abcdFigure 3: Selection of pieces of equipment available at BAM, Division 8.5, and used for the case studies describedin the text. (a) -CT with X-ray source of 225 kV power; (b) Syn-CT at BAMline, Synchrotron beamline atBESSY II; (c) Laboratory X-ray refraction scanner; (d) refraction set-up at the BAMline, with scheme of themonochromator and analyser crystal set-up.For the microstructural characterizations we will show in the following several pieces of equipmentthat have been employed. They consist of: The -CT equipment shown in Figure 3a, with a source capable of producing X-rays in theenergy range from 30 to 225 keV, a 2048 2048 pixels detector, and a rotating table capableof carrying samples up to 50 kg. The maximum object lateral size is about 200 mm, and thebest resolution achievable is about 5 m. The BAMline, the BAM beamline, located at the synchrotron BESSY II, in Berlin, Germany.The beamline can operate between 5 and 80 keV, with monochromatic beam. The beamline ismultidisciplinary, being equipped with high resolution synchrotron CT (syn-CT), refractionCT, RFA, SAXS, diffraction set-ups. The syn-CT configuration (see Figure 3b) consists of amotorized specimen stage with high precision linear and rotation stages (air-lubricatedbearing, Micos GmbH Germany), as well as a linear stage (air-lubricated bearing table with1100 mm travel range, Johann Fischer Aschaffenburg GmbH), which can move the detectorsystem along the beam. Two CCD cameras (2048 2048 pixels and 4008 2672 pixels) arein use. Depending on the chosen microscope objective and scintillation screen, the nominalPixel size ranges from 15 m to 0.2 μm. For details the reader is referred to [7]. Several laboratory X-ray refraction scanners, exemplified by that shown in Figure 3c. Theyall consist of a Kratky-type small angle scattering set-up, modified with an additional18
absorption detector. 2D or point detectors can be used, as well as different anode materials(typically Cu and Mo for soft and hard radiation, respectively). For a detailed description ofan X-ray refraction scanner, see [8]. In Figure 3d the refraction set-up at the BAMline is alsoshown. It features an analyser crystal, which allows selecting the direction of the refracted (ortransmitted) rays, and a 2D flat detector allowing simultaneous acquisition of refraction maps.2.1 Dimensional control of 3D-printed porous polymer-derived ceramicsA new way of producing ceramic parts with complex geometry or ordered porosity is the additivemanufacturing by 3D-printing of a pre-ceramic polymer with subsequent ceramization [9]. In thisprocess, the pre-ceramic polymer is printed layer-by-layer as powder, fixed with an organic solventand a catalyst for cross-linking the polymer. After the whole part is printed, it is cerammed at hightemperature ( 1000 C) in nitrogen atmosphere.In this multi-stage manufacturing process each step influences the scale and shape of the final object.For the characterization of the manufacturing process it is necessary to quantify these influences forthe determination of the optimum parameters.abFigure 4: The kagome-lattice ceramic part: (a) View of the STL file. (b) The printed structure. [9]Figure 5: Color-coded nominal-actual-comparison of the printed part against the STL-surface. [9]µCT offers the possibility to non-destructively measure the object after every step. Thus, the finalcerammed part, the printed part, and the input CAD drawing can be compared to each other. Thisallows precise determination of the scaling in the different directions and of form deviations.iCT Conference 2014 – www.3dct.at19
As example, a printed part in the shape of a 3D kagome-structure is presented. Figure 4a shows theinput STL-file, while Figure 4b shows the part as printed.CT-measurements were performed at the BAM 225kV-µCT-device at 80 kV acceleration voltagewithout pre-filtering and a resulting voxel-size of 31 µm. The dimensional analysis was carried outwith VGStudioMax 2.1.After printing the part had considerably different dimensions than the input STL-data. The shrinkagewas different along different printer-axes. To separate the dimensional change from changes of shape,a number of cylinders were fitted onto the struts at both, the STL and the CT data. Using distancesbetween parallel struts, scale change factors for the different directions were determined. It turned outthat after printing the part was 0.996 times the original size in X and Y direction (see Fig. 2a for axesdefinition), while in Z direction the shrinkage was larger (factor 0.978). These factors could be used tore-scale the printed object to the design STL file.After correction of the dimensional difference, the CT and STL data were aligned using again the fittedcylinders. The nominal-to-actual comparison (Figure 5) of the two data sets showed form deviationsspecific to the manufacturing process: red, where the pre-ceramic powder was not completely removedafter the printing, and blue, where – due to the cleaning procedure – too much material was removed.A similar analysis was also performed to determine the changes in dimension and shape between theprinted and the cerammed object.With this information on dimensional changes during the different processing stages, it is possible tomodify the printing parameters and the input CAD-data to get a final part with the required properties.2.2 Damage Processes in Concrete Induced by Freeze Thaw CyclesCIF (Capillary Suction, Internal Damage and Freeze-Thaw Test) and CDF (Capillary Suction of DeIcing Chemicals and Freeze-Thaw Test) are equivalently applied for the standardized assessment offreeze and freeze de-icing salt resistance of concrete [10].Figure 6: Time-dependent development of freeze induced cracks in concrete. [10]In the industrial practice, two techniques are used as criteria for the assessment of internal damageprocesses: 1) the increase of ultrasonic time of flight, and 2) the increase of mass induced by freezesuction. In contrast to normative ultrasound test methods, the application of µ-CT measurements20
allows a non-destructive time- and space-resolved analysis of the internal crack formation processduring the CIF-test (see Figure 6).2.3 Analysis of ASR-Induced Damage Processes in ConcreteThe alkali-reactive potential of concrete aggregates was assessed according to the German guidelinesby two different test methods [11].Figure 7: µ-CT setup for analysis of ASR-induced damage processes in concrete.Figure 8: ASR-induced cracks in 2D vertical slices with common (left) and RoI-CT (right) setup.These are: 1) the 40 C fog chamber storage, and 2) the 60 C concrete prim test. In both tests, theexpansion of alkali-silica reaction (ASR)-generating stored concrete prims was used to assess internaldamage processes by ex-situ measurements. The crack formation was temporally and spatiallyiCT Conference 2014 – www.3dct.at21
visualized by µ-CT measurements performed with the equipment described in Figure 3a, on a concretesample with a diameter of 70 mm placed inside a fog chamber storage (see Figure 7).Corresponding to the sample diameter, a voxel size of 41.3 µm was obtained under common µ-CTsetup conditions. This allowed visualizing large ASR-induced cracks. For additional analysis of smallcracks we therefore switched to a RoI-CT setup without the fog chamber storage by moving the sampleas close as possible to the X-ray tube, thus resulting in a voxel size of 9.7 µm (see Figure 8). RoI-CTreconstruction was performed using standard filtered back projection techniques, assuming a constantvalue for the primary beam intensity.2.4 Defect Detection in NTC-Sensors with Synchrotron Radiation CTNegative temperature coefficient (NTC) thermistors are a type of resistors, whose resistance variessignificantly with temperature. Thermistors are widely used as inrush current limiters, temperaturesensors, self-resetting overcurrent protectors, and self-regulating heating elements. They are typicallyused in Li-Ion battery application for hybrid vehiclesMaterials commonly used in thermistors are ceramics and polymers. Thermistors typically achieve ahigh precision within a limited temperature range, typically -90 C to 130 C.Figure 9: NTC-Sensor with pores and cracks in the semi-conducting material. [12]Computed Tomography allowed the measurement of small inner structures which are not accessible toclassic measurement techniques. Using the advantages of synchrotron radiation (e.g. low divergence,tunable monochromatic energy, high photon flux density and high spatial resolution) CTmeasurements of parts with sizes of a few millimeters were performed at BAMline. They can be usedas a reference for further measurements with laboratory µ-CT. We used an energy of 68 keV, aCdWO4 scintillator, and 1200 angle steps over a 180 range.Investigation of NTC took place after alternating temperature shock test (-40 C, 80 C). This ex-situtreatment introduced different inhomogeneities (material inclusions, pores) and defects (delaminations,cracks). They could clearly be observed in 3D-CT images, Figure 9 [12].This example shows the applicability of the synchrotron CT for defect detection, especially insemiconductor materials. Although absorbtion contrast of the semiconductor material is relatively lowcompared with the cable connecting parts, synchrotron CT is able to show 3D material characteristicssuch as cracks and delaminations.2.5 The relationship between soil structure and properties.Soil structure, i.e., the spatial arrangement of solid soil particles, pores and aggregates is crucial for the22
understanding of biogeochemical processes in soil. Kuka et al. have developed a program to forecastthe productivity of agriculture areas by modelling the C-turnover in soils [13]. The most importantparameters are the surface area and the volume the voids within a suitable size range to be chemicallyand biologically reactive. These parameters are only retrievable, if the soil is inspected in undisturbedconditions.Figure 10: Comparision of soil density and root grows (from [16])X: Root surfaceN 48Mean value 1195SD 483Max. 3388Min. 385y 11.3 0.04xr 0.8940Y: SSurf/Vol RatioN 48Mean value 58.5SD 21.5Max. 169.6Min. 29.7200Solid Surface/ Solid volume ratio 003000Root Surface [m² roots/ m³ soil volume]35004000 020400.95 Conf.IntervalFigure 11: Solid surface versus root surface for a distinct soil [16]X-ray computed tomography can provide the means to quantitatively assess soil structure, if the soilcores are taken without changing the geometrical arrangement within the soil [14,15]. From X-raymicro CT, a correlation between soil structuredness and root density was found, as well as ananticorrelation between soil structuredness / root growth and land use intensity. Thanks to the verystable conditions of the CT system, several hundreds of soil samples could be scanned over more thaniCT Conference 2014 – www.3dct.at23
six month. Soil cores of 30 mm diameter and height were scanned with the 225-kV -CT scanner(Figure 3a), with a resolution of 40 µm. The good image quality allowed distinguishing between pores,solid, and root phases. To this aim we used a simple but fast and automated segmentation, which isdescribed in detail in [14].X-ray CT images of soil and of the roots showed qualitative differences of the soil structure and rootsystems in different plots, see Figure 10. In most images, a relationship between soil structure and rootpattern was visible. “Highly structured soils of plots correspond to a dense root system. In contrast, indense soils of plots a sparse root system is developed. Quantitative calculated parameters (root volume-RV, solid volume - SV, pore volume – PV, root surface - RS, solid surface – SSurf, solidsurface/volume ratio – SSVR and root surface/volume ratio - RSVR ) of replications per plot in mostcases have a low standard deviation. These results provide evidence for structural similarity withindifferent plots. A clear relationship (R² 0.87) exists between SSVR and RS (Figure 11). The more RSwas determined the more structured (increasing SSVR) is the soil.” [16]2.6 Connectivity and damping properties of Asphalt.In the development of modern road-building materials one focus lies on the reduction of traffic noise.A typical asphalt road consists of multiple layers with differing mixtures and properties. Onepossibility to influence the traffic noise is the creation of a top layer with a well-defined void spacewhich is connected to the road-surface. For the durability of the pavement, the porosity must not allowwater to penetrate to the interface between top and binder layer.The structure of real pavements was studied using drill cores. The fractions of the different phaseswere determined by measuring the outer size of the drill-core and afterwards decomposing thespecimen into its constituents. The missing volume was thereby interpreted as the integral porosity.With CT it was possible to get information from the core non-destructively and to spatially resolvedmeasure the porosity [17].abFigure 12: (a) Asphalt drill core during CT measurement; (b) Volume rendering of the CT-data for the drill core:gray: the drill core, yellow: the analysed RoI, red: the voids connected to the surface (marked by the bluehorizontal line).Figure 12a shows an asphalt drill core of 70 mm diameter during the CT-measurement. Theacceleration voltage was 210 kV, a pre-filter of 0.5 mm copper and 0.75 mm silver was used. Theresulting voxel-size was 60 µm. For a correct segmentation, the beam-hardening was corrected usinga look-up table. The main goal was to investigate the structure of the pavement as a function of depthfrom the driveway surface. The data set was then aligned to a plane fitted onto the surface of thepavement before further analysis. To exclude disturbances of the structure from the specimen24
preparation, a cylindrical region-of-interest (RoI) was defined with margins of a few millimetres to thespecimen’s surface at the sides and at the bottom (Figure 12b).abFigure 13: (a) Void fraction of each horizontal slice and the integral value for the whole ROI (red vertical line); (b)Fraction of voids connected to the surface in each horizontal slice.Inside this RoI the void fraction in each horizontal slice and the overall porosity was determined(Figure 13a). In order to assess the noise-damping behavior of the structure, the voids connected to thepavement’s surface were segmented by region growing (red in Figure 12b). An evaluation of the voidfraction as a function of depth is shown in Figure 13b. As can be seen, the voids lying below 15 mmfrom the surface are no longer connected with the surface. Apart from the impact on the noisebehaviour, this property is crucial for the durability of the pavement, because the top-layer shall bewatertight to prevent cracking by ice forming at the layer boundary.3 X-ray refraction, and a few case studiesX-ray refraction follows Snell s law, analogous to refraction of visible light by lenses and prisms. Themajor difference between visible light and X-rays is that the refractive index n of X-rays in matter isslightly smaller than 1. This causes ray deflections of very small angles (up to a few minutes of arc),and convex objects create diverging and concave objects converging X-rays. The refractive scatteringsignal is sensitive to internal specific surface , and becomes larger with increasing [18]. The typicalexperimental equipment consists of a standard fine structure X-ray generator providing monochromaticradiation. The refraction effect is measured using a commercial small angle scattering X-ray camera ofthe Kratky type, and using two scintillation detectors. These are used to measure the X-ray refractionintensity IR, and the transmitted intensity IA (see Figure 14).If the linear attenuation coefficient µ and the sample thickness d are known, measurements of IA (withsample) and IA0 (without sample) permit the determination of the porosity p: d ln( I A0 / I A ) /(1 p )(1)We can also calculate the quantityCm d I R / I R0 1I A / I A0(2)Cm is referred to as the refraction value of a material. It represents a relative measure for the internalspecific surface . In many cases, this internal surface is dominated by microcracks, but we will seeiCT Conference 2014 – www.3dct.at25
that pore surfaces and interphase grain boundaries (in general interfaces, where the X-ray refractiveindex n has a substantial jump) can also heavily contribute to the refraction signal.Figure 14: Typical set-up of an X-ray refraction experiment.An important feature to mention is that X-ray refraction is strongly dependent on the orientation of thedefects. Moreover, by limiting the beam size, it is possible to map samples (in 2D). If the samplegeometry allows it, a rotation around an axis perpendicular to the incident beam will allow acquisitionof refraction radiographs, and successive tomographic reconstruction thereof.3.1 Sintering of SiC ceramics.As an application of X-Ray Refraction Topography to ceramics research we show the case of sinteredSiC. Figure 15a shows the refraction mapping (also called topograph) of a SiC ceramic sample in thegreen body state (44 % porosity), Figure 15b shows the same sample in an intermediate state (sinteredeat temperatures around 1900 C, and having 16 % porosity), and Figure 15c shows the sample in thefully sintered state (fired at about 2200 C, and having 3 % final porosity).abcFigure 15: Refraction maps (topographs) of the pore size distribution (color scales on the top) of SiC before (a),during (b), and after sintering (c) at different temperatures; p: porosity (see [19]).The porosity could be measured by the absorption of the primary beam, see eq.(1), and the refractedintensity could yield a direct measure of the specific surface. Assuming spherical pore shapes, the ratioof the two quantities Cm d and d (equations (1) and (2) ) yields an average pore size within each26
scattering volume of 0.1 mm³, thereby allowing porosity mapping. This kind of information (as thesimple spatial distribution of porosity itself) is completely precluded to conventional technique such asmercury or gas porosity.The refraction maps of Figure 15 [19] show the spatially resolved mean pore size distributions.Compared to the quite homogeneous green body, the pore size is raised in the centre area after firing at1900 C. The statistical variance remains comparable to that of the green sample. After firing at 2180 C, the mean pore size reaches 2.1 µm. However a variance of 50 % in pore size could be measured,although the spatial distribution looks homogeneous. Local clustering occurs, most probably due topore segregation. The decomposition of the statistical arrangement of different pore sizes into clustersof similar pore sizes is a new observation in ceramics.3.2 Cracking and delamination in Ti matrix composites.A Low Cycle Fatigue (LCF) composite sample provided by MTU Aero Engines, Germany (cylinder of3.5 mm diameter) was tested, as representative of an aircraft bling (bladed ring). As reinforcing fibrethe SCS6-fiber from Textron was taken. The fiber had a 33 μm diameter carbon core, with a 1 μmpyro-C-protective coating, followed by SiC, and again by a pyro-C-protective coating of 3 μm. Theoverall diameter of the fibre measures 140 μm. The fibres were coated (30 μm) with Ti-6242 alloymaterial by magnetron sputtering, and then bundled and formed by Hot Isostatic Pressing (HIP).Mechanical tests, including static loading and fatigue, were performed (in the direction parallel to thefibers) in order to extract several mechanical quantities.Figure 16: Reconstruction of the data set taken by Synchrotron Refraction Computed Tomography (scatteringplane of the analyser crystal parallel to the fibre direction). The Ti matrix is shown semi-transparent, while thefibres and their Carbon core are solid. The main fatigue crack (red color) in the matrix is clearly visible. [20]Figure 16 [20] shows a 3D visualization of the reconstruction by filtered back projection of theSynchrotron Refraction Computed Tomography. The orientation of the scattering plane of the analysercrystal was parallel to the fibre direction. Like in the case of absorption CT measurements (not shown)the visualization contains all the information about the fibre distribution and orientation in the Timatrix.The main fatigue crack is clearly visible (horizontal red structure in the semi transparent matrix). For abetter visualization of the crack distribution in the specimen, the crack was extracted from the data setand shown separately in Figure 17a. This shows all cracks that have its main interface componentperpendicular to the load direction. Complementarily, Figure 17b shows the distribution of cracks thathave their main interface component parallel to the load direction. From the data analysis it is clear thatthe main crack is oriented perpendicular to the load direction and located in the Ti matrix. The fatigueiCT Conference 2014 – www.3dct.at27
cracks are oriented parallel to the load direction and located at the fibre/matrix interfaces. During thefatigue test the fibers debonded from the matrix. This led to partial failure of the specimen.abFigure 17: Visualization of (a) the main fatigue crack of the LCF sample without matrix and fibres. The scatteringplane of the analyser crystal is parallel to the fibre direction; (b) fatigue cracks along the fibre surfaces of the LCFsample without matrix and fibres. The scattering plane is perpendicular to the fibre direction. [20]3.3 Combined use of absorption and refraction CT: porous cordierite.We have used X-ray refraction and absorption CT to characterize porosity and pore orientation incordierite diesel particulate filter materials, of the same kind as those mentioned in the introduction.Different implementations of X-ray refraction have been utilized: simple scattering (0D,refractometry), laboratory 2D mapping by sample scanning (topograph), 2D laboratory tomography,and
determined by conventional laboratory techniques (dilatometry and extensometry) [3,4]. At this point the comparison of the simulated macroscopic and microscopic stress-strain curves with the experimental data could be used to tailor a few parameters, such as the grain-binding energy . This comparison is shown in Figure 2.


![[AWS Black Belt Online Seminar] AWS X-Ray](/img/17/20200526-blackbelt-x-ray.jpg)