Transcription
Results Note11 April 2022Trellidor Holdings LtdA Series of Unfortunate EventsShare Code: TRL – Market Cap: R267m – PE: 7.9x – DY: 3.9%12m Target Price580cpsShare Price285cpsImplied Return103%Industrials South AfricaTrellidor – Share Price Since Listing60050040030020010028 Oct 2128 Oct 2028 Apr 2128 Oct 1928 Apr 2028 Oct 1828 Apr 1928 Oct 1728 Apr 1828 Oct 1628 Apr 1728 Oct 15028 Apr 16Share Price (cents per share)700Sources: Profile Media & Blue Gem ResearchTrellidor – Group RevenueGroup Revenue 0300,000,000200,000,000100,000,000FY FY FY FY FY FY FY FY FY FY FY13 14 15 16 17 18 19 20 21 22E 23ESources: Trellidor & Blue Gem ResearchHome Improvement & Build Materials Stocks:EV/EBITDA (x) versus ROCE (%) RelationshipEV/EBITDA (x)H1:22 Results: Riots, Strike, Shortages & Curveballs The riots in July & the metalworkers strike (c.12% lostproduction time in Trellidor) combined with stock shortages inthe Taylor to hurt sales & pressure margins. Despite losing an estimated c.R25m of turnover & c.R12m ofEBITDA to these unfortunate events, Group revenue managedto be maintained at R284m (H1:21 – R282m). Gross margin contracted to 40.1% (H1:21 – 44.6%), EBITDA fellto R46.5m (H1:21 – R57.8m) & HEPS contracted to 25.4cps(H1:21 – 30.6cps). As a final curveball, a contingent liability has manifested in theform of an adverse labour judgement being upheld. We haveassumed an R29m one-off expense in H2:22 due to this &management have skipped their dividend in anticipation ofhaving to fund this drawdown.Our Thoughts: Better H2:22 Likely We expect that in H2:22E, the acquisitions in Trellidor Retail,the full-period consolidation of the UK, the maintenance of fullproduction in the factories and more aggressive price increasesare all likely to see some of the H1:22 underperformanceclawed back. Despite this, recent raw material price spikes (from RussiaUkraine) & supply chain disruptions (from China’s latest COVIDoutbreak meeting its zero COVID policy) put this view at risk.Forecast, Valuation & Implied Return: Worth 400cps Our DCF Models imply that Trellidor is worth c.469cps(previously: 548cps) on a PE of 13.2x & EV/EBITDA of 7.3x. Our Relative Valuation implies a fair value of 411cps (previously470cps), which does not agree with the above DCF. Despite this,both models indicate a fair value for Trellidor at least greaterthan 400cps (well above the current 285cps share price). Rolling this DCF SOTP fair value forward we arrive at a 12m TPof 580cps (previously 656cps) implying a total return of eRelativelyundervaluedPPCCashbuild0.0%5.0%10.0% 15.0% 20.0%Return on Capital Employed (%)Trellidor25.0%Sources: Various Company Reports, Profile Media, Iress& Blue Gem Research workings & assumptionsKey Forecast (Rm)FY 20YoY %H1:21AFY 21YoY %H1:22FY 22EYoY %FY 23EYoY 885610%4653-37%8763%HEPS (cps)13.8cps-66%30.6cps40.7cps 100%25.4cps19.7cps-51%47.7cps142%Normalized HEPS (cps)*13.8cps-66%30.6cps40.7cps 100%25.4cps42.0cps3%47.7cps14%Return on Equity (%)-17.6%16.4%22.6%12.6%10.8%21.5%Price Earnings Ratio (x)*20.7x15.2x7.0x11.2x14.4x6.0xDPS (cps)8.0cps-60%10.0cps21.0cps 100%-100%9.5 100%Dividend Yield (%)2.8%7.0%7.4%0.0%0.0%3.3%Sources: Trellidor Holdings, Iress, Profile Media, Bloomberg, and various Blue Gem Research assumptions & workings; * Excluding R29m labour BlueGemResearchwww.BlueGemResearch.co.za – Confused by this report? View our methodology andFAQ. Please refer to disclaimer at the end of this document and on website
Trellidor Holdings Ltd – Results Note – Blue Gem Research – 11 April 2022Key Forecast (Rm)FY 20YoY %FY 21YoY %H1:22FY 22EYoY %FY 23EYoY -13.6%11720423.8%109198-3.0%2032.4%Gross 8763%2.8%-20.6%16.4%-16.4%10.1%-16.1%--28-165%3040 100%2419-53%45142%Issued Shares ted Ave. Shares (m)102.4-4.5%99.397.7-5%95.295.2-2.5%95.20.0%Gross Profit Margin (%)Operating expensesEBITDAEBITDA Margin (%)Net Profit (Parents)EPS (cps)-27.2cps-168%30.6cps40.7cps 100%25.4cps19.7cps-51%47.7cps142%HEPS (cps)13.8cps-66%30.6cps40.7cps 100%25.4cps19.7cps-51%47.7cps142%Normalized HEPS (cps)**13.8cps-66%30.6cps40.7cps 100%25.4cps42.0cps3%47.7cps14%Price Earnings Ratio (x)**20.7x-15.2x7.0x-11.2x14.4x-6.0x-Dividend Per Share (cps)8.0cps-60%10.0cps21.0cps 100%0.00.0-100%9.5cps 100%Dividend Yield (%)2.8%-7.0%7.4%-0.0%0.0%-3.3%-Dividend Cover roperty, Plant & EquipmentIntangible 3-15%22438%Current %Current AssetsInterest-bearing LiabilitiesNet Debt8318%7481-2%9110631%64-40%Net Debt:Equity (%)52%-40%46%-47%61%-30%-Net Debt: EBITDA (x)6.9x-0.6x1.0x-2.0x2.0x-0.7x-Shareholder’s Equity (Parent)159-28%18517611%192174-1%21121%NAV per share AV per share -to-Book ook (x)3.8x-2.9x3.1x-2.8x3.6x-2.3x-Free Cash Flow /Free Cash Flow Yield (%)-2.8%-21.4%15.9%-2.0%3.1%-19.0%-Cash Conversion Ratio (%)-81%-64%66%-16%22%-73%-Return on Equity (%)-17.6%-16.4%22.6%-12.6%10.8%-21.5%-Return on Capital n on Assets (%)-7.2%-17.1%11.0%-11.4%5.1%-10.5%-Sources: Trellidor Holdings, Bloomberg, Iress, Profile Media, Blue Gem Research workings, assumptions, and forecasts; * We have assumed none (previously:1.5%) of the Group’s issued share capital is bought back in the forecast years; **Excluding R29m labour settlement in H2:22E; *** Artificially low as investmentin working capital creates short-term drag on the cash flows across the Group.2 P a g e
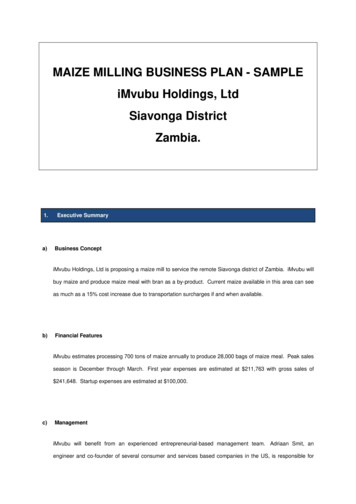
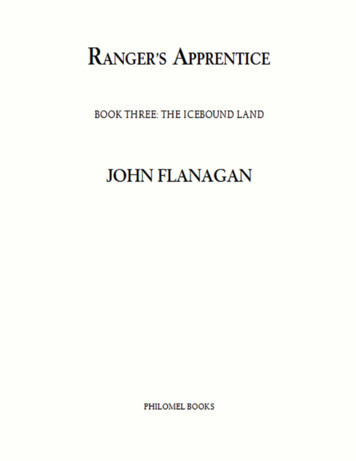
Trellidor Holdings Ltd – Results Note – Blue Gem Research – 11 April 2022FY 21 Results Summary Trellidor (code: TRL) reported a tough H1:22 period:o The domestic riots in July (7 days of lost production in the Trellidor segment), the NationalMetalworkers strike (15 lost days in the Trellidor segment) and stock shortages from globalsupply chain disruptions (in the Taylor segment) conspired to hurt sales and create marginpressure with overhead absorption suffering.o Despite the Group losing an estimated c.R25m of turnover & c.R12m of EBITDA to theseunfortunate events, revenue managed to be maintained at R284m (H1:21 – R282m) asTrellidor Retail (the subsidiary that houses the acquired domestic franchisee operations) andthe UK operation performed superbly (respective revenue growth of 27% y/y & 45% y/y).o Gross margin contracted to 40.1% (H1:21 – 44.6%) and EBITDA fell to R46.5m (H1:21 –R57.8m) and HEPS contracted to 25.4cps (H1:21 – 30.6cps). Note that if the lost revenue andEBITDA were to be included in these results, Trellidor would have had a strong H1:22 period!o Cash generation was not as strong as usual (cash from operations of R18m versus R48m inH1:21) as management made a logical decision to invest more into working capital as ahedge against supply chain disruptions & raw material inflation. The latter, though,management aim to claw-back with above-average and more frequent price increases in H2(estimated average price increase is c. 15% to the average unit price).o Group debt levels remain manageable (Debt:Equity of 51%) with good interest cover.o Finally, management has decided to skip their dividend as a contingent liability hasmanifested in the form of an adverse labour judgement being upheld. We have assumed anR29m one-off expense in H2:22 due to this. Furthermore, we have excluded it from“Normalized HEPS” to attempt to reflect the operationally better H2:22 period we expectfrom the Group & expect dividends to resume in FY 23E.Figure 1: Trellidor Holdings’ Segmental SplitPercentage of Group (%)Impact of the estimated R29mone-off labour 1.7%45.6% 45.0%50.0%41.6%44.6%42.3%43.2%40.1% 40.0% 41.5%40.0%30.0%23.6%20.6%17.7% 18.9%16.4% r segmentOperating ProfitTaylor segmentFY 17FY 18FY 19FY 20 H1:21 FY 21 H1:22 FY 22E FY 23E FY 24EGross Margin (%)EBITDA Margin (%)Sources: Trellidor, & Blue Gem research workings The Group continued to grow its route-to-market & product range, consolidate Main Centrefranchisees where possible & has begun some ESG efficiency & risk initiatives:o New management in the UK performed well (revenue 45%) and, with borders nowreopened, Group management has just returned from there and maintain their optimism onthe region and its operations.o During the period, the Group purchased the Johannesburg North and Midrand franchiseswhile a Cape Town South franchise was also acquired post-period (i.e. in H2:22E).o Management has invested in eCommerce for the NMC business and expects this platform togo live during H2:22.o Trellidor introduced 3 new products & Taylor 1 new product during the period.3 P a g e
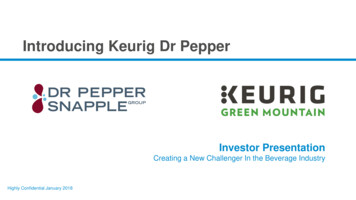
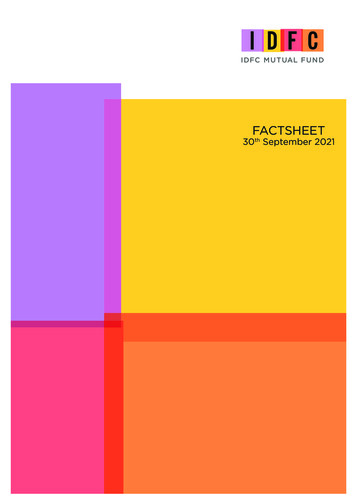
Trellidor Holdings Ltd – Results Note – Blue Gem Research – 11 April 2022oFinally, management invested in solar power at Trellidor’s Factory A (aiming to lower itsreliance on Eskom power by 30%), a reverse-osmosis plant was commissioned to lowerharmful chemical use and increase grey water capacity. A further solar power project isplanned for Factory B in FY 23. Not just good ESG initiatives, but these investments shouldadd to the Group’s efficiencies and lower its operational risk.Trellidor Segment Trellidor’s revenue rose 5.4% y/y as the c.12% lost production (i.e. 22 days in the half-year) was offsetby the stellar performances of Trellidor Retail and the UK operation (respectively growing revenue 27% and 45% over the period).Unfortunately, the lost production saw fixed cost absorption negatively impact on this segment’sprofitability (both in GP and OP levels) and EBITDA retreated to R34.1m (H1:21 – R36.0m) withOperating Profit slipping to R29.3m (H1:21 – R31.2m).We expect that in H2:22E, the acquisitions in Trellidor Retail, the full-period consolidation of the UK,the maintenance of full production in the factories and more aggressive price increases are all likely tosee some of the H1:22 underperformance clawed back. Management has asserted as much, thoughrecent raw material price spikes (from Russia-Ukraine) & supply chain disruptions (from China’s latestCOVID outbreak meeting its extreme zero COVID policy) do put this at risk.Importantly, though, the Group’s long-term strategic priorities remain the same and progress onproduct expansion (Figure 2) and regional expansion (Figure 3) continue. While the current period hasbeen particularly noisy, we consider the quiet, continued execution of the Group’s strategy as astrong signal about management’s quality and the likelihood of a good recovery from this period.Finally, the Group’s Sales and Marketing Director of Trellidor, Peter Rawson, will retire at the end ofF22 Q4. Management is currently seeking a suitable replacement.Figure 2: Sales Mix & Trends100%90%“New” productsare steadilygrowing theircontributionacross the Group’sroute-to-market.Percentage of Sales (%)80%70%60%50%40%30%20%10%0%FY 17FY 18H1:19FY 19H1:20FY 20H1:21FY 21H1:22Security Shutter6%11%12%12%13%12%13%12%17%Polycarbonate %Clear Guard14%13%12%12%13%12%15%14%12%Traditional Trellidor73%68%69%70%66%68%65%67%56%Source: Trellidor website, various Trellidor documents & Blue Gem workings & assumptions Non-security shutter products now make up c.44% of the segment’s revenue (Figure 2).Main Centers contribute c.35% to the segment and remain a clear target for accretive consolidation. Ifthe Group can maintain its track record of post-consolidation revenue growth (see above TrellidorRetail and UK revenue commentary), this bodes well for the Group’s prospects. The outlying areas,though, should remain franchisees that allow the Group tactical (and capital-lite) reach into theselower volume regions.4 P a g e
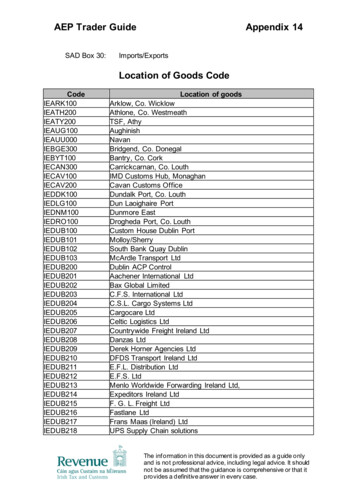
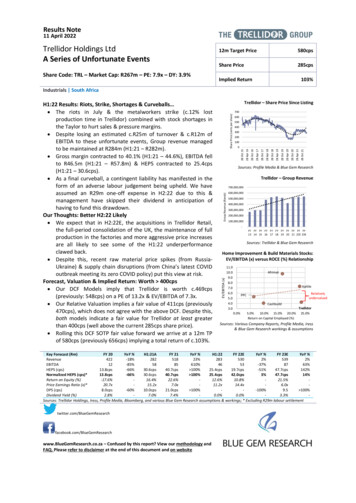
Trellidor Holdings Ltd – Results Note – Blue Gem Research – 11 April 2022Figure 3: Trellidor’s Regional Sales Split100%90%Percentage of Sales (%)80%70%60%50%40%30%Size of the accretiveopportunity to deploycapital in buying maincentre franchisees.20%10%0%FY 16FY 17FY 18H1:19FY 19H1:20FY 20H1:21FY 21H1:22UK & %21%17%15%13%Outlying Regions44%45%46%43%42%43%43%43%41%39%Main Centers40%39%37%37%37%36%32%38%37%35%Sources: Trellidor and Blue Gem Research workingsIn Table 2, we show our segmental forecast and, further, how it pushes down to a segmental-level DiscountedFree Cash Flow (DCF) valuation. Other than discount rates and related assumptions (refer to the “Valuation”section for details on these), we have assumed the following in this segment: 3-weeks of revenue lost in H1:22 are not made up in H2:22 and margins stabilize but only start torecover into FY 24E,An R29m labour settlement is paid out in full in H2:22. Though we exclude this from the Group’sNormalized HEPS calculation we disclose in our Group-level forecasts, this is a cash-based outflowand, thus, knocks on into cash flows, liquidity and solvency and, ultimately, into our DCF valuation, &We have increased our long-term inflationary view to 4.0% (previously: 3.2%).Table 2: Trellidor Segmental Forecast & Discounted Free Cash Flow (DCF) Model(Rm)H1:22FY 22ERevenue332Revenue (%)5.2%Gross Profit149Gross Profit Margin (%)45.0%Operating Profit50EBITDA3462Tax-8-13Working Capital-16-14Capex-4-11Free Cash Flow (FCF)724Discount Rate0.90Discounted FCF22Enterprise Value (EV)EV/EBITDA (x)Sources: Bloomberg, Blue Gem Research and Trellidor HoldingsFY 23E3361.3%15546.0%5465-1310-11510.8543FY 24E3431.9%16548.1%6072-156-11520.7640FY 25E3532.9%17048.1%6173-15-2-11450.6831FY 26E3663.9%17648.1%6376-16-2-12460.6128FY 27E3803.9%18348.1%6579-17-2-12480.5526FY ylor Segment Stock shortage limited sales in Taylor and forced revenue to retreat by -6.4% y/y, though traction ofthe product range through Trellidor’s existing network continued and grew 11% y/y.Taylor’s EBITDA and Operating Profit followed revenue with operating leverage and fell to R13.1m(H1:21 – R21.5m) and R8.4m (H1:21 – 17.4m) respectively.The stock shortages occurred as global supply chains remain chaotic and unreliable. Indeed, severalshipments were significantly delayed and remained in transit at period end. Management hasconfirmed that these shipments are landing in H2:22E.5 P a g e
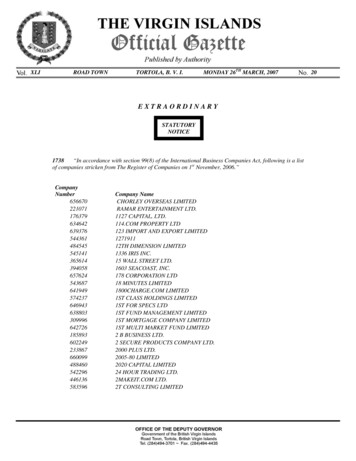
Trellidor Holdings Ltd – Results Note – Blue Gem Research – 11 April 2022 Management has tried to diversify suppliers, are mitigating shipment risks by ordering more and morefrequently, and are investing heavily in stock levels. All these take time and absorb working capital.Adding to the note about the steady growth of Taylor products through Trellidor sales channels,management has invested in an eCommerce platform for NMC that should be launched in H2:22E.Finally, the MD of the Taylor business unit, Anthony Mederer, has resigned (effective 1 March). As aresult of this, Trellidor Holdings will be purchasing his minority share in the business and we havefactored this in from mid-H2:22E. Management is currently seeking a suitable replacement.Figure 4: Snapshot of Some of Taylor/NMC’s Key Products, Sales Mix & TrendsPercentage of Sales (%)100%90%80%70%60%50%40%30%20%10%0%FY 16FY 17FY 18H1:19FY 19H1:20FY 20H1:21FY 3%32%32%34%35%38%30%33%33%PVC Shutters13%16%14%11%10%9%7%9%9%9%Aluminium Shutters39%35%43%45%43%44%41%46%43%43%Source: Taylor & NMC websites, various Trellidor documents & Blue Gem workings & assumptionsIn Table 3, we show our segmental forecast and, further, how it pushes down into a segmental-levelDiscounted Free Cash Flow (DCF) valuation. Other than discount rates and related assumptions (refer to the“Valuation” section for details on these), we have assumed the following in this segment: We’ve dropped our expected H2:22E revenue growth due to continuing supply challenges (despitethe stock in transit at the H1:22 period end) and see remaining margin pressure into late FY 23E,We have increased our expectation for inflation to 4.0% (previous: 3.2%), &We assume a buy-out of the minority in Taylor during H2:22 (halfway through the period) thatimpacts our consolidation of this segment into the Group and our Sum-of-the-Parts valuation.Table 3: Taylor Segmental Forecast & Discounted Free Cash Flow (DCF) Model(Rm)H1:22FY 22ERevenue198Revenue (%)-3.0%Gross Profit62Gross Profit Margin (%)31.5%Operating Profit9EBITDA1323Tax-1Working Capital-0Capex-8Free Cash Flow (FCF)13Discount Rate0.90Discounted FCF12Enterprise Value (EV)EV/EBITDA (x)Sources: Bloomberg, Blue Gem Research and Trellidor HoldingsFY 23E2032.4%6532.0%924-10-9140.8512FY 24E2134.8%7435.0%1731-3-8-9110.769FY 25E2234.8%7835.0%1833-3-2-9180.6812FY 26E2334.8%8235.0%1935-4-2-10190.6111FY 27E2444.8%8635.0%2637-5-2-10180.5510FY p SegmentTrellidor Holdings’ Group segment includes HoldCo and listing costs, the management of the treasury functionand it further receives management fee income. Consistent with our Initiation of Coverage, we have built a net6 P a g e
Trellidor Holdings Ltd – Results Note – Blue Gem Research – 11 April 2022present value (NPV) for this segment. While this segment can make a profit, our NPV is negative, implying asmall discount should be taken out of the Group’s sum-of-the-parts (SOTP) valuation.We have lifted our assumed inflation rate to 5.0% (previously: 4.0%) and allowed management fee income totrack Group income. We have pushed (most) finance costs through this segment before consolidating it intothe Group results.Finally, as we have done with other groups that own underlying properties, we have not valued theseseparately and consider the yield it generates (or would generate, if externally tenanted) as being captured inthe respective operating margins of each business and the broader Group (via rental savings).Macro EnvironmentGlobal Environment: COVID-19 receding but inflationary and geopolitical risks rising Unlike earlier variants, the Omicron-variant of COVID is more contagious but less deadly (Figure 5).Intuitively, viruses want to propagate and, thus, COVID mutating steadily into more “normal” seasonalwaves is logical and, with Omicron, appears to be happening.There remain risks, from China’s ‘Zero COVID’ policy negatively impacting global trade and commoditydemand to future COVID mutations turning out to be more deadly, but we believe that these risks(coupled with increasing vaccination rates) are receding.Figure 5: COVID-19’s Omicron – More Contagious, Less FatalSouth Africa – New casesWorld – New casesOmicron has more infectionthan other waves but lessdeaths than 2nd & 3rd waves.South Africa – DeathsWorldDeaths–Source: JHU CSSE COVID-19 Data Unfortunately, one of the consequences of COVID and rolling lockdowns has been a huge disruptionof global trade. This has created both shortages of key global products and commodities (fromsemiconductors to oil and coal) to spiralling freight rates and expanded delivery times.o These are the key challenges that hit the Taylor segment over H1:22 and, while managementhas adjusted their purchasing strategy to accommodate for this (ordering more and morefrequently), we do not see these disruptions easing in the short term.Coupling the global supply disruptions with the record amounts of fiscal and monetary stimulus hasseen large price increases (Figure 6) that, ultimately, are manifesting in rising inflationary pressuresaround the world.o This has been a key driver of the rise in raw materials costs in the Trellidor segment and,thus, is key in driving price increases.7 P a g e
Trellidor Holdings Ltd – Results Note – Blue Gem Research – 11 April 2022oAgainst this backdrop, a key risk is that consumer disposable incomes are negatively affectedand elasticities across different goods and services play out. On the upside here, though,many of Trellidor’s products relate to security and privacy, and, thus, should be less elasticthan many other more discretionary goods and services.Figure 6: USA & South African Inflation-Indexed to Brent Crude Oil Price5-year HistoryIndex Base 100 units600500400300200100USA Inflation (% y/y)SA Inflation (% y/y)Jan 2022Nov 2021Jul 2021Sep 2021May 2021Jan 2021Mar 2021Nov 2020Jul 2020Sep 2020May 2020Jan 2020Mar 2020Nov 2019Jul 2019Sep 2019May 2019Jan 2019Mar 2019Nov 2018Jul 2018Sep 2018May 2018Jan 2018Mar 2018Nov 2017Jul 2017Sep 2017May 2017Jan 2017Mar 2017Nov 2016Jul 2016Sep 2016May 2016Jan 2016Mar 2016-Oil Price (USD)History Since March 2020 (COVID-19)600Index Base 100 units500400Hugely inflationary forces can be pinpointed back to the (global)start of COVID-19: March 2020. Brent Crude is currently 4x timesits price since then, USA Inflation is 5x its pre-COVID rate &South Africa’s own rate of inflation is up by nearly a half (c.39%increase).300200100Mar Apr May Jun Jul Aug Sep Oct Nov Dec Jan Feb Mar Apr May Jun Jul Aug Sep Oct Nov Dec Jan Feb2020 2020 2020 2020 2020 2020 2020 2020 2020 2020 2021 2021 2021 2021 2021 2021 2021 2021 2021 2021 2021 2021 2022 2022USA Inflation (% y/y)SA Inflation (% y/y)Oil Price (USD)Source: Refinitiv & Blue Gem Research workings & assumptions; USA Nominal CPI (y/y), SA CPI (y/y) and Brent Crude Futures Spot Price in USD’s used. Most central banks (including the USA’s Federal Reserve) have either hiked or indicated that they aregoing to hike interest rates due to this inflationary pressure.Unfortunately, in this environment, Russia has launched an unprovoked invasion of Ukraine. Besidesthe risk of dragging Europe (and, perhaps, the world) into war, the direct and most immediate impacton the world has been the harsh sanctioning of Russian exports (Russa exports c.10% of the world oil,c.40% of Europe’s gas consumption and c.40% of the world’s palladium) and the collapse in Ukraine’skey wheat exports (c.25% of all wheat exports). All these added supply constraints have seen energy,hard and soft commodities rallying dramatically which should, logically, manifest in even higherinflation.Therefore, the key risks in this global environment are:o Geopolitical and the risk of the (currently regional) conflict spreading,o Rising inflationary impulses become embedded and sticky,o The significantly higher oil price dims global growth rates, &o How central banks (especially the US Fed) react to this toxic mix of elements.8 P a g e
Trellidor Holdings Ltd – Results Note – Blue Gem Research – 11 April 2022Domestic Environment: Post-COVID South Africa recovering & a net beneficiary of world events Amidst the complicated, risky global environment, South Africa appears to be recovering from its 4 thWave excellently:o Figure 7 shows the receding 4th Wave in South Africa, &o Google Mobility and Yoco Payments data points all show a strong rebound in domesticactivity and economic activity (Figure 7). While these data points are somewhat anecdotaland have their own biases, they are granular and real-time, and therefore also usual.Figure 7: South African Activity Data – Google Mobility & Yoco Small Business Recovery MonitorSouth Africa’s Total TurnoverIndex: 127% (i.e. 27% higher).Importantly, Gauteng is running 29% versus baseline.Sources: Google.com & Yoco.com Economically & politically, South Africa does appear to be improving, though some of this is fortuitousand could change depending on global events:o Eskom: While Eskom remains a major risk to South Africa and rolling blackouts sporadicallycontinue, the Government’s move to unbundle the utility, lift self-generation regulations to100MW & push to get further rounds of renewables online are all positives that lower thisrisk going forward.o Transnet: While Transnet remains an inefficient national operator creating large bottlenecksfor a commodity-led exporting country like South Africa, recent moves to privatize (or, atleast, let private operators onto the national railways) could unleash large pent-up exportdemand for South Africa’s bulk commodities.o Government debt & tax revenues: High commodity prices have created a windfall in largetax revenues that relieves some pressure on Government finances. Given the robust outlookfor commodities (&, indeed, the potential to unlock large volume growth in commodityexports from de-bottlenecking Transnet), South Africa’s budget deficit’s trajectory may beimproving.o Rand, interest rates & inflation: The combination of the above (especially commodityexports, most notably the platinum group metals that Russia is now blocked from exporting)9 P a g e
Trellidor Holdings Ltd – Results Note – Blue Gem Research – 11 April 2022 has seen a relatively strong Rand and modest inflation (as compared to the USA inflationtrajectory). While the South African Reserve Bank (SARB) has begun a hiking cycle, thecurrent trajectory does not appear overly onerous to the domestic economy.o Political Risk: Finally, the risk of political instability, growing poverty and the upcoming ANCNational Elective Conference (NEC) all add downside risks to these above-noted positives.We argue that the above is (currently) a net positive for South African economic activity but needs tobe viewed within the context of the major global risks noted earlier and, any global contagion, couldwell spread domestically too and more than offset the above-listed positives.Valuation and 12m TPValuation ModelsRefer to the Trellidor and Taylor Segments for more detailed assumptions that drive our segmental forecasts.We have selected a segmentally-drive Discounted Free Cash Flow (DCF) model and an implied relativeEnterprise Value-to-EBITDA (EV/EBITDA) model to help guide our view of Trellidor Holdings’ valuation.Given the expected labour settlement, we do not expect management to buy back any more shares in themarket in the near term. We have thus lowered our expectations here to zero change in issued shares,discarded the FY 22E dividend (FY 23E has a 5.0x cover before returning to normal from FY 24E) and focussedon deleveraging the Group’s balance sheet (including the guided for capital paid for Taylor’s minority).Discounted Free Cash Flow (DCF) ModelBesides the segmental-specific assumptions, we have made these universal assumptions in building our DCFmodels: Cost of Equity (CoE) of 17.8% (previously 17.1%) based on a “Rule of Thumb” beta of 1.5x and anEquity Risk Premium of 5.5% (unchanged),Cost of Debt (CoD) of 7.3% (or 5.2% after tax) based on management guidance of Prime less 0.5%,The Group’s current gearing is used to blend our CoE and CoD into a Weighted Average Cost of Capital(WACC) of 11.5% (previously 11.9%), &We have applied this WACC at a segmental level to build DCF valuations before adding them togetherin a Sum-of-the-Parts (SOTP) model and then rolling this forward at our CoE to arrive at target prices.Table 4: Sum-of-the-Parts (SOTP) of Segmental DCF Models – Trellidor HoldingsFair Value12m TPTrellidor SegmentR448,729,352R528,715,360Taylor SegmentR166,695,789R196,409,314Less: Taylor Segment Minorities Enterprise Value-R12,502,184*Less: Net Debt-R90,916,000-R95,816,000*Less: Group Segment-R65,777,494-R77,502,332Fair ValueR446,229,464R551,806,341Fair Value (cps)469cps580cpsEV/EBITDA (x)7.3x12.8xPrice Earnings (x)13.2x14.3xSources: Trellidor Holdings, Bloomberg, Blue Gem Research workings and assumptions; * Minorities acquired in H2:22E for R4.9m & this outflow added to debtOur DCF SOTP implies a fair value of 469cps (previously 548cps) for Trellidor shares, putting it on a PriceEarnings (PE) of 13.2x and EV/EBITDA of 7.3x. This implies that the current price of 285cps is 64% undervaluedand generates a c.103% 12m return on a 12m TP of 580cps (previously 656cps).Refer to the EV/EBITDA model below for our sense checking of this fair value against peers and impliedprofitability-driven multiples.10 P a g e
Trellidor Holdings Ltd – Results Note – Blue Gem Research – 11 April 2022Enterprise Value/EBITDA (EV/EBITDA) ModelUsing some key relatives on the JSE to represent the home improvement, building materials and constructionmaterials markets in South Africa—and then applying some conservative discounts against this basket—wehave generated a relative valuation for Trellidor (Table 5):Table 5: Enterprise Value-to-EBITDA (EV/EBITDA) Valuation ModelMarket Cap (R's)Net Debt (R's)Enterprise Value geLess: Discounts- Small Cap Discount (20%)- Illiquidity Discount (20%)Trellidor's Implied EV/EBITDA (x)Trellidor's 12m EBITDAHence, Trellidor's EV292,404,297Less: Net Debt90,916,000Therefore, Trellidor's Fair ValueR201,488,297Fair Value (cps)206cpsSources: Iress, Profile Media, various company reports, and Blue Gem Research workings & assumptions12m EBITDA 667,000EV/EBITDA 00As noted in our Initiation of Coverage & still our opinion, Trellidor’s materially higher profitability makes thiscomparison flawed. In Figure 8, we have built a statistical correlation between profitability and market rating.Then, taking this a step further, in Table 6, we have applied this formula to Trellidor to arrive at
A Series of Unfortunate Events Share Code: TRL - Market Cap: R267m - PE: 7.9x - DY: 3.9% 12m Target Price 580cps Share Price 285cps Implied Return 103% Industrials South Africa H1:22 Results: Riots, Strike, Shortages & Curveballs The riots in July & the metalworkers strike (c.12% lost