Transcription
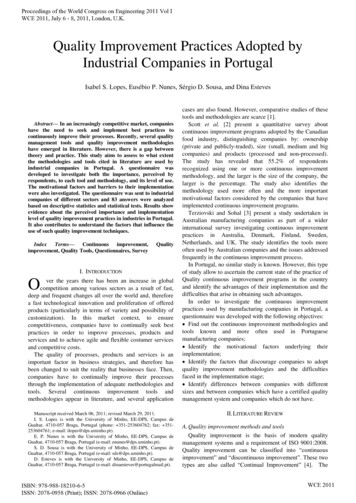
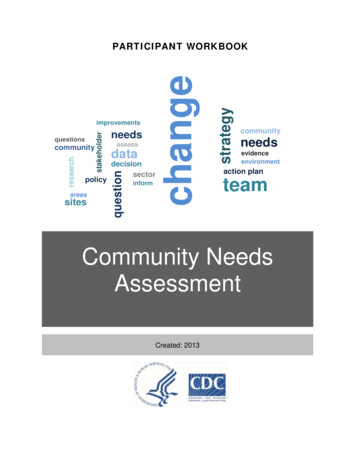
Responses to these questionshave been from the ContactIntervention Information TabEducation Service Center (ESC) Number:District Number:District Name:Campus Number:Campus Name:Region 4101912Houston ISD000000018Wheatley High SchoolNeeds Assessment Summary and Improvement PlanAfter your data analysis yields a summary of findings that results in a set of problem statements, the next step is to engage in the needs assessment process to identify root causes. The 5 steps of the root causes assessment include:Step 1: Clarify and prioritize problem statementsStep 2: Establish the purpose of assessing root causes and establish the teamDefinition / Step 3: Gather dataPurpose: Step 4: Review data analysisStep 5: Root cause analysisThe needs assessment process is intended to safeguard against planning or implementing strategies before the root cause of a problem is understood.Problem Statements(PS):Problem statementsare carried over fromSection VI of theCampus DataAnalysis tabORSection VI of theDistrict Data AnalysisSummary tab.PS 1:Significant gap in academic performance of Hispanic, special education and ELL student groupscompared to performance of "All Students".is occurring because of RootCause #1.Marginalization of advocacy for all Hispanic and ELL students and monitoring IEPs for special education students to ensurestudents are receiving consistent and appropriate accommodations.RootCause 1:PS 2:Index 4 "Meets Grade Level"measure was 29%.is occurring because of RootCause #2Failure to institute cohesive and timely systems and procedures that monitored and adjusted the instructional delivery,RootCause 2: interventions, and remediation.PS 3:is occurring because of RootCause #3Root Enter text Cause 3:PS 4:is occurring because of RootCause #4Root Enter text Cause 4:PS 5:is occurring because of RootCause #5Root Enter text Cause 5:PS 6:is occurring because of RootCause #6Root Enter text Cause 6:PS 7:is occurring because of RootCause #7Root Enter text Cause 7:PS 8:is occurring because of RootCause #8Root Enter text Cause 8:PS 9:is occurring because of RootCause #9Root Enter text Cause 9:PS 10:is occurring because of RootCause #10Root Enter text Cause 10:Identified and Prioritized Root Causes:It is important to prioritize your root causes so that your improvement plan is targeted and focused. Although a TEC §11 campus/district improvement plan is critical to overall success, the TEC §39 targeted improvement plan is intended to address the specific reasons forlow performance in the state accountability, PBM, or RF system.If the district or campus would like to identify more than 10 root causes, contact the support specialist assigned to the review.*** Important Notice! Improvement Required (IR) districts/campuses must complete the following attestation statement to fulfill TEC §39.106 requirements.***Attestation Statement:By checking the box, I attest that an on-site needs assessment has been conducted according to TEC §39.106 (b) and recommendations were made by the intervention team when considered appropriate. In addition, thesefindings have been recorded and are available upon request.
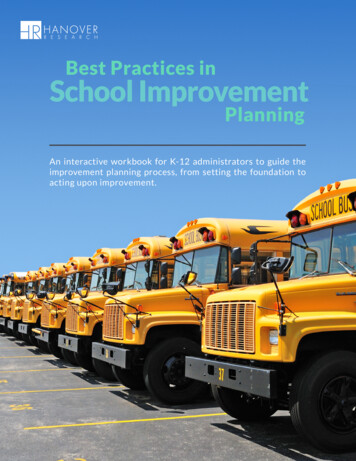
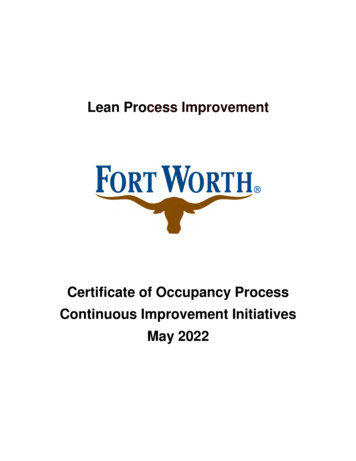
Responses to these questionshave been from the ContactIntervention Information TabEducation Service Center (ESC) Number:District Number:District Name:Campus Number:Campus Name:Region 4101912Houston ISD000000018Wheatley High SchoolNeeds Assessment Summary and Improvement PlanAfter your data analysis yields a summary of findings that results in a set of problem statements, the next step is to engage in the needs assessment process to identify root causes. The 5 steps of the root causes assessment include:Significant gap in academic performance of Hispanic, special education and ELL student groups compared toFor the 2017-2018 school year, Hispanic and English Language Learner (ELL) student groups will demonstrate a less thanProblem Statement 1:Annual Goal:performanceof "AllstatementsStudents".5% gap in student performance on STAAR Index 1: Student Achievement Calculation Report. (Achieve 180 Pillars I, II & III)Step 1: Clarify andprioritize problemStep 2: Establish the purpose of assessing root causes and establish the team.Marginalization of advocacy for all Hispanic and ELL students and monitoring IEPs for special education students toStep 3: Gather dataensure students are receiving consistent and appropriate accommodations.Professional development targeting Hispanic and ELL student groups with adjustments in instruction based on monitoringRoot4:CauseStrategy:StepReview1:data analysisimplementation and effectiveness of professional development.Step 5: Root cause analysisThe needsassessment process is intended to safeguard against planningor implementingstrategies before the root cause of aproblemis understood.IndexNumber:Index1: Student AchievementIndex2: StudentProgressNot ApplicableIndex 3: Closing Achievement GapsIndex 4: Postsecondary ReadinessCSF 1-Improve Academic Performance / ESEA TP: Strengthen the School's InstructionCSF 2-Quality Data to Drive Instruction/ESEA TP: Use of Data to Inform InstructionCritical Success Factors (CSFs)ESEA Turnaround Principles (TPs)Major SystemsCSF 3-Leadership Effectiveness/ESEA TP: Provide Strong LeadershipCSF 4-Increased Learning Time/ESEA TP: Redesigned School CalendarCSF 5-Family/Community Engagement/ESEA TP: Ongoing Family and Community EngagementConsistent monitoring of academic performance for the Hispanic and ELL student groups will allow for strategicHow will addressing this root cause interventions and training for teachers. Student enrollment is over 50% Hispanic; therefore, increasing studentperformance and decreasing the achievement gap for these student groups will have a positive impact on 2018impact the index/indicator/CSF?Accountability.CSF 6-School Climate/ESEA TP: Improve School EnvironmentCSF 7-Teacher Quality/ESEA TP: Ensure Effective TeachersInterventions by QuarterQ1 (Aug, Sept, Oct)Q2 (Nov, Dec, Jan)Districts and 1st Year IR campuses are required to provide,at a minimum, the interventions accomplished for quarter 1 (Q1).100% of teaching staff will implement a targetedCurriculum Integration for ELL learners thatQ1 Goal: connects ELP’s, TEKs and SIOP strategiesacross core curriculum. (Achieve 180 Pillars II &III)100% of teaching and instruction will be data driven basedon student performance analysis of multiple sources.(Achieve 180 Pillars II & III)Q2 Goal:Q1 Interventions4. Campus content specialists and district TDSswill collaboratively facilitate development of CBA’s,4) lesson plans, data analysis, coach anddevelopment of teachers.4)2)3)1)Collaborative data analysis and planning among the SpecialEducation Case Managers, ESL/ELL/ESOL instructionalteams and Content Specialist to deploy Tier 2 remediation.Deploy content based integrated learning stylestrategies (visual, auditory, kinesthetic approach to3) vocabulary) specific to ELL acquisition andapplication.Data analysis of 2017-2018 EOCperformance to inform planning for3) summer remediation and 2018-2019instructional approach.Students will collaborate with teachers to establishremediation routine for strategically targeted TEKs.4)Collaborative lesson plans1)1)List of interventions and schedule for each group of re2) testers.Scheduled writing sample analysis and data informed2) remediation plansTier 2 remediation schedule; observation data from content3) specialists with teacher and administrative feedback.3)Teacher lesson plans will reflect small group instruction4) based on input from students on TEKS identified foradditional instruction.4) Common lesson plans and CBA analysis charts4)Evaluation of all programs, systems andprocedures that will contributed to4) continued growth and academic successas aligned by Campus, District and TEAgoals measures.CBA, Middle of the Year Universal Screener andDistrict Assessments disaggregated data to implementrecursive teaching and tutorial sessions specifically forall student groups.What data will be collected to monitor interventions in Q3?Intervention scheduleList of coaching sessionsPD by Content Specialist and TDS duringPLC on content specific test takingstrategies for end of course, SAT, ACT,1)Advanced Placement and TSI .Push-in Co-Teach through ELA-R with bi-lingualteacher, consultant and Content Specialist.Continue deployment of data driven,collaborative instructional processthrough multiple in-class instructionalsupports using small group instructionthat addresses direct instruction,2)recursive and remediated instruction thatincludes Special Educationaccommodations in a mainstreaminstructional environment.What data will be collected to monitor interventions in Q2?tracking chart for monitoring performance of allstudent with a focus on student groupsQ4 InterventionsCampus wide Write Across the Curriculum-integrateacademic language and practice weekly to supportprompt response construction; TEK specific2)vocabulary building and reinforcement for EOCdecoding during Write Across the Curriculum practice.Push-In/Pull-Out targeted remediation support for re-testers2) to review tested TEKs.3)Utilization of quantitative and qualitativedata to inform assessment preparations,program and system evaluations andplanning for the following academic year.(Achieve 180 Pillars I & III)Q4 Goal:Q3 InterventionsModified interventions based on data analysis andqualitative reports and remediation deployment through1) District instruments for student groups.3. Instructional Specialist working with teachers toinsure student groups (Hispanic/Latino ELL and3) SPED) scope and measure of strategies inalignment to TEKs and ELPs in preparation forstandardized demonstration.Q4 (April, May, June)100% of teachers will implement researched basedinstructional strategies designed to increase academicsuccess of Hispanic and English Learners. (Achieve180 Pillars II & III)Q3 Goal:Q2 Interventions1. Professional Development: QTEL training on instructional strategies forEnglish Language Learners; Weekly Achieve 180 training for SIOP strategiesfor ELL instruction;1) Campus content specialists in cooperation withTeacher Development Specialist provide minitraining sessions twice monthly duringprofessional learning community meetings to buildcapacity in TEK alignment, incorporation of2. Assessments: CBAs 1 and 2 data will be analyzed fordemonstration of mastery by strategic TEKs asaligned to intervention plan for re-spiraling andrecursive instruction;2) Weekly “Data Days” for students to work withteachers to analyze assessment data fromformative, summative and structured CFU indetermination of remediation and tutorial supportneeds working toward content mastery.What data will be collected to monitor interventions in Q1?80% of classroom observations and lesson planswill show implementation of differentiation and1)scaffolding practices in alignment with campusELPsstudentList of focusTEKSforfortargetedre-spiralinginto groupsinstruction;Q3 (Feb, Mar)What data was collected to monitor interventions in Q4?Lesson plans with integrated test takingstrategies and skills practices1)Lesson plans with the three-prong2) instructional approachLesson plans and classroom observation dataAnalysis of 2018 EOC performance databy Campus Leadership Team to identify3) strengths and areas of opportunity forimprovementDisaggregated data charts and tutorial sessionschedules4)Campus Leadership Teams will evaluatesystems and procedures that contributedto growth and new implementationsneeded to promote sustainabilityEnd of Quarter ReportingQ1 ReportDistricts and 1st Year IR campuses are not required to complete thequarter 1 (Q1) report.Did you meet thisquarter's goal?Provide the data orevidence that supportsmeeting or makingprogress toward thisquarterly goal.Select Enter text Q2 ReportDid you meet thisquarter's goal?Provide the data orevidence that supportsmeeting or makingprogress toward thisquarterly goal.Q3 ReportDid you meet thisquarter's goal?SelectDid you meet thisquarter's goal?SelectProvide the data orevidence that supportsmeeting or makingprogress toward thisquarterly goal. Enter text Q4 ReportProvide the data orevidence that supportsmeeting or makingprogress toward thisquarterly goal. Enter text Select Enter text Are you on track to meet Selectthe annual goal?Are you on track tomeet the annual goal?SelectAre you on track tomeet the annual goal?SelectDid you meet yourannual goal?What, if any, adjustmentsmust be made in order to Enter any additional information here meet the annual goal?What, if any,adjustments must bemade in order to meetthe annual goal? Enter any additional information here What, if any,adjustments must bemade in order to meetthe annual goal? Enter any additional information here Enter any additional information here End of Year ReportingData Analysis ProcessProvide the data thatsupports your 4thquarter status of thisannual goal.If you did meet your annual goal, towhat do you attribute your success? Enter text If you did not meet your annualgoal, to what do you attribute yourlack of success?(Specific) InterventionsData QualityAnnual GoalsAppropriate StrategyCSF/ESEA TurnaroundIdentification of Root CauseTrainingPlease provideadditional informationfor the selection ofOther or for anyselected elements. Enter text Select
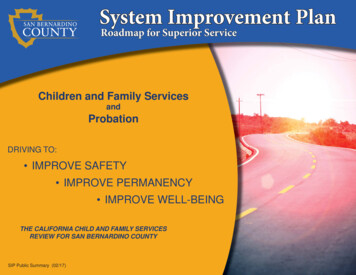
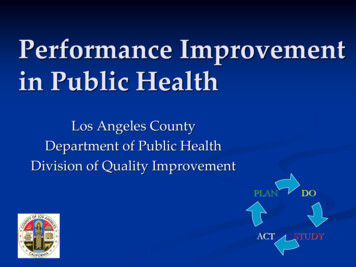
Responses to these questionshave been from the ContactInterventionProvidetheInformationdata that Tabsupports your 4thquarter status of thisannual goal.District Number:Education Service Center (ESC) Number:District Name:If you did meet your annual goal, to101912success?what do you attribute yourCampus Number:Campus Name:Please provideWheatley High Schooladditional information Enter text for the selection of Enter text If you did not meet your annualOther or for anygoal, to what do you attribute yourselectedelements.After your data analysis yields a summary of findingslackthatofresultsin a set of problem statements, the next step is to engage in the needs assessment process to identify root causes. The 5 steps of theroot causesassessment include:success?Quarterly Planning ProcessOtherRegion 4Houston ISD000000018Needs Assessment Summary and Improvement PlanStep 1: Clarify and prioritize problem statementsOngoing Monitoring and InterventionsStep 2: Establish the purpose of assessing root causes and establish the teamStep 3: Gather dataStep 4: Review data analysisProvide information as to howidentifiedStepthe5: Rootcauseelementsanalysis and their impacton your success, or lack of success, will inform/influence your planning Enter text for the 2017-2018 school year.The needs assessment process is intended to safeguard against planning or implementing strategies before the root cause of a problem is understood.Problem Statement 2: Index 4 "Meets Grade Level"measure was 29%.Root Cause 2:Failure to institute cohesive and timely systems and procedures that monitored and adjusted the instructional delivery,interventions, and remediation.Index Number:Index 1: Student AchievementNot ApplicableAnnual Goal:For the 2017-2018 school year 80% of students will achieve “STAAR Meets Grade Level” standard in Index 4 (Achieve 180Pillar IV)Strategy:Training for staff on components of Index 4 and consistent monitoring of tudent performance through the Index 4 "lense" willallow for instructional and intervention adjustments.Index 2: Student ProgressIndex 3: Closing Achievement GapsIndex 4: Postsecondary ReadinessCSF 1-Improve Academic Performance / ESEA TP: Strengthen the School's InstructionCSF 2-Quality Data to Drive Instruction/ESEA TP: Use of Data to Inform InstructionCritical Success Factors (CSFs)ESEA Turnaround Principles (TPs)Major SystemsCSF 3-Leadership Effectiveness/ESEA TP: Provide Strong LeadershipHow will addressing this root cause Increasing the number of students that achieves "Meets Grade Level" standard will impact all of theaccountability indices. In 2018 the school's Domain I will be positively impacted by increasing this indicator.impact the index/indicator/CSF?CSF 4-Increased Learning Time/ESEA TP: Redesigned School CalendarCSF 5-Family/Community Engagement/ESEA TP: Ongoing Family and Community EngagementCSF 6-School Climate/ESEA TP: Improve School EnvironmentCSF 7-Teacher Quality/ESEA TP: Ensure Effective TeachersInterventions by QuarterQ1 (Aug, Sept, Oct)Q2 (Nov, Dec, Jan)Districts and 1st Year IR campuses are required to provide,at a minimum, the interventions accomplished for quarter 1 (Q1).50% of students will be performing at “MeetsQ1 Goal: Grade Level” in tested content areas. (Achieve180 Pillars II & III)60% of students will be performing at “Meets Grade Level”in tested content areas. (Achieve 180 Pillars II & III)Q2 Goal:Q1 Interventions1)Special Education audit to verify validaccommodations for learning differences are2) deployed through online assessmentadministration.Schedule and list of needs2)3)4)Analyze weekly academic performance data to monitor andadjust intervention and small group instruction for re-testers.2)Lesson Plans3)3)4)1)Continue deployment of data driven,collaborative instructional processesthrough multiple in-class instructionalsupports using small group model that2) addresses direct, recursive andremediated instruction that includesSpecial Education accommodations in amainstream instructional environment.Data analysis of 2017-2018 EOCperformance to inform planning for3) summer remediation and 2018-2019instructional approach.Implementation of ELPs focused instruction ofassessed TEKs for EOC administration.Evaluation of all programs, systems andprocedures that will contributed to4) continued growth and academic successas aligned by Campus, District and TEAgoals measures.Lesson plans and data analysis1)Tier 2 and Tier 3 Intervention plans.2)Classroom Observations/Teacher feedback/Coaching3)Implementation of Math and Scienceintervention plans with on-goingmonitoring and adjustments based ondata analysis.Targeted TEKs Tier 2 and Tier 3 pull-out interventionsbased on disaggregated released EOC Diagnosticsdata.What data will be collected to monitor interventions in Q3?What data was collected to monitor interventions in Q4?Lesson plans and integrated interventionplan1)Student sign-in sheets2)Lesson plans with the three-pronginstructional approachAnalysis of 2018 EOC performance databy Campus Leadership Team to identify3) strengths and areas of opportunity forimprovementData tracking performance; sign-inEvaluate the disaggregated performance data of4) Hispanic and ELLs in alignment to targeted ELPsinstruction4) Leveled questions in lesson plans4) List of student conferencesQ4 InterventionsExtended-day after-school ELA I/ELA II tutorials2) (March); Math and Science. (February)D.E.A.R (Drop Everything and Read) across the curriculumwill with content based materials to increase literacy, lexiconawareness to build reading fluency and proficiency.(January)What data will be collected to monitor interventions in Q2?Data analysis summaries; lesson plans with small groupinstruction1)Audit and recommendations80% of students will be performing at“Meets Grade Level” in tested contentareas. (Achieve 180 Pillars II & III)Q4 Goal:Q3 InterventionsMonitor classroom instruction to ensure implementation ofcommon lesson plans and implementation of strategies that3) are research-based for success with Hispanic and EnglishLearners.Student/Teacher/Administration conferencing and4) counseling.Q4 (April, May, June)Released EOC District Diagnostic Assessments data disaggregation to identify TEKs for spiraling,1) small group intervention and digital resources support.Develop Tier 2 and Tier 3 intervention plans for tested2) content areas.English Language Learner supported acrosscurriculum through integrated ELPs, SIOP and3) research based language acquisition strategies bycontent requirements.1)75% of students will be performing at “Meets GradeLevel” in tested content areas. (Achieve 180 Pillars II& III)Q3 Goal:Q2 Interventions1. Create a schedule and identify staffing needs toimplement targeted grouping and pull-outinstruction for small group TDS/Content Specialist1) remediation in preparation of re-testers.What data will be collected to monitor interventions in Q1?Q3 (Feb, Mar)4)Campus Leadership Teams will evaluatesystems and procedures that contributedto growth and new implementationsneeded to promote sustainabilityEnd of Quarter ReportingQ1 ReportDistricts and 1st Year IR campuses are not required to complete thequarter 1 (Q1) report.Did you meet thisquarter's goal?Provide the data orevidence that supportsmeeting or makingprogress toward thisquarterly goal.Select Enter text Q2 ReportDid you meet thisquarter's goal?Provide the data orevidence that supportsmeeting or makingprogress toward thisquarterly goal.Select Enter text Q3 ReportDid you meet thisquarter's goal?Provide the data orevidence that supportsmeeting or makingprogress toward thisquarterly goal.Select Enter text Q4 ReportDid you meet thisquarter's goal?Provide the data orevidence that supportsmeeting or makingprogress toward thisquarterly goal.Select Enter text Are you on track to meet Selectthe annual goal?Are you on track tomeet the annual goal?SelectAre you on track tomeet the annual goal?SelectDid you meet yourannual goal?What, if any, adjustmentsmust be made in order to Enter any additional information here meet the annual goal?What, if any,adjustments must bemade in order to meetthe annual goal? Enter any additional information here What, if any,adjustments must bemade in order to meetthe annual goal? Enter any additional information here Enter any additional information here Select
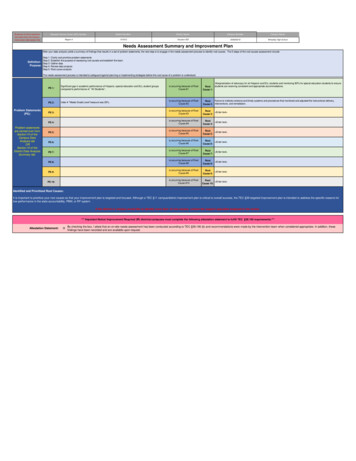
Responses to these questionshave been from the ContactIntervention Information TabEducation Service Center (ESC) Number:District Number:District Name:Campus Number:Campus Name:Region 4101912Houston ISD000000018Wheatley High SchoolNeeds Assessment Summary and Improvement PlanAfter your data analysis yields a summary of findings that results in a set of problem statements, the next step is to engage in the needs assessment process to identify root causes. The 5 steps of the root causes assessment include:End of Year ReportingStep 1: Clarify and prioritize problem statementsStep 2: Establish the purpose of assessing root causes and establish the teamStep 3: Gather dataIf you did meet your annual goal, toStep 4: Review data analysiswhat do you attribute your success?Step 5: Root cause analysisProvide the data thatsupports your 4thquarter status of thisannual goal.Data Analysis Process(Specific) InterventionsData QualityAnnual GoalsAppropriate Strategy Enter text If youdid notmeet yourannualThe needs assessment process is intended to safeguardagainstplanningor implementingstrategies before the Identificationroot cause ofofa problemis understood.Root Causegoal, to what do you attribute yourlack of success?Quarterly Planning ProcessCSF/ESEA TurnaroundTrainingPlease provideadditional informationfor the selection ofOther or for anyselected elements. Enter text OtherOngoing Monitoring and InterventionsProvide information as to how the identified elements and their impacton your success, or lack of success, will inform/influence your planning Enter text for the 2016-2017 school year.Problem Statement 3:Annual Goal: Enter text Strategy: Enter text Root Cause 3: Enter text Index Number:Index 1: Student AchievementNot ApplicableIndex 2: Student ProgressIndex 3: Closing Achievement GapsIndex 4: Postsecondary ReadinessCSF 1-Improve Academic Performance / ESEA TP: Strengthen the School's InstructionCSF 2-Quality Data to Drive Instruction/ESEA TP: Use of Data to Inform InstructionCritical Success Factors (CSFs)ESEA Turnaround Principles (TPs)Major SystemsCSF 3-Leadership Effectiveness/ESEA TP: Provide Strong LeadershipHow will addressing this root causeimpact the index/indicator/CSF?CSF 4-Increased Learning Time/ESEA TP: Redesigned School Calendar Enter text CSF 5-Family/Community Engagement/ESEA TP: Ongoing Family and Community EngagementCSF 6-School Climate/ESEA TP: Improve School EnvironmentCSF 7-Teacher Quality/ESEA TP: Ensure Effective TeachersInterventions by QuarterQ1 (Aug, Sept, Oct)Q2 (Nov, Dec, Jan)Districts and 1st Year IR campuses are required to provide,at a minimum, the interventions accomplished for quarter 1 (Q1).Q3 (Feb, Mar)Q2 Goal:Q1 Goal:Q4 (April, May, June)Q3 Goal:Q1 InterventionsQ4 Goal:Q2 InterventionsQ3 InterventionsQ4 Interventions1)1)1)1)2)2)2)2)3)3)3)3)4)4)What data will be collected to monitor interventions in Q1?4)What data will be collected to monitor interventions in Q2?4)What data will be collected to monitor interventions in Q3?What data was collected to monitor interventions in Q4?1)1)1)1)2)2)2)2)3)3)3)3)4)4)4)4)End of Quarter ReportingQ1 ReportDistricts and 1st Year IR campuses are not required to complete thequarter 1 (Q1) report.Did you meet thisquarter's goal?Provide the data orevidence that supportsmeeting or makingprogress toward thisquarterly goal.Select Enter text Q2 ReportDid you meet thisquarter's goal?Provide the data orevidence that supportsmeeting or makingprogress toward thisquarterly goal.Q3 ReportDid you meet thisquarter's goal?SelectDid you meet thisquarter's goal?SelectProvide the data orevidence that supportsmeeting or makingprogress toward thisquarterly goal. Enter text Q4 ReportProvide the data orevidence that supportsmeeting or makingprogress toward thisquarterly goal. Enter text Select Enter text Are you on track to meetSelectthe annual goal?Are you on track tomeet the annual goal?SelectAre you on track tomeet the annual goal?SelectDid you meet yourannual goal?What, if any, adjustmentsmust be made in order to Enter any additional information here meet the annual goal?What, if any,adjustments must bemade in order to meetthe annual goal? Enter any additional information here What, if any,adjustments must bemade in order to meetthe annual goal? Enter any additional information here Enter any additional information here End of Year ReportingProvide the data thatsupports your 4thquarter status of thisannual goal.If you did meet your annual goal, towhat do you attribute your success? Enter text If you did not meet your annualgoal, to what do you attribute yourlack of success?Data Analysis Process(Specific) InterventionsData QualityAnnual GoalsAppropriate StrategyCSF/ESEA TurnaroundIdentification of Root CauseTrainingQuarterly Planning ProcessOtherOngoing Monitoring and InterventionsPlease provideadditional informationfor the selection ofOther or for anyselected elements. Enter text Select
Responses to these questionshave been from the ContactIntervention Information TabEducation Service Center (ESC) Number:District Number:District Name:Campus Number:Campus Name:Region 4101912Houston ISD000000018Wheatley High SchoolNeeds Assessment Summary and Improvement PlanAfter your data analysis yields a summary of findings that results in a set of problem statements, the next step is to engage in the needs assessment process to identify root causes. The 5 steps of the root causes assessment include:Provide information as to howidentifiedelementsproblemand theirimpactStepthe1: Clarifyand prioritizestatements Enteron your success, or lack ofStepsuccess,will inform/influenceyour planning2: Establishthe purpose of assessingroot causesandtext establish the teamfor the 2016-2017 school year.Step 3: Gather dataStep 4: Review data analysisStep 5: Root cause analysisProblemStatement4:Annual Goal:Theneeds assessmentprocess is intended to safeguard against planning or implementing strategies before the root cause of a problem is understood.Root Cause 4: Enter text Index Number: Enter text Strategy:Index 1: Student AchievementNot Applicable Enter text Index 2: Student ProgressIndex 3: Closing Achievement GapsIndex 4: Postsecondary ReadinessCSF 1-Improve Academic Performance / ESEA TP: Strengthen the School's InstructionCSF 2-Quality Data to Drive Instruction/ESEA TP: Use of Data to Inform InstructionCritical Success Factors (CSFs)ESEA Turnaround Principles (TPs)Major SystemsCSF 3-Leadership Effectiveness/ESEA TP: Provide Strong LeadershipHow will addressing this root causeimpact the index/indicator/CSF?CSF 4-Increased Learning Time/ESEA TP: Redesigned School Calendar Enter text CSF 5-Family/Community Engagement/ESEA TP: Ongoing Family and Community EngagementCSF 6-School Climate/ESEA TP: Improve School EnvironmentCSF 7-Teacher Quality/ESEA TP: Ensure Effective TeachersInterventions by QuarterQ1 (Aug, Sept, Oct)Q2 (Nov, Dec, Jan)Districts and 1st Year IR campuses are required to provide,at a minimum, the interventions accomplished for quarter 1 (Q1).Q3 (Feb, Mar)Q2 Goal:Q1 Goal:Q4 (April, May, June)Q3 Goal:Q1 InterventionsQ4 Goal:Q2 InterventionsQ3 InterventionsQ4 Interventions1)1)1)1)2)2)2)2)3)3)3)3)4)4)4)4)What data will be collected to monitor interventions in Q1?What data will be collected to monitor interventions in Q2?What data will be collected to monitor interventions in Q3?What data was collected to monitor interventions in Q4?1)1)1)1)2)2)2)2)3)3)3)3)4)4)4)4)End of Quarter ReportingQ1 ReportDistricts and 1st Year IR campuses are not required to complete thequarter 1 (Q1) report.Did you meet thisquarter's goal?SelectProvide the data orevidence that supportsmeeting or makingprogress toward thisquarterly goal. Enter text Q2 ReportDid you meet thisquarter's goal?Provide the data orevidence that supportsmeeting or makingprogress toward thisquarterly goal.Q3 ReportDid you meet thisquarter's goal?SelectDid you meet thisquarter's goal?SelectProvide the data orevidence that supportsmeeting or makingprogress toward thisquarterly goal. Enter text Q4 ReportProvide the data orevidence that supportsmeeting or makingprogress toward thisquarterly goal. Enter text Select Enter text Are you on track to meet Selectthe annual goal?Are you on track tomeet the annual goal?SelectAre you on track tomeet the annual goal?SelectDid you meet yourannual goal?What, if any, adjustmentsmust be made in order to Enter any additional information here meet the annu
Needs Assessment Summary and Improvement Plan After your data analysis yields a summary of findings that results in a set of problem statements, the next step is to engage in the needs assessment process to identify root causes. The 5 steps of the root causes assessment include: Step 1: Clarify and prioritize problem statements