Transcription
Estimation of measurement uncertainty inchemical analysis (analytical chemistry)courseThis is an introductory course on measurement uncertainty estimation, specifically related tochemical analysis.Ivo Leito, Lauri Jalukse, Irja Helmhttps://sisu.ut.ee/measurement1
Table of contentsCourse introduction1. The concept of measurement uncertainty (MU)2. The origin of measurement uncertainty3. The basic concepts and tools3.1. The Normal distribution3.2. Mean, standard deviation and standard uncertainty3.3. A and B type uncertainty estimates3.4. Standard deviation of the mean3.5. Rectangular and triangular distribution3.6. The Student distribution4. The first uncertainty quantification4.1. Quantifying uncertainty components4.2. Calculating the combined standard uncertainty4.3. Looking at the obtained uncertaintySelf test 4.34.4. Expanded uncertainty4.5. Presenting measurement results4.6. Practical example5. Principles of measurement uncertainty estimation5.1. Measurand definition5.2. Measurement procedure5.3. Sources of measurement uncertainty5.4. Treatment of random and systematic effects6. Random and systematic effects revisited7. Precision, trueness, accuracy8. Overview of measurement uncertainty estimation approaches9. The ISO GUM Modeling approach9.1. Step 1– Measurand definition9.2. Step 2 – Model equationSelf test 9.2 ASelf test 9.2 Bhttps://sisu.ut.ee/measurement2
9.3. Step 3 – Uncertainty sources9.4. Step 4 – Values of the input quantities9.5. Step 5 – Standard uncertainties of the input quantities9.6. Step 6 – Value of the output quantity9.7. Step 7 – Combined standard uncertainty9.8. Step 8 – Expanded uncertainty9.9. Step 9 – Looking at the obtained uncertaintySelf test 9 B10. The single lab validation approach10.1. Principles10.2. Uncertainty component accounting for random effects10.3. Uncertainty component accounting for systematic effects10.4. Roadmap10.5. Determination of acrylamide in snacks by LC MSSelf test 10.5 A11. Comparison of the approaches12. Comparing measurement results13. Additional materials and case studies13.1. Different analytical techniques13.2. Dissolved oxygen by Winkler method13.3. Coulometric KF titration14. Tests and ExercisesFrequently asked questionsWhat our participants say?Please comment!https://sisu.ut.ee/measurement3
Course introductionThis course will be offered again as a MOOC in spring 2016. The course willtake place during March 28 – May 8, 2016. Registration is open.If you want to know how the course went in spring 2014 and 2015 please see the presentation atthe Euroanalysis 2015 conference.Course introductionhttp://www.uttv.ee/naita?id 17710https://www.youtube.com/watch?v r34Y gzf62YThe course was offered as an online course (MOOC) in Moodle environment during March 03 April 13, 2014 and March 02 April 12, 2015. Altogether more than 700 participants from morethan 70 countries have participated. Altogether more than 40% of them successfully completedthe course and were awarded a certificate from University of Tartu.The course will be offered again in March 28 May 08, 2016.This course has been described in the paper: I. Leito, I. Helm, L. Jalukse. Using MOOCs forteaching analytical chemistry: experience at University of Tartu. Anal. Bioanal. Chem. 2015,DOI: 10.1007/s00216 014 8399 y.You can have a preview of the MOOC in Moodle environment as a guest. Guest access allows youto view the course contents and read the discussions in forums, posted during the Spring 2014edition of the MOOC. As a guest you cannot post to forums and take quizzes.Short description of the courseThis is an introductory course on estimation of measurement uncertainty, specifically related tochemical analysis (analytical chemistry). The course gives the main concepts and mathematicalapparatus of measurement uncertainty estimation and introduces two principal approaches tomeasurement uncertainty estimation – the ISO GUM modeling approach (the “bottom up” ormodeling approach) and the single lab validation approach as implemented by Nordtest (the“top down” or Nordtest approach). The course contains lectures, practical exercises andnumerous tests for self testing.In spite of being introductory, the course intends to offer sufficient knowledge and skills forcarrying out uncertainty estimation for most of the common chemical analyses in routinelaboratory environment. The techniques for which there are examples or exercises include acid base titration, Kjeldahl nitrogen determination, UV Vis spectrophotometry, atomic absorptionspectroscopy and liquid chromatography mass spectrometry (LC MS). It is important to stress,however, that for successful measurement uncertainty estimation experience (both in analyticalchemistry as such and also in uncertainty estimation) is crucial and this can be acquired onlythrough practice.The materials of this course can also be useful for people who do not intend to follow the fullcourse but only want to find answers to some specific questions.Required preliminary knowledgeIntroductory level knowledge of analytical chemistry is required. More advanced knowledge ofanalytical chemistry and introductory knowledge of mathematical statistics is anadvantage. Fluency with and access to a spreadsheet software package (MS Excel, OpeOffice,etc) is highly recommended.https://sisu.ut.ee/measurement4
Why is measurement uncertainty importanthttp://www.uttv.ee/naita?id 17711https://www.youtube.com/watch?v tn2DLYA72DkStudy outcomesThe student who has successfully passed the course knows:the main concepts related to measurement results and measurement uncertainty, includingtheir application to chemical analysis;the main mathematical concepts and tools in uncertainty estimation;the main measurement uncertainty sources in chemical analysis;the main approaches for measurement uncertainty estimation.The student who has successfully passed the course is able to:decide what data are needed for uncertainty estimation, understand the meaning of theavailable data and decide whether the available data are sufficient;select the uncertainty estimation approach suitable for the available data;quantify the uncertainty contributions of the relevant uncertainty sources using theavailable data;carry out estimation of uncertainty using the main approaches of uncertainty estimation.Organization of the course materialThe course (overall volume 1 ECTS) is organized in 12 sections, of which some are in turn splitinto smaller subsections. The following parts are found in the sections:1. The sections (and also many subsection) start with a brief introduction stating the maintopic(s) and study outcomes of the section.2. The main topic of the respective section is explained in a short video lecture.3. The lecture is followed by a textual part. This text is in most cases meant to complement,not substitute the lecture (although in some cases the contents of the lecture are alsorepeated in some extent). It rather gives additional explanations and addresses someadditional topics that were not covered by the lecture.4. Most sections end with a self test, which enables to test the acquired knowledge and skills.The tests contain questions, as well as calculation problems. The self tests are on one handmeant for the students to monitor his/her progress. On the other hand, however, they alsopromote thinking and provide (by the feedback of the questions) additional knowledgeabout measurement uncertainty estimation in different practical situations. So, the self tests are an intrinsic component of the course and it is strongly recommended to take allof them.The printout of the current version of the course materials (including lecture slides) can bedownloaded from here. The text surrounded with grey dashed line is footnote text and appears alsoat the end of the page.If you consistently get a message "Server not found" when attempting to watch videos then withhigh probability the reason is the firewall of your local network. The local network administratorsshould enable outcoming connections from your network via port 1935. More specifically it isnecessary to access the server rtmp://flash.ut.ee:1935.An additional possibility is to watch the videos in YouTube via channel "ESTIMATION OFMEASUREMENT UNCERTAINTY IN CHEMICAL ANALYSIS".Direct link: https://www.youtube.com/channel/UCeNhxB WuTDNcbNHFxsBjUwSelf testingThroughout the course there are numerous self tests for enabling the student to test his/herknowledge and skills in specific topics. Each test is graded as a percentage (100% correspondingto correctly answering all questions and correctly solving all problems).https://sisu.ut.ee/measurement5
Feedback is given as:Correct answer, correctly recognised and marked by the student.Correct answer, not recognised and not marked by the student.Incorrect answer, however, considered correct by the student.Explanatory feedback is displayed when wrong answer is selected. All tests can be taken asmany times as needed and the success of taking these tests will not influence the final grade.We recommend that you take all the tests and work with them until you achieve score 100% andonly then move to next topic.Terminology and definitionsWherever possible, the used terminology adheres to the 3rd edition of the Internationalvocabulary of metrology — Basic and general concepts and associated terms (VIM), JCGM200:2008, International vocabulary of metrology — Basic and general concepts and associatedterms (VIM), 3rd edition. BIPM, IEC, IFCC, ILAC, ISO, IUPAC, IUPAP and OIML, 2008. Available fordownloading free of charge at l. referredto as “VIM” throughout the course. However, in the interest of better understanding and in orderto stress the most important aspects of concepts, in many cases concepts are introduced bydefinitions that are somewhat simplified compared to the VIM. More deeply interested studentsare encouraged to consult the VIM.Main literature sourcesThis list of literature references is selecive, not exhauxtive. The references were selected basedon the following criteria: (1) Widely used and cited; (2) useful under practical lab conditions (i.e.not too deeply scientific); (3) a fairly recent version is available and (4) the document ispreferably available free of charge on the Internet. These references are referred to in thecourse via superscript numbers in round brackets, e.g.: VIM(1).(1) JCGM 200:2008, International vocabulary of metrology — Basic and general concepts andassociated terms (VIM), 3rd edition. BIPM, IEC, IFCC, ILAC, ISO, IUPAC, IUPAP and OIML, 2008.Available on line from l(2) JCGM 100:2008 Evaluation of measurement data — Guide to the expression of uncertainty inmeasurement.JCGM,2008.Availableon /gum.html(3) Quantifying Uncertainty in Analytical Measurement, 2nd ed.; Ellison, S. L. R.; Williams, A.,Eds.;EURACHEM/CITAC,2012.Availableon /guides(4) Measurement Uncertainty Revisited. Eurolab Technical Report No 1/2007. Eurolab, 2007.Available on line from http://www.eurolab.org/documents/1 2007.pdf(5) Handbook for Calculation of Measurement Uncertainty in Environmental Laboratories. B.Magnusson, T. Näykki, H. Hovind, M. Krysell. Nordtest technical report 537, ed. 3. Nordtest,2011.Availableon al reports/item/handbook for calculation of measurement uncertainty in environmental laboratories nt tr 537 edition 3.html(6) Analytical Measurement: Measurement Uncertainty and Statistics. Eds: N. Majcen, V.Gegevicius.EC JRCIRMM,2012.Availableon itory/bitstream/111111111/29537/1/lana2207enn web.pdfCourse teamhttps://sisu.ut.ee/measurement6
Ivo Leito, professor of analytical chemistry at University of Tartu.Ivo teaches analytical chemistry and metrology in chemistry at all study levelsand organizes short training courses for practitioners on different topics ofanalytical chemistry and metrology in chemistry. His research work embracesa wide area of topics ranging from studies of superacids and superbases to LC MS analysis. He is the initiator of the master’s programme AppliedMeasurement Science at University of Tartu.Lauri Jalukse, research fellow in analytical chemistry at University of Tartu.Lauri teaches analytical chemistry and metrology in chemistry at all studylevels. He is continuously introducing innovative and active learningapproaches into teaching. His research work is focused on metrological studiesof electrochemical and optical sensors, measurements of dissolved oxygenconcentration and moisture content, as well as organization of interlaboratorycomparisons.Irja Helm, research fellow in analytical chemistry at University of Tartu.Irja teaches practical classes of analytical chemistry. She takes care thatmetrological concepts and approaches are introduced to students at as earlystage of analytical chemistry studies as possible.Technical design: Educational Technology Centre, University of Tartu.Contact and feedbackIvo LeitoUniversity of TartuInstitute of ChemistryRavila 14a, Tartu 50411ESTONIATel: 372 5 184 176e mail: ivo.leito@ut.eeSkype: leitoivoCopyrightThis learning object is protected by copyright under the copyright law of the Republic of Estonia.Proprietary rights belong to the University of Tartu. It is allowed to reproduce, distribute andperform the learning object in public only for learning and teaching. The learning object can beused only as a whole, except in the case of citation. The learning object cannot be used forcommercial purposes and all usage has to be accompanied by a sufficient acknowledgement. It isnot allowed to modify or make an adaptation of the learning object.***[1] JCGM 200:2008, International vocabulary of metrology — Basic and general concepts andassociated terms (VIM), 3rd edition. BIPM, IEC, IFCC, ILAC, ISO, IUPAC, IUPAP and OIML, ww.bipm.org/en/publications/guides/vim.html.[2] This list of literature references is selecive, not exhauxtive. The references were selectedbased on the following criteria: (1) Widely used and cited; (2) useful under practical labconditions (i.e. not too deeply scientific); (3) a fairly recent version is available and (4) thedocument is preferably available free of charge on the Internet. These references are referred toin the course via superscript numbers in round brackets, e.g.: VIM(1).u mooc pdf printout 2014d.pdf 1.62 MBhttps://sisu.ut.ee/measurement7
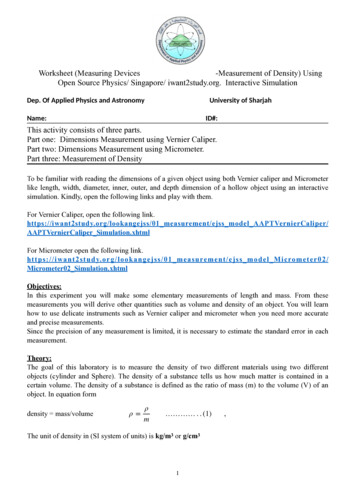
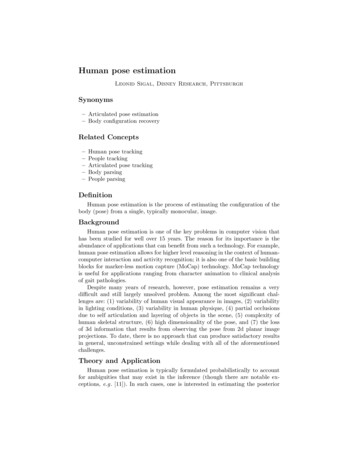
1. The concept of measurement uncertainty(MU)Brief summary: This section introduces the concepts of measurand, true value, measuredvalue, error, measurement uncertainty and probability. The concept of measurementuncertaintyhttp://www.uttv.ee/naita?id 17583https://www.youtube.com/watch?v BogGbA0hC3kMeasurement is a process of experimentally obtaining the value of a quantity. The quantity thatwe intend to measure is called measurand. In chemistry the measurand is usually the content(concentration) of some chemical entity (molecule, element, ion, etc) in some object. Thechemical entity that is intended be determined is called analyte. Measurands in chemistry canbe, for example, lead concentration in a water sample, content of pesticide thiabendazole in anorange or fat content in a bottle of milk. In the preceding example lead (element), ascorbic acid(molecule) and fat (group of different molecules) are the analytes. Water, orange and milk areanalysis objects (or samples taken from analysis objects).In principle, the aim of a measurement is to obtain the true value of the measurand. Everyeffort is made to optimize the measurement procedure (in chemistry chemical analysisprocedure or analytical procedure Analytical chemists mostly use the term „analytical method“.In this course we use the term „procedure“ instead of „method“, as this usage is supported bythe VIM. ) in such a way that the measured value is as close as possible to the truevalue. However, our measurement result will be just an estimate of the true value and the actualtrue value will (almost) always remain unknown to us. Therefore, we cannot know exactly hownear our measured value is to the true value – our estimate always has some uncertaintyassociated with it.The difference between the measured value and the true value is called error. Error can haveeither positive or negative sign. Error can be regarded as being composed of two parts –random error and systematic error – which will be dealt with in more detail in cominglectures. Like the true value, also the error is not known to us. Therefore it cannot be used inpractice for characterizing the quality of our measurement result – its agreement with the truevalue.The quality of the measurement result, its accuracy, is characterized by measurementuncertainty (or simply uncertainty), which defines an interval around the measured valueCMEASURED, where the true value CTRUE lies with some probability. The measurement uncertaintyU itself is the half width of that interval and is always non negative. Here and in the lecture thecapital U is used to denote a generic uncertainty estimate. The symbol U is picked on purpose,because expanded uncertainty (generally denoted by capital U ) fits very well with the usage ofuncertainty in this section. However, it is not explicitly called expanded uncertainty here, as thisterm will be introduced in later lectures.The following scheme (similar to the one in thelecture) illustrates this:https://sisu.ut.ee/measurement8
Scheme 1.1. Interrelations between the concepts true value, measured value, error anduncertainty.Measurement uncertainty is always associated with some probability – as will be seen in the nextlectures, it is usually not possible to define the uncertainty interval in such a way that the truevalue lies within it with 100% probability.Measurement uncertainty, as expressed here, is in some context also called the absolutemeasurement uncertainty. This means that the measurement uncertainty is expressed in thesame units as the measurand. As will be seen in subsequent lectures, it is sometimes moreuseful to express measurement uncertainty as relative measurement uncertainty, which is theratio of the absolute uncertainty U abs and the measured value y:(1.1)Relative uncertainty is a unitless quantity, which sometimes is also expressed as per cent.Measurement uncertainty is different from error in that it does not express a difference betweentwo values and it does not have a sign. Therefore it cannot be used for correcting themeasurement result and cannot be regarded as an estimate of the error because the error has asign. Instead measurement uncertainty can be regarded as our estimate, what is the highestprobable absolute difference between the measured value and the true value. With highprobability the difference between the measured value and the true value is in fact lower thanthe measurement uncertainty. However, there is a low probability that this difference can behigher than the measurement uncertainty.Both the true value and error (random and systematic) are abstract concepts. Their exact valuescannot be determined. However, these concepts are nevertheless useful, because theirestimates can be determined and are highly useful. In fact, as said above, our measured valueis an estimate of the true value.***[1] Analytical chemists mostly use the term „analytical method“. In this course we use the term„procedure“ instead of „method“, as this usage is supported by the VIM.[2] Here and in the lecture the capital U is used to denote a generic uncertainty estimate. Thesymbol U is picked on purpose, because expanded uncertainty (generally denoted by capitalhttps://sisu.ut.ee/measurement9
U ) fits very well with the usage of uncertainty in this section. However, it is not explicitly calledexpanded uncertainty here, as this term will be introduced in later lectures.https://sisu.ut.ee/measurement10
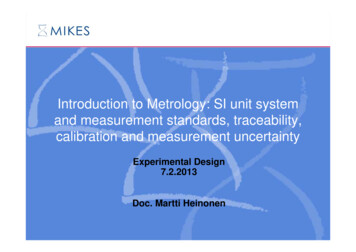
2. The origin of measurement uncertaintyBrief summary: Explanation, on the example of pipetting, where measurement uncertaintycomes from. The concept of uncertainty sources – effects that cause the deviation of themeasured value from the true value – is introduced. The main uncertainty sources of pipettingare introduced and explained: repeatability, calibration, temperature effect. Explanation ofrandom and systematic effects is given. The concept of repeatability is introduced.The first video demonstrates how pipetting with a classical volumetric pipette is done andexplains where the uncertainty of the pipetted volume comes from. of uncertainty source explained on the exampleWhy measurement results have uncertainty? The conceptof pipettinghttp://www.uttv.ee/naita?id 17577https://www.youtube.com/watch?v ufWJB9orWdUThe second video demonstrates pipetting with a modern automatic pipette and explains theuncertainty sources in pipetting with an automatic pipette This second video explains how topipet with an automatic pipette if accurate volume is desired. In many routine, high volumeapplications (e.g. in biochemistry), however, speed is more impoirtant than accuracy and in suchcases some steps shown here, most importantly, rinsing, can be omitted. Also, in some casesthere is a very limited volume available of the solution that is pipetted – in such case alsorinsing is not possible. On the other hand, if still higher accuracy is desired then the so calledreverse pipetting technique can be used. Reverse pipetting is more accurate than the commonlyused forward pipetting, which is the technique demonstrated and explained in this video. .Measurement uncertainty sources of pipetting with an automatic pipettehttp://www.uttv.ee/naita?id 18164https://www.youtube.com/watch?v hicLweJcJWYMeasurement results have uncertainty because there are uncertainty sources (effects thatcause uncertainty). These are effects that cause deviations of the measured value from the truevalue. These sources also cause the existence of error and could therefore also be called errorsources.If the used measurement procedure is well known then the mostimportantuncertainty sources are usually also known. Efforts should be made to minimize and, if possible,eliminate uncertainty sources by optimizing the measurement procedure (analysis procedure).The uncertainty sources that cannot be eliminated (and it is never possible to eliminate alluncertainty sources) have to be taken into account in uncertainty estimation.The magnitudes of the deviations caused by uncertainty sources are usually unknown and inmany cases cannot be known. Thus, they can only be estimated. If we can estimate themagnitudes of all important uncertainty sources then we can combine them and obtain theestimate of measurement uncertainty, which in this case will be called combined measurementuncertainty. How this combining is mathematically done, will be demonstrated in the cominglectures.If we make a number of repeated measurements of the same measurand then ideally all theserepeated measurements should give exactly the same value and this value should be equal tothe true value of the measurand. In reality the results of the repeated measurements almostalways differ to some extent and their mean value also usually differs from the true value. Theuncertainty sources cause this. In a somewhat simplified way the uncertainty sources (or effects)can be divided into random effects and systematic effects. It is in principle not wrong to callthem random and systematic sources of uncertainty, but this is not usually done. This is largelyhttps://sisu.ut.ee/measurement11because, as we will see in a coming lecture, the concept of measurement uncertainty stresses
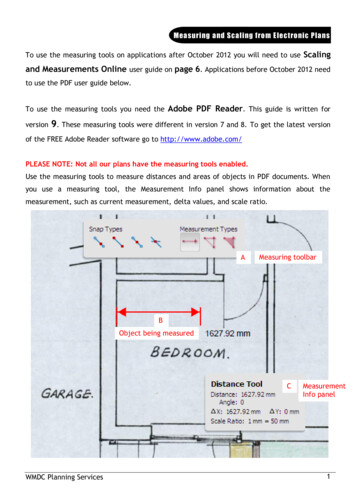
because, as we will see in a coming lecture, the concept of measurement uncertainty stressesthat random and systematic effects should be treated the same way.The following schemeillustrates this (green circles denote true values, yellow circles denote measured values):Scheme 2.1. The influence of random and systematic effects on measurementuncertainty.Random effects cause the difference between the repeated measurement results (and thus,obviously, also from the true value). However, if a large number of repeated measurements aremade then the mean value will have little influence from the random effects (situation 2 on thescheme). So, the influence of random effects can be decreased by increasing the number ofrepetitions. Systematic effects cause deviation of all measurements in the series into the samedirection by the same magnitude. It is more correct to say „by a predictable magnitude“. Thismeans that the magnitude is not necessarily always the same – it can vary, e.g. as themagnitude of the measurand value varies – but it can be predicted, i.e. it is not random.Increasing the number of repetitions does not enable decreasing their influence (situation 3 onthe scheme).In principle it is desirable to determine the magnitude and direction of the systematic effects andcorrect the measurement results for the systematic effects. However, it can often be so difficultand work intensive, that it becomes impractical. Therefore in many cases, rather than accuratelydetermining the systematic effects and correcting for them their possible magnitudes isestimated and are taken into account as uncertainty sources. In lectures 5.4 and 6 random andsystematic effects are treated more comprehensively.There are in general four main sources of uncertainty in volumetric measurements, i.e.measurements by pipettes, burettes, measuring cylinders and volumetric flasksUncertainty due to the non ideal repeatability of measurement (often calledrepeatability uncertainty). In the case of pipetting this means that however carefully wetry to fill and empty the pipette, we will nevertheless every time get a slightly differentvolume. This is sometimes referred to as the “human effect” or the “human factor”, but infact, if a machine would do the pipetting then there would also be difference between thevolumes (although probably smaller). Repeatability is a typical random effect andcontributes to uncertainty with glass pipettes as well as with automatic pipettes. Itsinfluence on the measurement result can be decreased by making repeated measurementsbut it can never be entirely eliminated.Uncertainty due to calibration of the volumetric equipment (often called calibrationuncertainty). In the case of volumetric glassware this is the uncertainty in the positions ofthe marks on the volumetric glassware. In the case of automatic pipettes this uncertaintyis caused by the systematically too high or too low displacement of the piston inside thepipette. In the case of a given pipette it is a typical systematic uncertainty source. Thisuncertainty source can be significantly reduced by recalibrating the pipette in thelaboratory by the person who actually works with it. Accurate weighing of water athttps://sisu.ut.ee/measurement12
controlled temperature is the basis of calibration of volumetric instruments and also theway how usually the repeatability uncertainties of different volumetric instruments arefound.Uncertainty due to the temperature effect (often called as temperature uncertainty). Allvolumetric ware is usually calibrated at 20 C and volumes usually refer to volumes at 20 C. The density of the liquid changes (almost always decreases) with temperature. Ifpipetting is done at a higher temperature than 20 C then there amount of liquid (in termsof mass or number of molecules) pipetted is smaller than if it were done at 20 C.Consequently, the volume of that amount of liquid at 20 C is also smaller than if thepipetting were done at 20 C. In the case of volumetric glassware temperature affects thedimensions of the volumetric ware (its volume increases with temperature). The effect ofliquid density change is ca 10 times stronger. Therefore the volume change of volumetricglassware is almost always neglected. In the case of automatic pipettes the effect oftemperature is more complex. If the air inside the pipette warms then the delivered liquidvolume can change to some extent. If the temperature of the laboratory and, importantly,temperature of the pipetted liquid, is constant during repeated measurements then thetemperature effect is a systematic effect.Application specific uncertainty sources. These are not caused by the volumetric equipmentbut by the liquid that is handled or by the system that is investigated. Some examples:If a foaming solution is pipetted, measured by a volumetric flask or ameasuring cylinder then it is not clear where exactly the solution “ends”, i.e.,there is no well defined meniscus. This will cause an additional uncertainty.Depending on situation this effect can be random or systematic or include bothrandom and systematic part.If titration is carried out using visual indicator then the end point of titration,i.e. the moment when the indicator changes color is assumed to match theequivalence point (the stoichiometry point). However, depending on thetitration reaction and on the actual analyte that is titrated, the end point maycome earlier or later than the equivalence point. In the case of the giventitration this will be a systematic effect. This effect can be minimized by someother means of end point detection, e.g. potentiometric titration. In fact, evenif the end point is determined potentiometrically, it can still have somesystematic deviation from the equivalence point. However, this effect is usuallyso small that it can be neglected.There are some other uncertainty sources that usually turn out to be less important, becausethey can be minimized or eliminated by correct working practices (however, they can beimportant if these correctly practices are not applied). The remaining effects will usuallyinfluence the repe
edition of the MOOC. As a guest you cannot post to forums and take quizzes. Short description of the course This is an introductory course on estimation of measurement uncertainty, specifically related to chemical analysis (analytical chemistry). The course gives the main concepts and mathematical