Transcription
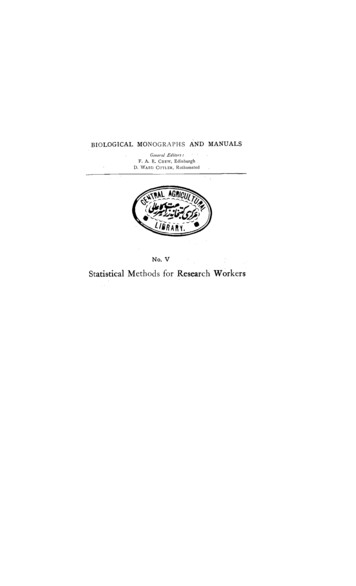
BIOLOGICAL MONOGRAPHS AND MANUALSGeneral Editors:F. A. E. CREW, EdinburghD. WARD CUTLER, RothamstedNo. VStatistical Methods for Research Workers
BIOLOGICAL MONOGRAPHS AND MANUALSTHE PIGMENTARY EFFECTOR SYSTEMBy L. T. Hogben, London School of Economics.THE ERYTHROCYTE AND THE ACTION OF SIMPLE HlEl\IOLYSINSBy E. Ponder, New York University.ANIMAL GENETICS: AN INTRODUCTION TO THE SCIENCE OF ANIMALBREEDINGBy F. A. E. Crew, Edinburgh University.REPRODUCTION IN THE RABBITBy J.Hammon ,School of Agriculture, Cambridge.STATISTICAL METHODS FOR RESI :ARCH WORKERS-·By R. A. Fisher, University of London.THECOMPARATIVE ANATOMY,THIe PITUITARY BODY.,HISTOLOGY, AND DE ELOPMENT OFBy G. R. de Beer, Oxford University.THE COMPOSITION AND DISTRIBUTION OF THE PROTOZOANOF THE SOILFAUNABy H. Sandon, Egyptian University, Cairo.THE SPECIES PROBLEMBy G. C. Robson, British Museum (Natural History). THE MIGRATION OF BUTTERFLIESBy C. B. Williams, Rothamsted Experimental Station.GROWTH AND THE DEVELOP:\IENT OF MUTTON QUALITIES IN THESHEEPBy John Hammond, Cambridge.MATERNAL BEHAVIOUR IN THE RATBy Bertold P. Wiesner and Norah M. Sheard.And other volumes are in course0/ puJilication.
Statistical Methods forResearch WorkersBYR. A. FISHER, Sc.D., F.R.S.Formerly Fellow oj Conville and Caius Colle/;e, CambridgeHonorary Member, American Statistical Assoc f!tl0!1-. .ziver YA'l0 LOI!,ffnI 1,.'· I, jCalton Professor,FIFTH EDITION-REVISED AND ENLARGED-ANGRAU Central 111 1111"OL C r;-. OYDEDINBURGH: TWEEDDALE COURTLONDON: 33 PATERNOSTER ROW, E.C.I934
}IADE; INOLIVER AND:R ATBRITAIN BYOYD LTD ., EDINBURGH
EDITORS' PREFACETHE increasing specialisation in biological inquiryhas made it impossible for anyone author to dealadequately with current advances in knowledge. Ithas become a matter of considerable difficulty for aresearch stud nt to gain a correct idea of the presentstate of knowledge of a subject fn which he himself isinterested. To meet this situation the text-book is'being supplemented by the monograph.The aim of the present series is to provide authoritative accounts of what has been done in some of thediverse branches of biological investigation, and atthe same time to give to those who have contributednotably to the development of a particular field ofinquiry an opportunity of presenting the results oftheir resear ches, scattered throughout the scientificjournals, in a more extended form, showing theirrelation to what has already been done and toproblems that remain to be solved.The present generation is witnessing" a return tothe practice of older days when animal physiologywas not yet divorced from morphology." Conspicuous progress is now being seen in the field ofgeneral physiology, of experimental biology, and inthe application of biological principles to economicproblems. Often the analysis of large masses ofdata by statistical methods is necessary, and thebiological worker is continually encountering advancedv
VIEDITORS' PREFACEstatistical problems the adequate solutions of whichare not found in current statistical text-books. Tomeet these needs the present monograph was prepared, and the early call for the second and latereditions indicates the success attained by the authorIn this project.F. A. E. C.D. W. C.
PREFACE TO FIRST EDITIONseveral years the author has been working Insomewhat intimate co-operation with a number ofbiological research departments; the present book isin every sense the product of this circumstance. Dailycontact with the statistical problems which presentthemselves to the laboratory worker has stimulatedthe purely mathematical researches upon which arebased the methods here presented. Little experienceis sufficient to show that the traditional machinery ofstatistical processes is wholly unsuited to the needs ofpractical research. Not only does it take a cannonto shoot a sparrow, but it misses the sparrow! Theelaborate mechanism built on the theory of infinitelylarge samples is not accurate enough for simple laboratory data. Only by systematically tackling smallsample problems on their merits does it seem possible. to apply accurate tests to practical data. Such atleast has been the aim of this book.lowe more than I can say to Mr W. S. Gosset,Mr E. Somerfield, and Miss W. A. Mackenzie, whohave read the proofs and made many valuable suggestions. Many small but none the less troublesomeerrors have been removed; I shall be grateful toreaders who will notify me of any further errors andambiguities they may detect.FORROTHAMSTED EXPERIMENTAL STATION,February 1925.vii
PREFACE TO FIFTH EDITIONTHE rapid demand for a fifth edition has more thanjustified the author's hope that use could be madeof a book which, without entering into the mathematical theory of statistical methods, should embodythe latest results of that theory, presenting them inthe form of practical procedures appropriate to thosetypes of data with which research workers are actuallyconcerned.Those critics who would like to have seen theinclusion of mathematical proofs of the more importantpropositions of the underlying theory, must still bereferred to the technical publications given in the listof sources. There they will encounter exactly thosedifficulties which it would be undesirable to importinto the present work; and will perceive that modernstatistics could not have been developed without theelaboration of a system of ideas, logical and mathematical, which, however fascinating in themselves,cannot be regarded as a necessary part of the equipment of every research worker.To present "elementary proofs," of the kindwhich do not involve these ideas, would be really tojustify the censure of a second school of critics, who,rightly feeling that a fallacious proof is worse thannone, are eager to decry any attempt to "teachpeople to run before they can walk." The actualscope of the present volume really exempts it fromix
xPREFACE TO FIFTH EDITIONthis criticism, which, besides, in an age of technicaico-operation, has seldom much force. The practicalapplication of general theorems is a different art fromtheir establishment by mathematical proof, and oneuseful to many to whom the other is unnecessary.In the second edition the importance of providinga striking and detailed illustration of the principles ofstatistical estimation led to the addition of a ninthchapter. The subject had received only general·discussion in the first edition, and, in spite of itspractical importance, had not yet won sufficientattention from teachers to drive out of practice thedemonstrably defective procedures which were stiIIunfortunately taught to students. The new chaptersuperseded Section 6 and Example I of the firstedition; in the third edition it was enlarged by twonew sections (57' I and 57' 2) illustrating further theapplicability of the method of maximum likelihood,and of the quantitative evaluation of information.In Section 27 a generalised form for the series oforthogonal polynomials was added to the third edition,in response to the need which is felt, with re pectto some important classes of data, to use polynomialsof higher degree than the fifth. Simple and directalgebraic proofs of the methods of Sections 28 and28· I have been published by Miss F. E. Allan.In the fourth edition the Appendix to Chapter II I.,on technical notation, was entirely rewritten, sincethe inconveniences of the moment notation seemedby that time definitely to outweigh the advantages rformerly conferred by its familiarity. The principal\
PREFACE TO FIFTH EDITIONXlnew matter in that edition was added m response tothe increasing use of the analysis of covariance,which is explained in Section 49' I. Since severalwriters have found difficulty in applying the appropriate tests of significance to deviations from regressionformulce, this section has been further enlarged in thefifth edi tion.Other new sections in this edition are 21'01, givinga correction for continuity recently introduced by F.Yates, and 21·02 giving the exact test of significancefor 2 x 2 tables. Workers who are accustomed tohandle regression equations with a large number ofvariates will be interested in Section 29' I, whichprovides the relatively simple adjustments to be madewhen, at a late stage, it is decided that one or moreof the variates used may with advantage be omitted.The possibility of doing this without laborious recalculations should encourage workers to make the listof independent variates included more comprehensivethan has, in the past, been thought advisable.Section 5, formerly occupied by an account of thetables available for testing significance, has now beengiven to a historical note on the principal contributorsto the development of statistical reasoning.With respect to the folding copies of tables boundwith the book, it may be mentioned that manylaboratory workers, who have occasion to use themconstantly, have found it convenient to mount theseon the faces of triangular or square prisms, whichmay be kept near at hand for immediate reference.The practical advantages of this plan have made
!., .'XllPREFACE TO FIFTH EDITIONit seem worth while to bring it to the notice of allreaders.I t should be noted that numbers of sections, tablesand examples have been unaltered by the insertion offresh material, so that references to them, thoughnot to pages, will be valid irrespective o.f the editionused.GALTON LABORATORY,October 1934.
CONTENTSPAGE,PovEDITORS' PREFACEPREFACE TO FIRST EDITIONviiPREFACE TO FIFTH EDITIONIX1. INTRODUCTORY25II. DIAGRAMS41II. DISTRIBUTIONSlV. TESTSOFGOODNESSOFFIT,INDEPENDENCEAND80HOMOGENEITY; WITH TABLE OF X2V. TESTS OF SIGNIFICANCE OFfofEANS,DIFFERENCESOFMEANS, AND REGRESSION COEFFICIENTSVI.112THE CORRELATION COEFFICIENTII. I!. FURTHER ApPLICATIONS OF THE ANALYSIS OF VARIANCE236:X.THE PRINCIPLES OF STATISTICAL ESTIMATION273SOURCES USED FOR DATA AND METHODS30 7BIBLIOGRAPHY3 11INDEX317TABLESI. AND II. NORMAL DISTRIBUTIONII. TABLE OF X2lV. TAELE OF.4t·.A. CORRELATION COEFFICIENT-SIGNIFICANT VALUES'.E. CORRELATION COEFFICIENT-TRANSFORMED VALUESvI. TAELE OFxiiiZ
Statistical Methodsfor Research Workers
STATISTICAL METHODS FORRESEARCH WORKERSIINTRODUCTORY1. The Scope of StatisticsIfHE science of statistics is essentially a branch ofApplied Mathematics, and rna y be regarded asmathematics applied to observational data. As inother mathematical studies the same formula is equallyrelevant to widely different groups of subject matter.Consequently the unity of the different applicationshas usually been overlooked, the more naturallybecause the development of the underlying mathematical theory has been much neglected. We shalltherefore consider the subject matter of statisticsunder three different aspects, and then show in moremathematical language that the same types of problems arise in every case. Statistics may be regardedas (i.) the study of populations, (ii.) as the studyof variation, (iii.) as the study of methods of thereduction of data.The original meaning of the word "statistics"B
2STATISTICAL METHODSsuggests that it was the study of populations of humanbeings living in political union.The methodsdeveloped, however, have nothing to do with thepolitical unity of the group, and are not confinedto populations of men or of social insects. Indeed,since no observational record can completely specifya human being, the populations studied are alwaysto some extent abstractions. If we have records ofthe stature of 10,000 recruits, it is rather the population of statures than the population of recruits that isopen to study. Nevertheless, in a real sense, statisticsis the study of populations, or aggregates of individuals, rather than of individuals. Scientific theorieswhich involve the properties of large aggregates ofindividuals, and not necessarily the properties of theindividuals themselves, such as the Kinetic Theoryof Gases, the Theory of Natural Selection, or thechemical Theory of Mass Action, are essentiallystatistical arguments, and are liable to misinterpretation as soon as the statistical nature of the argumentis lost sight of. Statistical methods are essentialto social studies, and it is principally by the aid ofsuch methods that these studies may be raised tothe rank of sciences. This particular dependence ofsocial studies upon statistical methods has led to theunfortunate misapprehension that statistics is to beregarded as a branch of economics, whereas in truthmethods adequate to the treatment of economic data,in so far as these exist, have only been developed inthe study of biology and the other sciences.The idea of a population is to be applied not only
INTRODUCTORY3to living, or even to material, individuals. If an observation, such as a simple measurement, be repeatedindefinitely, the aggregate of the results is a population of measurements. Such populations are theparticular field of study of the Theory of Errors, oneof the oldest and most fruitful lines of statistical investigation. Just as a single observation may beregarded as an individual, and its repetition as generating a population, so the entire result of an extensiveexperiment may be regarded as but one of a population of such experiments. The salutary habit ofrepeating important experiments, or of carrying outoriginal observations in replicate, shows a tacitappreciation of the fact that the object of our study isnot the individual result, but the population of possibilities of which we do our best to make our experimentsrepresentative. The calculation of means and probableerrors shows a deliberate attempt to learn somethingabout that population.The conception of statistics as the study of variation is the natural outcome of viewing the subject asthe study of populations; for a population of individuals in all respects identical is completely describedby a description of anyone individual, together withthe number in the group. The populations whichare the object of statistical study always displayTo speak ofvariation in one or more respects.statistics as. the study of variation also serves toemphasise the contrast between the aims of modernstatisticians and those of their predecessors. For,until comparatively recent times, the vast majority
4STATISTICAL METHODSof workers in this field appear to have had no otheraim than to ascertain aggregate, or average, values.The variation itself was not an object of study, butwas recognised rather as a troublesome circumstancewhich detracted from the value of the average. Theerror curve of the mean of a normal sample has beenfamiliar for a century, but that of the standard deviation was the object of researches up to 1915. Yet,from the modern point of view, the study of the causesof variation of any variable phenomenon, from theyield of wheat to the intellect of man, should be begunby the examination and measurement of the variationwhich presents itself.The study of variation leads immediately to theconcept of a frequency distribution. Frequency distributions are of various kinds, according as thenumber of classes in which the population is distributed is finite or infinite, and also according as theintervals which separate the classes are finite orinfinitesimal. In the simplest possible case, in whichthere are only two classes, such as male and femaiebirths, the distribution is simply specified by the proportion in which these occur, as for example by thestatement that 5 I per cent. of the births are of malesand 49 per cent. of females. In other cases the variation may be discontinuous, but the number of classesindefinite, as with the number of children born todifferent married couples; the frequency distributionwould then show the frequency with which 0, I, 2 . . .children were recorded, the number of classes beingsufficient to include the largest family in the record.
INTRODUCTORY5The variable quantity, such as the number of children,is called the variate, and the frequency distributionspecifies how frequently the variate takes each of itspossible values. I n the third group of cases, thevariate, such as human stature, may take any intermediate value within its range of variation; thevariate is then said to vary continuously, and thefrequency distribution may be expressed by stating, asa mathematical function of the variate, either (i.) theproportion of the population for which the variate isless than any given value, or (ii.) by the mathematicaldevice of differentiating this function, the (infinitesimal)proportion of the population for which the variatefalls within any infinitesimal element of its range.The idea of a frequency distribution is applicableeither to populations which are finite in number, or toinfinite populations, but it is more usefully and moresimply applied to the latter. A finite population canonly be divided in certain limited ratios, and cannot inany case exhibit continuous variation. Moreover, inmost cases only an infinite population can exhibitaccurately, and in their true proportion, the whole ofthe possibilities arising from the causes actually atwork, and which we wish to study. The actualobservations can only be a sample of such possibilities.With an infinite population the frequency distributionspecifies the fractions of the population assigned tothe several classes; we may have (i.) a finite numberof fractions adding up to unity as in the Mendelianfrequency distributions, or (ii.) an infinite series offinite fractions adding up to unity, or (iii.) a mathe-
6STATISTICAL METHODSmatical function expressing the fraction of the totalin each of the infinitesimal elements in which the rangeof the variate may be divided. The last possibilitymay be represented by a frequency curve; the valuesof the variate are set out along a horizontal axis, thefraction of the total population, within any limits ofthe variate, being represented by the area of the curvestanding on the corresponding length of the axis. Itshould be noted that the familiar concept of thefrequency curve is only applicable to an infinitepopulation with continuous variate.The study of variation has led not merely tomeasurement of the amount of variation present, butto the study of the qualitative problems of the type, orform, of the variation. Especially important is thestudy of the simultaneous variation of two or morevariates. This study, arising principally out of thework of Galton and Pearson, is generally known inEnglish un er the name of Correlation, but by somecontinental writers as Covariation.The third aspect under which we shall regard thescope of statistics is introduced by the practical needto reduce the bulk of any given body of data. Anyinvestigator who has carried out methodical andextensive observations will probably be familiar withthe oppressive necessity of reducing his results to amore convenient bulk. No human mind is capable ofgrasping in its entirety the meaning of any considerable quantity of numerical data. We want to be ableto express all the relevant information contained inthe mass by means of comparatively few numerical
INTRODUCTORY7values. This is a purely practical need which thescience of statistics is able to some extent to meet. Insome cases at any rate it s possible to give the wholeof the relevant information by means of one or a fewvalues. In all cases, perhaps, it is possible to reduceto a simple numerical form the main issues which theinvestigator has in view, in so far as the data are competent to throw light on such issues. The number ofindependent facts supplied by the data is usually fargreater than the number of facts sought, and in consequence much of the information supplied by any bodyof actual data is irrelevant. I t is the object of thestatistical processes employed in the reduction of datato exclude this irrelevant information, and to isolatethe whole of the relevant information contained in thedata.2. General Method, Calculation of StatisticsThe discrimination between the irrelevant information and that which is relevant is performed as' follows.Even in the simplest cases the values (or sets ofvalues) before us are interpreted as a random sampleof a hypothetical infinite population of such values asmight have arisen in the same circumstances. Thedistribution of this population will be capable of somekind of mathematical specification, involving a certainnumber, usually few, of parameters, or "constants"entering into the mathematical formula. These parameters are the characters of the population. If wecould know the exact values of the parameters, weshould know all (and more than) any sample from
8STATISTICAL METHODSthe population could tell us. We cannot in fact knowthe parameters exactly, but we can make estimatesof their values, which will be more or less inexact.These estimates, which are termed statistics, are ofcourse calculated from the observations. If we canfind a mathematical form for the population whichadequately represents the data, and then calculatefrom the data the best possible estimates of the required parameters, then it would seem that there islittle, or nothing, more that the data can tell us; weshall have extracted from it all the available relevantinformation.The value of such estimates as we can make isenormously increased if we can calculate the magnitudeand nature of the errors to ,which they are subject. Ifwe can rely upon the specification adopted, this presents the purely mathematical problem of deducingfrom the nature of the population what will be thebehaviour of each of the possible statistics which canbe calculated. This type of problem, with which untilrecent years comparatively little progress had beenmade, is the basis of the tests of significance by whichwe can examine whether or not the data are in harmonywith any suggested hypothesis. In particular, it isnecessary to test the adequacy of the hypotheticalspecification of the population upon which the methodof reduction was based.The problems which arise in the reduction of datamay thus conveniently be divided into three types:(i.) Problems of Specification, which arise in thechoice of the mathematical form of the population.
INTRODUCTORY9(ii.) Problems of Estimation, which involve thechoice of method of calculating, from our sample,statistics fit to estimate the unknown parameters ofthe population.(iii.) Problems of Distribution, which include thema thematical deduction of the exact nature of thedistribution in random samples of our estimates of theparameters, and of other statistics designed to testthe validity of our specification (tests of Goodness ofFit).The statistical examination of a body of data isthus logically similar to the general alternation ofinductive and deductive methods throughout the/sciences. A hypothesis is conceived and defined withall necessary exactitude; its logical consequences areascertained by a deductive argument; these consequences are compared with the available observations;if these are completely in accord with the deductions,the hypothesis is justified at least until fresh and morestringent observations are available.The deduction of inferences respecting samples,from assumptions respecting the populations fromwhich they are drawn, shows us the position inStatistics of the classical Theory of Probability. Fora given population we may calculate the robabilitywith which any given sample will occur, and if wecan solve the purely mathematical problem presented,we can calculate the probability of occurrence of anygiven statistic calculated from such a sample. Theproblems of distribution may in fact be regarded asapplications and extensions of the theory of prob-
10STATISTICAL METHODSability. Three of the distributions with which weshall be concerned, Bernoulli's binomial distribution,Laplace's normal distribution, and Poisson's series,were developed by writers on probability. For manyyears, extending over a century and a half, attemptswere made to extend the domain of the idea of pro bability to the deduction of inferences respectingpopulations from assumptions (or observations) respecting samples. Such inferences are usually distinguished under the heading of Inverse Probability,and have at times gained wide acceptance. This isnot the place to enter into the subtleties of a prolongedcontroversy; it will be sufficient in this generaloutline of the scope of Statistical Science to reaffirmmy personal conviction, which I have sustained elsewhere, that the theory of inverse probability is foundedupon an error, and must be wholly rejected. Inferences respecting populations, from which knownsamples have been drawn, cannot by this method beexpressed in terms of probability, except in the trivialcase when the population is itself a sample of a superpopulation the specification of which is known withaccuracy.The probabilities established by those tests ofsignificance, which we shall later designate by t and z,are, however, entirely distinct from statements ofinverse probability, and are free from the objectionswhich apply to these latter. Their interpretation asprobability statements respecting populations constitutean application unknown to the classical writers onprobability.
INTRODUCTORYI IThe rejection of the theory of inverse probabilityshould not be taken to imply that we cannot draw,from knowledge of a sample, inferences respectingthe corresponding population. Such a view wouldentirely deny validity to all experimental science.What is essential is that the mathematical concept ofprobability is, in most cases, inadequate to express ourmental confidence or diffidence in making such inferences, and that the mathematical quantity whichappears to be appropriate for measuring our order ofpreference among different possible populations doesnot in fact obey the laws of probability. To distinguishit from probability, I have used the term" Likelihood"to designate this quantity; since both the words" likelihood" and "probability" are loosely used incommon speech to cover both kinds of relationship.3. The Qualifications of Satisfactory StatisticsThe solutions of problems of distribution (whichmay be regarded as purely deductive problems in thetheory of probability) not only enable us to makecritical tests of the significance of statistical results, andof the adequacy of the hypothetical distribution upon which our methods of numerical deduction are based,but afford real guidance in the choice of appropriatestatistics for purposes of estimation. Such statisticsmay be divided into classes according to the behaviourof their distributions in large samples.If we calculate a statistic, such, for example, as themean, from a very large sample, we are accustomed toascribe to it great accuracy; and indeed it will usually,PROPERty OFAtI.r. AG&ICULTUP.AL u.avEUIW.L.I "A" yCOL.LEGi Of AG \CUL.TUl\1. ft
'I2.STATISTICAL METHODSbut not always, be true, that if a number of suchstatistics can be obtained and compared, the discrepancies between them will grow less and less, as thesamples from which they are drawn are made largerand larger. In fact, as the samples are made largerwithout limit, the statistic will usually tend to somefixed value characteristic of the population, nd, therefore, expressible in terms of the parameters of thepopulation. I f, therefore, such a statistic is to be usedto estimate these parameters, there is only one parametric function to which it can properly be equated.If it be equated to some other parametric function, weshall be using a statistic which even from an infinitesample does not give the correct value; it tendsindeed to a fixed value, but to a value which is erroneous from the point of view with which it was used.Such statistics are termed Inconsistent Statistics;except when the error is extremely minute, as in theuse of Sheppard's adjustments, inconsistent statisticsshould be regarded as outside the pale of decent usage.Consistent statistics, on the other hand, all tendmore and more nearly to give the correct values, as. the sample is more and more increased; at any rate,if they tend to any fixed value it is not to an incorrectone. In the simplest cases, with which we shall beconcerned, they not only tend to give the correctvalue, but the errors, for samples of a given size, tendto be distributed in a well-known distribution (of whichmore in Chap. III.) known as the Normal Law ofFrequency of Error, or more simply as the normaldistribution. The liability to error may, in such cases,
INTRODUCTORY13be expressed by calculating the mean value of thesquares of these errors, a value which is known as thevariance; and in the class of cases with which we areconcerned, the variance falls off with increasingsamples, in inverse proportion to the number in thesample.N ow, for the purpose of estimating any parameter,it is usually possible to invent any number of statisticswhich shall be consistent in the sense defined above,and each of which has in large samples a variancefalling off inversely with the size of the sample. Butfor large samples of a fixed size, the variance of thesedifferent statistics will generally be different. Conse quently a special importance belongs to a smallergroup of statistics, the error distributions of which tendto the normal distribution, as the sample is increased,with the least possible variance. We may thus separateoff from the general body of consistent statistics agroup of especial value, and these are known asefficient statistics.The reason for this term may be made apparent byan example. If from a large sample of (say) 1000observations we calculate an efficient statistic, A, anda second consistent statistic, B, having twice thevariance of A, then B will be a valid estimate of therequired parameter, but one definitely inferior to Ain its accuracy. Using the statistic B, a sample of2000 values would be
ii. intraclass correlations and the analysis of variance. page v vii ix 25 41 80 112 160 i!. further applications of the analysis of variance 236 :x. the principles of statistical estimation 273 sources used for data and methods bibliography index tables i. and ii. normal distribution ii. table of x2 lv. taele of t .4