Transcription
Livability and Subjective Well-Being AcrossEuropean CitiesAdam Okulicz-Kozaryn & RubiaR. ValenteApplied Research in Quality of LifeThe Official Journal of the InternationalSociety for Quality-of-Life StudiesISSN 1871-2584Applied Research Quality LifeDOI 10.1007/s11482-017-9587-71 23
Your article is protected by copyright and allrights are held exclusively by Springer Science Business Media B.V., part of Springer Natureand The International Society for Qualityof-Life Studies (ISQOLS). This e-offprint isfor personal use only and shall not be selfarchived in electronic repositories. If you wishto self-archive your article, please use theaccepted manuscript version for posting onyour own website. You may further depositthe accepted manuscript version in anyrepository, provided it is only made publiclyavailable 12 months after official publicationor later and provided acknowledgement isgiven to the original source of publicationand a link is inserted to the published articleon Springer's website. The link must beaccompanied by the following text: "The finalpublication is available at link.springer.com”.1 23
Author's personal copyApplied Research Quality ility and Subjective Well-Being Across EuropeanCitiesAdam Okulicz-Kozaryn1,2 · Rubia R. Valente3Received: 20 July 2017 / Accepted: 19 December 2017 Springer Science Business Media B.V., part of Springer Nature and The International Society forQuality-of-Life Studies (ISQOLS) 2018Abstract This study documents for the first time the correlation between livabilityand subjective well-being (SWB) across European cities. Livability is measured withthe popular Mercer Quality of Living Survey and correlates considerably with SWB,measured as place and life satisfactions. There are outliers, for instance: the “unlivable” but “happy” Belfast (fool’s paradise) and the “livable,” but “unhappy” Paris(fool’s hell). In addition, we find geographic patterns: while the Mercer index rankshigher Western cities, subjective well-being is higher in Northern cities. Smallercities score higher on both livability and SWB, confirming thus the urban sociologicaltheory of urban malaise while contradicting urban economic theory of city triumph.Keywords Satisfaction · Happiness · Subjective well-being · Quality of life · Urbanquality of life · Cities · City rankings · Livability · Best places to live · Mercer ·Economic theory · UtilityLivability refers to the quality of life, standard of living, or general well-being ofa population in a specific region, area, or city. It is the sum of factors that add Adam //sites.google.com/site/adamokuliczkozaryn/Rubia R. te.com1Department of Public Policy & Administration, Rutgers University, 401 Cooper St., Camden,NJ 08102, USA2Vistula University, Warsaw, Poland3Marxe School of Public and International Affairs, Baruch College, CUNY, New York, NY, USA
Author's personal copyA. Okulicz-Kozaryn, R. R. Valenteup to a community’s quality of life (economic prosperity, social equity and stability, educational opportunities, recreation and cultural possibilities, etc.) According tothe Mercer Quality of Living Survey,1 the cities with the highest levels of livabilityare predominantly European (Okulicz-Kozaryn 2013; Mercer 1999). Vienna, Zurich,Geneva, and Copenhagen, among others, rank as the most livable cities. This paperaims to explore for the first time whether urban livability is correlated to happiness inEurope. Does living in a city with high levels of livability increase happiness? Or isindividual happiness independent from the livability of a city? Similarly, is the relationship between livability and happiness consistent throughout Europe or are thereregional differences?To address these questions, it is important to recognize that Europe is largelydivided into two main areas: East and West. These regions are distinct in how theirinstitutions are organized and on the characteristics of their residents. The East tendsto be more traditional and some might even consider it “backward,” while poorlygoverned and with low opportunities for economic advance, yet residents tend to becheerful and spontaneous. The East is a region experiencing a new post-communistera, and is less advanced in terms of democracy and capitalism, although some arguethat these differences are disappearing (Hudabiunigg 2004). Unlike the East, the Westhas institutions that are well governed and organized governments are more progressive and well-endowed, providing residents with opportunities for financial success.Yet, people in the West are known to be “grim and stiff.” This duality seems to beapplicable to the South and North regions of Europe as well, where Eastern qualitiescan be also applied to the South, and Western qualities to the North.These contrasting differences should be of concern to policymakers and Europeancitizens alike, given that one of the founding principles of the European Union isto promote economic, social and territorial cohesion among member states (Union2004). In addition, with ever increasing urbanization2 and the free movement ofEU citizens within the European Union, understanding the relationship between livability and subjective well-being may help explain residency decisions, and providemeasurement to promote territorial cohesion among member states.The Social Indicators Literature: Objective and SubjectiveAccording to the Webster dictionary, livability is defined as “suitability for humanliving.” Some scholars, define livability as (objective) quality of life, welfare, ‘levelof living,’ or habitability (Veenhoven 2000). Another definition for livability is quality of place (Burton 2014) and its synonyms: environmental quality or urban quality,defined as the “the physical characteristics of community, the way it is planned,1 TheMercer Survey, also referred to as the Mercer Index, evaluates cities based on 39 factors includingpolitical, economic, environmental, personal safety, health, education, transportation, and other publicservice factors. We discuss the index later in depth.2 Europe, as the rest of the world, is urbanizing: in 1950 about half of Europeans lived in cities, now it isabout 74% and the urban proportion will increase by another 10 percentage points to about 84% by 2050(http://esa.un.org/unup/).
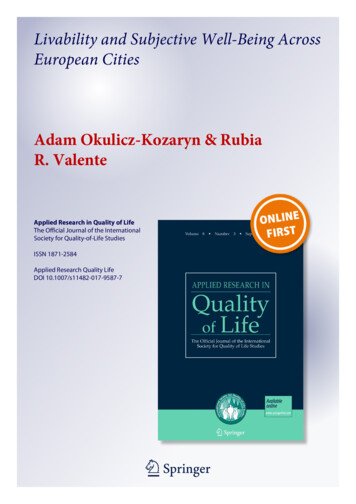
Author's personal copyLivability and Subjective Well-Being Across European Citiesdesigned, developed, and maintained” (Burton 2014, p. 5312). The Mercer Indexused in our analysis, mostly measures material standards or levels. Thus, livabilityis tangible and objective. Perhaps the term ‘standard of living,’ or ‘level of living,’are actually the best terms to describe how livability is measured. A shortcoming ofthe current measurement of livability is that it fails to account for intangible qualities of place such as vibrancy, authenticity, and distinctiveness. Nevertheless, it ismuch more comprehensive than traditional economic approaches that tend to equatedevelopment, or progress, with income or consumption.Subjective well-being (SWB) is one of the most comprehensive measurementsavailable. Diener and Lucas (quoted in Steel et al. 2008, p.142) define it as people’s evaluations of their lives, which include “both cognitive judgments of one’s lifesatisfaction in addition to affective evaluations of mood and emotions,” which is virtually the same as Veenhoven’s (2008, p. 2) definition: “overall judgment of life thatdraws on two sources of information: cognitive comparison with standards of thegood life (contentment) and affective information from how one feels most of thetime (hedonic level of affect).” In this paper, we use these overall SWB definitionswhen referring to subjective well-being, and we use the terms “happiness” and “lifesatisfaction” interchangeably.3The relationship between livability and subjective well-being should be positive: iflivability is high, human needs are satisfied and as a result happiness follows (Dieneret al. 1993; Veenhoven 1991; Veenhoven and Ehrhardt 1995). Figure 1 visualizes thisrelationship: Livability is illustrated as Florida’s (2008) pyramid of place in Panel a)(also see Burton 2014) and the pyramid’s bottom is similar to Maslow’s pyramid of aperson’s needs (Maslow [1954] 1987) in Panel b). The foundation of both pyramidsare basic needs. The top of Maslow’s pyramid is made of psychological and selffulfillment needs, whereas Florida places higher dimensions of livability at the top.The Mercer Index is relatively similar to Florida (2008)’s pyramid of place shown inpanel a) in Fig. 1, especially its bottom.As shown in Panel c), subjective well-being is a function of basic needs first(the foundation of the pyramids), but once they are satisfied, SWB depends on thehigher dimensions prescribed in both pyramids. Panel c) is also a reformulation ofthe well-being and income graph from Inglehart (1997), (also see discussion in Inglehart 1997, p. 1849), and it illustrates the “affluence paradox” (Pacione 2003)—themore income, economic development or affluence, the less these matter for SWB. Athigher level of economic development, what matters for SWB are the characteristicsdescribed at the higher dimensions of both pyramids. This phenomenon is similarto the diminishing marginal returns from income on subjective well-being observedat country, region, and person levels (Okulicz-Kozaryn 2012). Note that the definitions used in Fig. 1 are not definitive, and were used for the purpose of illustration3 Some scholars make a distinction between happiness and life satisfaction—life satisfaction refers tocognition and happiness refers to affect. Life satisfaction is a cognitive aspect of happiness (Dorahy et al.1998) We cannot differentiate between the two as we have only one measurement, hence, we mostlymeasure ‘life satisfaction, not ‘happiness.’ But as described above, there is an overlap between the two. Inaddition, we will use a place satisfaction measure.
Author's personal copyA. Okulicz-Kozaryn, R. R. Valenteperson pyramidselfactualizationvaluesesteem needsleadershipbelongingnessand love needsbasic servicesopportunity}basic needs:safety needseconomics,physiological needssurvival}}cSWB as a function of place and needs eds,ilityl nelivab ologica needshtcnpsylmefulfiselfSWBbasicneedecons:osurv mics,ivallivability}baestheticspsychological needs,self-fulfilment needsa place pyramidincome level or level of economicdevelopment, e.g., GDP/capitaFig. 1 a Livability as place pyramid; b Maslow’s hierarchy of needs; c SWB as a function of (a) and (b)only. Livability can be defined in a much broader way than what is illustrated inFlorida (2008)’s pyramid—for instance, it can include welfare provision or broadlyunderstood income redistribution (Okulicz-Kozaryn et al. 2014). The Mercer Index,used in this study, captures most of the characteristics in the bottom of the pyramids(basic needs: economics and survival) and to a lesser degree some of the aspects inthe higher dimensions. There has been debate about whether SWB would increaselinearly with income in Panel c), and some scholars even transform the x axis intoa log scale and use cross-section as opposed to time series when illustrating thisrelationship (e.g., Stevenson and Wolfers 2013), however, the literature has shownthat usually in the long term SWB has nil relationship with income (Easterlin et al.2010). There are cases, however, when income and SWB go hand in hand over time(Veenhoven and Vergunst 2013).There is an extensive literature on the livability-SWB nexus (Veenhoven 2000;Cummins 2000; Diener and Suh 1997; Schneider 2005; Pacione 2003). From these,we’ve learned that objective and subjective indicators provide different perspectives,each has strengths and weaknesses and both should be used as complements, andmost importantly, it is critical to use subjective indicators as they add greatly toeconomic measures such as income.There are several major happiness theories that can explain the relationshipbetween livability and SWB. One of the main theories is Veenhoven’s Livability Theory (Veenhoven and Ehrhardt 1995; Veenhoven 2000, 2014a). Livability depends onecology, but also on some fundamental human and social needs such as those at thebottom of Maslow’s pyramid of needs (Maslow [1954] 1987). In other words, thereare some universal human needs that need to be satisfied (Veenhoven and Ehrhardt1995).Another theory proposed by Michalos links livability and SWB (Michalos 2014),refer to Table 1. Michalos’ classification is somewhat similar to Veenhoven’s fourqualities of life (Veenhoven 2000) discussed later in Table 2. Concurrently, there isalso the overall Quality Of Life (QOL) theory subsuming objective with subjectiveindicators (Veenhoven 2000; Michalos 2014; Giannias and Sfakianaki 2014; Burckhardt et al. 2003). Quality of life can be defined as “a global measure based onan aggregation of well-being across several life domains (e.g., recreational, socialactivities, finances), usually assessed using a combination of objective and subjectiveindicators” (Steel et al. 2008). This is very similar to the QOLS scale (Burckhardt
Author's personal copyLivability and Subjective Well-Being Across European CitiesTable 1 Michalos’ two variable theory: a fool’s paradise and a fool’s hell (Michalos 2014)lo livabilityhi livabilitylo SWBReal hell [deprivation, unhappy poor]Fool’s hell [dissonance, unhappy rich]hi SWBFool’s paradise [adaptation, happy poor]Real paradise [well-being, happy rich]Cummins’ classification is shown in the square brackets (Sirgy 2002, p. 61)et al. 2003). However, such aggregation may not be the best idea—there is a conceptual and empirical difference between the two—it is better to explore the relationshipbetween objective and subjective indices instead.There is a handful of empirical studies linking objective with subjective indicators. Senlier et al. (2009) and Wkeziak-Bialowolska (2016) find a significant linkbetween most domain perceptions, or satisfactions, and overall place satisfaction.Balducci and Checchi (2009) on the other hand, find a significant link only betweensome domain perceptions and overall happiness for specific cities separately and aftercontrolling for person level characteristics. Liao (2009) uses both objective and subjective measures and finds that in most domains the correlation between objectiveand subjective is insignificant. In general, livability and SWB have been found to bepoorly or moderately correlated (Schneider 2005; von Wirth et al. 2015; Cummins2000; Okulicz-Kozaryn 2013).Oswald and Wu (2009) mostly contradicts the literature by finding moderatelyhigh correlation (.6) between subjective and objective indicators. Several explanations for this incongruity are possible: a large representative sample of state leveldata and adjustment of life satisfaction measure with person level predictors. Perhapsthe key is their usage of a comprehensive SWB measure, life satisfaction, and comprehensive index of QOL containing multiple domains. Our study will also use thelife satisfaction measure of SWB and the comprehensive QOL Mercer Index findingconcurrent results.We know how livability relates to place satisfaction (Okulicz-Kozaryn 2013). But,what is the relationship of livability with overall life satisfaction? This is the firststudy linking overall livability, defined as objective quality of life or standard of living, with subjective well-being (SWB) measured as life satisfaction across Europeancities. Before turning to data analysis, we add one more angle to our study—that ofurbanicity or size of place.Table 2 Veenhoven’s four qualities of life (Veenhoven 2000)Life chancesOuter qualitiesInner qualitiesLivability of environmentPerson’s life-ability [N/A][Mercer rank, pop size]Life resultsUtility of life [NA]Appreciation of life [place, life satisfaction]The measures used in this study are in brackets. Note that place also affects life-ability to some degree,for instance, urban living is unhealthy to the human brain (Lederbogen et al. 2011)
Author's personal copyA. Okulicz-Kozaryn, R. R. ValenteUrban Economic v Sociological Literatures: Size of a Place as LivabilityWith respect to cities, economists and sociologists are less focused on the differencesand relationships between objective and subjective measures. One of their interestshowever, is urbanicity4 —the degree to which a place is urban, often measured aspopulation size. These urban economic and sociological literatures are largely separate from the social indicators literature, and both mainstream economists5 andsociologists (Veenhoven 2014b) still tend to dismiss SWB. It is important to connect the literatures, because economic theory argues in favor of large cities, whilesociological theory is more ambivalent, but tends to argue in favor of smallerplaces.Classic sociologists point to the problems of city life: over stimulation, withdrawal, vice, impersonality, and shallowness (Park et al. [1925] 1984; Simmel1903; Tönnies [1887] 2002; Wirth 1938). Popular urbanists such as Florida, Jacobs,and Zukin are more ambivalent (Zukin 2009; Florida 2014, 2016a, b, c; Jacobs[1961] 1993)—surely they appreciate cities—yet, they are also critical, and valuethe small-town feel (e.g., see famous appreciation of small-town feel of Greenwich Village by Jacobs ([1961] 1993)). Economists invariably point to the economicbenefits that emerge in cities such as labor specialization, productivity, agglomeration economies, economies of scale, invention and creativity (Florida 2008; Glaeser2011b; O’Sullivan 2009). According to the Central Place Theory (e.g., O’Sullivan2009) consumption in large scale can only take place in the largest cities: largemuseums, opera houses, symphonies, etc.Thus, we propose to explicitly test the size of a place as a measure of livability.We are not aware of any other research where livability is explicitly defined as thesize of a place, although some studies have implicitly suggested it, particularly thoseusing economic theory (e.g. Glaeser 2011a, b).6 In general, economists main goal isto maximize utility or welfare,7 measured as income or consumption (Autor 2010).Geographically, the greatest income or consumption per capita is always found in the4 There has been many studies linking urbanity to SWB, for instance, see the World Database of Happiness(http://worlddatabaseofhappiness.eur.nl), subject section Eb02 ‘Urbanity’.5 There are many “maverick economists” studying the so called, “economics of happiness.” Some suchas Richard Easterlin and Andrew Oswald have significantly contributed to the social indicators literature.Notwithstanding, there are a few skeptics who do SWB research, but sneer it at the same time (e.g.,Angus Deaton (e.g., Deaton 2013) and Ed Glaeser (Glaeser et al. (2014, 2016)). Many, if not the vastmajority of economists do not consider SWB, social indicators or any social science outside of economicsas worthwhile (Economist 2014, 2016; Naim 2016; Fourcade et al. 2015).6 There are also studies by economists using “hedonic pricing” and “compensating differentials,” see forinstance Oswald and Wu (2009), Giannias and Sfakianaki (2014), Glaeser et al. (2016), and Albouy(2008). We do not dwell into this economic literature as it is based on revealed preferences and rationality assumption—and we know that humans are not rational (Shiller 2015; Zafirovski 2014; Akerlof andShiller 2010; Ariely 2009; Kahneman 1994; Sen 1977). There are also economists using broader measuressuch as crime and pollution—for review see Lambiri et al. (2007).7 Veenhoven (2000, p. 6) also confirms that “economists sometimes use the term ‘welfare’ for livability ofenvironment.
Author's personal copyLivability and Subjective Well-Being Across European Citieslargest cities, hence, the bigger the city, the more utility or welfare. Thus indirectly,size of place refers to economist’s notion of livability:livability size of a place(1)If defining livability as size of place seems far-fetched, see the conceptualization by sociologist Veenhoven (2000) in Table 2, where livability of environment isdefined as the intersection of outer qualities (place, environment) and life chances.Clearly, the city epitomizes the apex of life chances. Nowhere else there is so muchvariety and opportunity (Tönnies [1887] 2002; Milgram 1970; Fischer 1995; Glaeser2011b; O’Sullivan 2009; Campbell 1981).Although non-intuitive, there is support in the economic literature for thelivability size of a place equation. As one economist explains, “more populous cities offer a higher QOL that is implied by wages and costs alone: if two citiesoffer the same wages and costs, the more populated city is deemed the one moreamenable to the average individual” (Albouy 2008, p. 20). Of course, this is not theonly measurement economists use, as shown in (Albouy 2008; Lambiri et al. 2007;Myers 1988), nor would they use it explicitly. However, a careful review of the mostrecent economic literature on the topic (Glaeser et al. 2014, 2016; Glaeser 2011a, b,2014; Albouy 2008) reveals that this definition is implicit. Albouy (2008) providesa specific treatment of QOL and size of a place, and concludes that the bigger theplace, the higher the quality of life (see Table 1 in Albouy 2008). In some ways, theeconomic approach to livability seems to be similar to how development and progressused to be measured solely as income (e.g., per capita gross domestic product). It wasnot until recently that some progressive economists acknowledge this shortcoming(e.g., Stiglitz et al. 2009), while non-economists knew it for decades (e.g., Campbellet al. 1976).of livingAnother popular measure of QOL among economists is cost wage(Albouy2008), which is a reasonably good proxy for size of a place—cost rises much fasterthan wage with population size (Okulicz-Kozaryn 2015b). Similarly, economists likeGlaeser et al. (2016) for example, tend to assume that city growth is a consequenceof people’s rational preference for the city, and hence, they must be happy there.Therefore, city growth is a result of utility or SWB maximization. Here, for simplicity, we just focus on city size, not city growth. There are also some dissentersamong economists arguing that there is higher utility in smaller places, as reviewed,for instance, in Albouy (2008) or Pines (1972).In general, economists would predict that more money means more SWB (Autor2010), and since wages and consumption are greatest in the largest cities, the argument follows that this will yield the highest happiness levels. Alternatively, an urbaneconomist would predict that SWB will be constant across space: the more money,the more utility, but “urban dis-utilities” like commute distance and time have to becompensated by higher wages, and net utility is constant. According to the axiomof spatial equilibrium—one of the most important founding principles of urbaneconomics—in equilibrium, individuals cannot improve their overall utility levelsvia migration (Glaeser et al. 2016), making SWB constant across cities. Our resultscontradict economic theory and indicate the opposite: larger cities do not have the
Author's personal copyA. Okulicz-Kozaryn, R. R. Valentehighest SWB levels, nor is SWB constant across cities. We find that the highest levelsof SWB are found in the smallest places.DataWe use the 2015 Mercer Index, and complement the analysis by using the 2012data as a robustness check in the Appendix. The SWB data come from the Eurostat database at ase (urb percepdatabase). The Eurostat data are city-level aggregates from the Flash EurobarometerSurvey 419 (Quality of Life in European Cities 2015) and the Flash EurobarometerSurvey 366 (Quality of Life in European Cities 2012).8 The Flash Eurobarometer Surveys interviewed European urbanites aged 15 via telephone in their mothertongue on behalf of the European Commission. The basic sample design applied inall countries is multi-stage random (probability). In each household, the respondentwas drawn at random following the “last birthday rule” (for more information seehttps://doi.org/10.4232/1.12516). SWB is measured using two variables:L IFE SATISFACTION measured with “Q3.3 On the whole, are you very satisfied,fairly satisfied, not very satisfied or not at all satisfied with .? - The life you lead.”P LACE SATISFACTION measured with “Q3.4 On the whole, are you very satisfied,fairly satisfied, not very satisfied or not at all satisfied with .? - The place where youlive.”Eurostat provides the percentage of respondents in each category as separatevariables. We created one variable by using the following transformation:variable used here ( strongly/very YES 1) ( somewhat/rather YES .5) ( somewhat/rather NO .5) ( strongly/very NO 1)The new variable ranges between a theoretical 100 where everybody“strongly/very” disagrees to 100 where everybody “strongly/very” agrees. Okulicz ES somewhat/ratherY ES )Kozaryn (2013) used a synthetic index, ((strongly/veryY strongly/veryNO somewhat/ratherNO )which is very similar to our variable—they both correlate at about .95, and the transformation we use is slightly better as it uses ordinal scale information as opposedto treating ‘strongly/very’ and ‘somewhat/rather’ as the same. Livability is alsomeasured with two variables: the Mercer Index Ranking and population size.The M ERCER is a city ranking survey based on the Mercer Index and canbe downloaded from l2015/index.html. The Mercer is probably the most popular survey used to rank citiesin terms of their livability or standard of living. Other “best places to live”rankings appear to follow the Mercer. For instance, the Economist and Forbesbase their rankings primarily on data from the Mercer ranking (e.g., nd-meaning-livability). Kotkin (2011) claims8 We were unable to find a direct statement per the source of the 2015 Data in the Eurostat Metadata. The2012 Data is directly referenced in Eurostat Metadata to “Quality of life in cities - Perception survey in 79European cities - European Commission, Flash Eurobarometer 366, October 2013”.
Author's personal copyLivability and Subjective Well-Being Across European Citiesthat the Economist ranking is ‘‘remarkably similar’’ to the Mercer Ranking. The rankingcalculates livability based on 39 factors, grouped in 10 different categories. The Mercersurvey questioned expatriates on the importance of each of the 39 issues. The weightsassigned to each category are as follows (most heavily weighted items are in bold):923 Political and social environment (political stability, crime, law enforcement,etc)4 Economic environment (currency exchange regulations, banking services, etc)6 Socio-cultural environment (censorship, limitations on personal freedom, etc)19 Health and sanitation (medical supplies and services, infectious diseases,sewage, waste disposal, air pollution, etc)3 Schools and education (standard and availability of international schools, etc)13 Public services and transportation (electricity, water, public transport,traffic congestion, etc)9 Recreation (restaurants, theaters, cinemas, sports and leisure, etc)11 Consumer goods (availability of food/daily consumption items, cars, etc)5 Housing (housing, household appliances, furniture, maintenance services, etc)6 Natural environment (climate, record of natural disasters)The POPULATION size of a city is the second measurement of livability. As arguedearlier, it is a problematic measure, but it is derived from economic theory, whichimplicitly argues that the “larger the place, the better.” Population size is a goodproxy for opportunity, and livability can be defined as an intersection of life chancesand outer qualities (Veenhoven 2000). In general, urbanicity can be measured aspopulation size, density, and heterogeneity (Wirth 1938). For simplicity, we just usepopulation size as a measure. Furthermore, there is a large variability in populationsize. In the sample used here, some places are small towns of less than 100k people,and some places are large cities with a million or more people. City populations werestill largely unavailable for 2015, hence, we extrapolate population from previousyears using linear interpolation with Stata command ipolate with the epolateoption.ResultsTable 3 shows the correlations. We begin by examining how each of the two variables measuring SWB and livability correlate with each other. As expected, the twomeasures of SWB, PLACE and LIFE SATISFACTIONS correlate strongly at .75.On the other hand, the M ERCER ranking actually correlates with POPULATION(.24) in the opposite direction to what economic theory would argue: the larger theplace, the lower the Mercer ranking.10 Second, we turn to the correlations of livability9 We obtained the weights by contacting Mercer in 2011. We have contacted them again to see if there wasany change and were told that it has not changed. Morais et al. (2013) reports the same weights. A full listcontaining the 39 factors can be found in Okulicz-Kozaryn (2013).10 Higher value in rankings denotes lower rank, of course.
Author's personal copyA. Okulicz-Kozaryn, R. R. ValenteTable 3 Pairwise correlationsVariablesMercerPopulation*p on1.000.241.00Place satisfaction 0.57* 0.38*1.00Life satisfaction 0.63* 0.150.75*1.00measures with SWB measures. As predicted by sociological theory, and opposite toeconomic theory predictions, POPULATION correlates negatively with PLACE SATISFACTION at .38 and with LIFE SATISFACTION at .15. The M ERCER , on theother hand, indicates that the higher the place in livability ranking, the h
place pyramid b person pyramid} c SWB as a function of place and needs Fig. 1 a Livability as place pyramid; b Maslow's hierarchy of needs; c SWB as a function of (a)and(b) only. Livability can be defined in a much broader way than what is illustrated in Florida (2008)'s pyramid—for instance, it can include welfare provision or broadly