Transcription
Laboratory ManualPhysics 1011/2111MechanicsVer. 15.0 SB/TAG/SM/NXR 8.21.15
Table of ContentsPhysics 1011/2111 Labs General Guidelines. 3Introduction to Statistics, Error and Measurement . 51.The Determination of Gravitational Acceleration . 112. Projectile Motion . 163. Newton’s Second Law: The Atwood Machine . 204. Friction . 275. The Work-Energy Theorem . 326. Conservation of Linear Momentum . 367. Rotational and Translational Energies . 438. Periodic Motion and Resonance . 51Appendix A: Excel, the Basics! . 57Appendix B: DataStudio Instructions . 63
Physics 1011/2111 Labs General GuidelinesThe Physics 1011 and 2111 labs will be divided into small groups (so you will either be workingwith one lab partner, or, for the larger classes, in a small group). You and your lab partner(s) willwork together, but you each must submit an individual lab report, with a discussion of the laband interpretation of results in your own words.The laboratory classroom is located in the west wing of Benton Hall, Room 331.Laboratory attendance is mandatory and roll will be taken. At the beginning of each lab, you willsign out a lab kit and your lab instructor will check it in when you finish the lab. If you miss alab session, it is your responsibility to contact the lab instructor to pick up any missed handoutsor information for the following week's session. The lab instructor may allow you to make up amissed experiment, if you miss the lab for a valid medical reason. If makeup labs arepermitted, labs must be made up within a week of the original lab date. See your individualprofessor's syllabus for details about their rules for makeup labs.Always read the experiment before coming to the lab! This is really important, and willhelp you get the most out of the lab. Bring your calculator to lab, and take good noteswhen the lab instructor gives detailed information about the experiment and about whats/he expects in the lab report.Lab reports MUST be typed. If you have trouble finding computer facilities, and don’thave a computer at home, see the lab instructors or the course instructor, and we will helpyou find a computer to work on.Lab reports should include your name, the name of your lab partner, the lab section (e.g.,"Tuesday 12:30"), the date the experiment was performed, and the title of the experiment.This is a recommended guideline. The lab instructor has the final say in which details toinclude and how to format your lab report.You may find it useful to visit the “Lab Connection” website, which you can access via thePhysics Department website: http://www.umsl.edu/ physics/.The lab report itself should contain the following sections:Purpose: State, in your own words, the purpose of the experiment.Procedure: Describe the procedure in your own words. Describe also any novel approaches youtook, difficulties you had, or interesting observations. These descriptions need to be in“scientific” style, as professionally written as if you were going to submit the lab report to ascientific journal. Writing things like “This experiment was fun” is NOT what we are lookingfor!
Analysis:Data/graphs: List all data taken in the experiment, in tabular form whenever possible.Make sure that you give the units for all physical quantities. All graphs and tables should beneatly arranged and clearly labeled with titles.Calculations: Show clearly all the calculations you performed on the data. Show allequations you used.If calculations are used to obtain data that is plotted in the graphs, you may want to show thecalculations before the graphs. For example, you might make some measurements, and plot theraw data. Then you might do some calculations on the raw data, and plot the results. In that case,your results section should show (1) table of original data, (2) graph of original data, (3)calculations (equations and table of calculated results), and (4) graphs of calculated results.Alternately, you might show calculated quantities in columns next to the original measurements.For each experiment, we will give a sample data table that you can copy and paste into your labreport as a guide to how to present the data. The main point is to have the data andcalculations presented clearly. You want the lab instructor to be able to clearly follow yourthought process, to be able to see exactly what you measured and what you calculated.Questions:Answer all the questions posed in the lab manual.Conclusions:What did you conclude from the experiment? What quantities were measured? Were the resultsof the measurements what you expected? Describe possible sources and types of error in yourmeasurements. Tie your results back to the original purpose of the experiment.The lab reports are due at the beginning of the following session unless stated otherwise by yourlab instructor.Graded reports will typically be handed back a week after they are turned in. End-of-semestergraded lab reports will be handed back at your lecture, or can be picked up from your professorafter the end of the semester.All measurements taken in the lab should be in SI (Système Internationale) units (formerlyknown as MKS) units (meters, kilograms, and seconds) unless explicitly stated otherwise byyour lab instructor.Happy experimenting .And, when you get frustrated, remember that Galileo did all this underhouse arrest!
Introduction to Statistics, Error andMeasurementThroughout the semester we will be making measurements. When you do an experiment, it isimportant to be able to evaluate how well you can trust your measurements. For example, theknown value of g, the acceleration due to gravity, is 9.81 m/s2, (" " means approximatelyequal to). If you make a measurement that says g 10.1 m/s2, is that measurement “wrong”?How do you compare that measurement to the known value of g? Suppose you measure somequantity that is not known? You may make a number of measurements, and get several differentresults. For example, suppose you measure the mass of an object three times, and get threedifferent values, 5 kg, 4.8 kg, and 5.4 kg. Can you evaluate what the real mass of the object isfrom those measurements?The mathematical tools we will learn in this lab will answer some of these questions. They aresome of the most basic methods of statistical analysis; they will allow us to give informationabout our measurements in a standard, concise way, and to evaluate how “correct” ourmeasurements are. The methods we will cover are used in all areas of science which involvetaking any measurements, from popularity polls of politicians, to evaluating the results of aclinical trial, to making precise measurements of basic physical quantities.Let’s start with the basics of the different kinds of errors, and how to measure them.Types of ErrorsThere are two types of errors encountered in experimental physics: systematic errors andrandom errors.Systematic errors can be introduced by the design of the experiment by problems with the instruments you are using to take your data by your own biasesConsider a very simple experiment designed to measure the dimensions of a particular piece ofmaterial precisely. A systematic error of could be introduced if the measuring instrument iscalibrated improperly. For example, a scale might be set a little too low, so that what reads as“zero” is really “-1 kg”. Everything you measure on the scale will come out one kilogram lighterthan it really is. If a particular observer always tends to overestimate the size of a measurement,that would also be a systematic error, but one related to the personal characteristics of theexperimenter.Random errors are produced by unpredictable and uncontrollable variations in the experiment.These can be due to the limits of the precision of the measuring device, or due to theexperimenter’s inability to make the same measurement in precisely the same way each time.Even if systematic errors can be eliminated by good experimental design, there will always besome uncertainty due to random errors. Numerical values measured in experiments are thereforenever absolutely precise; there is always some uncertainty.
Accuracy and PrecisionThe accuracy of a measurement describes how close the experimental result comes to the actualvalue. That is, it is a measure of the “correctness” of the result. For example, if two independentexperiments give the values 2.717 and 2.659 for e (the base of the natural log), the first value issaid to be more accurate because the actual value of e is 2.718 .The precision of an experiment is a measure of the reproducibility of the result. Suppose youmeasure the same thing three times. The precision would be a measure of how similar all themeasurements are to each other. It is a measure of the magnitude of uncertainty in the result.Suppose one person weighs a cat, and comes up with three different masses each time: 10 kg, 12kg, and 11 kg. Suppose another person weighs the same cat, and comes up with these threemasses: 11.1 kg, 11.5 kg, and 11.3 kg. The second person’s measurement would be said to bemore precise. (Both people are likely to be scratched, though.)Significant FiguresWhen reading the value of an experimental measurement from a calibrated scale, only a certainnumber of figures or digits can be obtained or read. That is, only a certain number of figures aresignificant. The significant figures (sometimes called “significant digits”) of an experimentallymeasured value include all the numbers that can be read directly from the instrument scale plusone doubtful or estimated number. For example, if a ruler is graduated in millimeters (mm), youcan use that ruler to estimate a length up to one tenth of a millimeter. For example, suppose youmake a sequence of measurements of the length of some object using this ruler, and get anaverage value of 318.9811123 mm. The measurement is only accurate to one decimal place, soyou would report the number as 319.0 0.1 mm. The “zero” is shown after the decimal pointbecause that digit is the last significant one. All the other digits are meaningless and do notconvey any real information about your measurements. Also, when you are combiningmeasurements, the most imprecise measurement is your limiting factor. You can never havemore significant digits than your least accurate measurement.Data AnalysisPercent Error and Percent DifferenceHow do you measure the size of an error? The object of some experiments is tomeasure the value of a well-known quantity, such as g. (You’ll be making this measurementyourselves in next week’s experiment!) The most accurate value of these quantities (measured byteams of dedicated professional scientists!!) is the value given in your textbooks and tables. Inmaking a comparison between the results of your experiment and the accepted value measuredwith much more precision in specialized laboratories, you want to cite the percent error, ameasurement of how much your measurement differs from the “official” value. The absolutedifference between the experimental value E and the accepted value A is written E-A , where the“ ” signs mean absolute value. The fractional error is the ratio of this absolute difference overthe accepted value:E AFractional error AUsually, people convert this fractional error into a percent, and give the percent error:
Percent error E Ax 100%.ASometimes, you need to compare two equally reliable results when an accepted value isunknown. This comparison is the percent difference, which is the ratio of the absolutedifference between experimental results E1 and E2 to the average of the two values, expressedas a percent:Percent difference E1 E 2 E1 E 2 2 x 100%.Mean ValueEven if systematic errors can be eliminated from an experiment, the mean value of a setof measurements of a quantity, x, is a better estimate of the true value of x than is anysingle measurement. For this reason, experiments are often repeated a number of times. If wedenote x as the mean value, and there are N measurements x i (where i varies from 1 to N),then x is defined by the following equation:1x NN xii 1In fact, random errors are distributed according to a Gaussian distribution, which looks like thefamiliar bell curve. In case you aren’t familiar with it, the “ ” symbol we just used is a capitalGreek letter “sigma “. In math, it is called a summation sign. It means “add up everything to theright”. So in the equation above, the sigma is a shorthand way of writingx 1 x1 x2 x3 . xN .NMean DeviationTo obtain the mean deviation of a set of N measurements, the absolute deviations of xi aredetermined; that is xi xi - x The mean deviation x is then1 x NN xi 1i
Example 1.1 What are the mean value and mean deviation of the set of numbers 5.42, 6.18, 5.70,6.01, and 6.32?Solution:The mean is1x NN x 5. 4 2 6.1 8 5.57 0 6. 0 1 6.3 2 5.9 2 6 5.9 3ii 1Note that since the original measurements were only valid to two decimal places, the averagecan only be valid to two decimal places as well, so we round from 5.926 to 5.93.The absolute deviations for each measurement are: x1 5.42 - 5.93 0.51 x2 6.18 - 5.93 0.25 x3 5.70 - 5.93 0.23 x4 6.01 - 5.93 0.08 x5 6.32 - 5.93 0.39Then the mean deviation is:1 x NN x 0.51 0.25 0.523 0.08 0.39 0.292 0.29ii 1--------------Usually, people report an experimental measurement as the mean “plus or minus” the meandeviation:E x x In our example, the value would be reported like this: 5.93 0.29.Standard DeviationStatistical theory states that the precision of a measurement can be determined using aquantity called the standard deviation, (called “sigma”, this is the Greek lower-case “s”). Thestandard deviation of a distribution of measurements is defined as follows:
1 N xi x i 1 2The standard deviation is a measure of spread. If the standard deviation is small, then thespread in the measured values about the mean is small, and so the precision in themeasurements is high. The standard deviation is always positive and has the same units as themeasured values.It can be shown, for a Gaussian distribution , that 69% of the data points will fall withinone standard deviation of x , i.e., ( x - ) xi ( x ); 95% are within two standarddeviations, and only 0.3% are farther than 3 from x . So, for example, if an experimental datapoint lies 3 from a theoretical prediction, there is a strong chance that either the prediction isnot correct or there are systematic errors which affect the experiment.--------------Example 1.2 What is the standard deviation of the set of numbers given in Example 1.1?Solution:First, find the square of the deviation of each of the numbers x12 (5.42-5.93)2 0.26 x22 (6.18-5.93)2 0.06 x32 (5.70-5.93)2 0.05 x42 (6.01-5.93)2 0.01 x52 (6.32-5.93)2 0.15then 1 N xi x i 1 2 0.26 0.06 0.05 0.01 0.15 0.335--------------The result of our measurement of E can also be reported as:E x Note that all these statements are valid if only random errors are present.Presenting DataData TablesYou should always organize the experimental data which you take into data tables, inorder to make the data very clear and easy to understand. The data table will generally have twoor more columns which present the values of the controlled (independent) and measured(dependent) variables. The table should contain labels for the various columns, including unitsand errors. If some variables are fixed during a particular experiment, the values can be givenin the title for the table or in the text; similarly, if the errors are the same for all measurements
they can be included in the text or caption. Data tables are usually organized by ascendingvalues of the independent variable.--------------Example 1.3 For a fixed volume, pressure is proportional to temperature for an ideal gas. Afixed amount (10 moles) of gas is placed in a container having a fixed volume of 1m 3 and thetemperature is increased from 0 C to 60 C in increments of 10 . The pressure in Newton/m2(Pascal) is measured by an apparatus for which the pressure can be read accurately in 100 pascalunits with the 10 Pascal digit estimated. The pressure was measured several times and astatistical error determined for each measurement. The independent variable (temperature) isgiven in the left column of the table on the next page. The measured quantity (a.k.a., thedependent variable) is given, along with the error, in the right column.GAS PRESSURE AS A FUNCTION OF TEMPERATUREV 1m3; n 10 molesTemperature ( C)Pressure P P (Pascals)022700 201023540 202024330 403025210 304026010 305026820 306027730 50GraphsWhen you are plotting data in a graph, always make it really clear what you are plotting on eachaxis! Label the axes and show units. (See the Excel tutorial in the Appendix.)Projectile Motiony -0.1x2 4x 3E-14604020y -1E-17x - 0.20010-202030y -0.2x 44050-40-60Time (s)PositionVelocityAccelerationPoly. (Position)Linear (Velocity)Linear (Acceleration)60
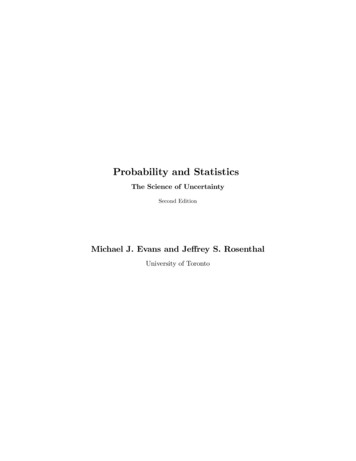
Experiment 1 The Determination ofGravitational AccelerationThe first lab of the semester has three parts: Introduction to Statistics, Error and Measurement, which can be found on page 5.The actual experiment: “The Determination of Gravitational Acceleration” whereyou will learn how to evaluate measured data by averages and standard deviationsA tutorial in how to plot data using Excel, which can be found in the Appendix.There are questions on the last page of the Experiment that you will need to answer in yourlab report.You will probably want to refer back to the Introduction to Statistics, Error andMeasurement, and the Excel Tutorial, later in the semester, as you work on analyzing andgraphing data from more complicated experiments.Purpose:The purpose of this experiment is to measure the earth's gravitational acceleration from anobject in free fall. You will use the equation of motion of an object in free fall, starting from rest(v0 0):y(t) yo vot ½ a t2Equipment:Ball bearing, timer, clamping post, meter stick.
Experiment Part A:Using the apparatus shown above, drop a ball 10 times, from 4 different heights (you pick the heights)To clamp the ball, push in the dowel pin until the ball is tightly clamped, and then tighten thethumbscrew. To release the ball, open the thumbscrew. Be sure to reset the timer to zero beforedropping the ball! The lab instructor will show you how to do all this in detail. Be careful whenyou measure the height: measure from the bottom of the ball to the pressure pad.Collect your data at four different heights and enter the data in the tables below.For each measured y and t, you can calculate g. Since the initial velocity v0 is zero, the initialposition is h (y0 h), and the acceleration is –g (a -g), you can rearrange the equation:to solve for g:y(t) yo vot ½ a t2(1)g 2h/t2(2)You can do this with your calculator, or put the time values into Excel, and make an equation tosolve for g at each value of t and y. For each height, calculate the mean value of gravity and time( g , t ), and the standard deviation ( g t). Again, you can use Excel to do this.Height 1: h1 tg t1 t g1 g Table 1: Time and Gravity DataHeight 2: h2 Height 3: h3 tgtg t2 t g2 g t3 t g3 g Height 4: h4 tg t4 t g4 g
Galileo did this experiment too.but his experimental setup was the leaning Tower of Pisa.Analysis Part A:You now have four mean values of g, each calculated at different height. What is the percenterror of each of the values, with respect to the accepted value of g, 9.81 m/s2 ?What is the percent difference between ghighest and glowest Experiment Part B:Repeat the experiment above once using the maximum height you can achieve. The heightshould be over 1.5 meters.Height 5: h5 tg t5 t g1 g
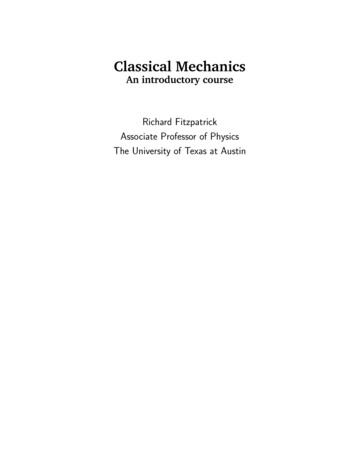
Analysis Part B:You now have five different heights with five different average times. The plot below shows anexample of a chart with height on the y axis and time on the x axis (h vs. t). Using Excel, try torecreate this plot using your own data. Use the average time you obtained for each height.Include a trend line and the polynomial equation (of order 2) for the trend line. In Appendix Ayou will find some helpful tutorials, if you are not familiar with Excel.Look carefully at the trend line equation. Excel usually shows 0 as a number near 10 -14;so that the equation can be reduced to y 1/2ax2. What does this value of a represent? (Hint:Compare this equation to equation 1).Freefall Results: Height vs. Time1.81.6y 1/2ax2 bx c1.4Height (meters)1.210.80.60.40.200.000.100.200.300.40Time (seconds)0.500.600.70
Questions:1. Discuss the sources of error in the experiment. Were there sources of random error? Whatwere they? What about systematic error?2. Would you expect the values of g measured at the two different heights to be the same?Why or why not?3. Suppose you had used a metal ball of a different mass (say, ten times heavier). Wouldyou expect the value of g to be the same, or different? Why?4. For measuring the distance that the ball drops, we suggested that you measure from thebottom of the ball to the pressure pad, in order to get the most accurate distance. Whyshouldn’t you measure from the middle of the ball to the pressure pad? Explain.5. Which of your values for g was more precise? Which was more accurate? Explain.
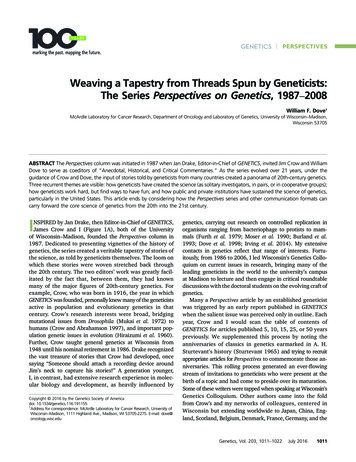
Experiment 2 Projectile MotionPurpose:In this experiment, you will study projectile motion, and see how to separate the motion of aprojectile into its x and y components.Two photographs (a double exposure) using a digital camera and strobe light illumination willenable you to get a picture of the trajectory of a ball as it is tossed between you and your labpartner. One of the exposures will show you a grid from which you can calculate the ball’sposition; the other exposure will show you the ball’s trajectory. The combined exposures willshow you the ball at various instants during its trajectory superimposed on the grid. You can thencompare the measured trajectory with what you would expect based on the equations discussedin class.Equipment:Strobe light, digital camera and printer, 100cm X 100cm grid, black felt cover, golf ball, andflash drive (optional)Procedure:You and your lab partner should practice tossing the ball back and forth before you have the labinstructor take the photograph. Make sure that the ball’s trajectory arches completely within thegrid – not going above the top of the grid, and not traveling in a straight line horizontally acrossthe grid.Two pictures will be taken by the lab instructor. The first will be of just the grid, with theroom lights on. The second photograph will be superimposed over the first, and taken with theoverhead lights out and strobe light on. (If you are susceptible to light-induced seizures, pleasecontact your TA about alternatives to this part of the experiment.) The shutter on the camera willbe held open while you toss the ball in front of the grid. The photo will then show the ball’strajectory, i.e., its position at equal time intervals, (1/flash rate), superposed on the grid. Themore data points you have, the better your measurement will be. The data table has spaces for 10data points, but this is just a guideline. If you have less than this, it is OK! If you have more thanthis, yay you!Be sure to record the flash rate from the strobe light! (It should be 14 -17 flashes/second).The photo will be sent to the printer and a digital copy can be stored on your thumb drive to beprinted in your lab report.
The two illustrations below show what the results should look like in theory (left), and anexample of a real picture (right).Theory!Real life!(This photo is a bit overexposed.)Analysis:1. Use the photo to find the x and y coordinates of the center of each image of the ball. Put theorigin, (0, 0) in the lower left corner. The entire grid is 1m x 1m, with major divisions every10cm, and further divisions every cm. Enter your measurements in the X and Y columns below.Remember to convert from centimeters to meters!Data Table 1Flash Rate (s-1)Position #12345678910X (m)Y (m)VX (m/s)VY (m/s)AX (m/s2)AY (m/s2)2. Calculate average speed for each data point. Remember the definitions of average speed in thex and y directions: vx x/ t and vy y/ t. Calculate vx and vy from your recorded x and yposition values. Be sure to use consecutive positions. (Why?) Enter your calculated values in thetable. Remember that your t is 1/ (flash rate).
3. Using the definition of average acceleration and x and y components, a x vx/ t anday vy/ t, find ax and ay. Again, be sure to use consecutive speeds. Enter your calculated valuesin the table.Two sets of sample calculations are shown below, to help you along: one with actual numbers,and one with equations. In the second example below, the flash rate is taken to be 15 flashes persecond.You can find an Excel spreadsheet to help with calculations at the Lab Connection website.xyx1y1x2y2x3y3.VxVyx 2 x1 tx xVx (3, 2) 3 2 tVx ( 2,1) Vy ( 2,1) y 2 y1 tVy (3, 2) y3 y2 tAxAx (3, 2) AyVy VVx (3, 2) Vx ( 2,1)Ay ( 3, 2) (3,2 ) y ( 2,1) t t.Position #12345678X (m)0.330.400.470.550.630.700.780.86Y (m)0.250.330.470.570.610.600.560.45Vx (m/s)(0.4-0.33)*15 (0.47-0.4)*15 (0.55-0.47)*15 (0.63-0.55)*15 (0.7-0.63)*15 (0.78-0.70)*15 (0.86-0.78)*15 Vy (m/s)1.051.051.201.201.051.201.20(0.33-0.25)*15 (0.47-0.33)*15 (0.57-0.47)*15 (0.61-0.57)*15 (0.60-0.61)*15 (0.56-0.60)*15 (0.45-0.56)*15 Ax 15 (1.20-1.05)*15 (1.20-1.20)*15 (1.05-1.20)*15 (1.20-1.05)*15 (1.20-1.20)*15 Ay (m/s/s)0.002.250.00-2.252.250.00(2.10-1.20)*15 (2.10-1.50)*15 (0.60-1.50)*15 (-0.15-0.60)*15 (-0.60-(-0.15))*15 (-1.65-(-0.60))*15 13.509.00-13.50-11.25-6.75-15.75
Questions:1. Explain why the first row of calculated average speeds, and the first two rows ofcalculated average accelerations, are blank.2. What forces are acting on the ball while it is in flight?3. What value did you expect to get for ax? Why?4. Calculate the average value for ax, ax , and its standard deviation, for each case.Remember that the standard deviation has the same units as the number being measured(in this case, m/s2).5. What value did you expect to get for ay? Why?6. Calculate the average and standard deviation for your value of a y.7. Calculate the percent error between your value of a y (the average value you justcalculated) and your predicted value of a y (your answer to question 5).8. Describe possible sources of random error in the experiment.9. Describe possible sources of systematic error in the experiment.10. Suppose you had done the experiment with ping pong balls rather than golf balls. Mightyou have gotten different results? Why or why not?
Experiment 3 NewtoN’s secoNd Law:The Atwood MachinePurpose:To predict the acceleration of an Atwood Machine by applying Newton’s 2nd Law and use thepredicted acceleration to verify the equations of kinematics with constant acceleration.Theory Part 1:The Atwood Machine consists of a pulley of negligible mass and friction over which two massesare suspended. When the suspended masses are unequal, the system will accelerate in thedirection of the larger mass.In this experiment you will measure the acceleration and compare tothe acceleration predicted by Newton’s 2nd Law. For the purpose ofthis experiment, we will consider the acceleration to be constant. Thesystem will begin at rest, at position y above the table. For Part 1, youwill measure the distance y and the time t required for the system tofall to the table. The system’s acceleration can then be calculatedusing kinematics equations.Procedure Part 1:Use a length of string such that, when one mass holder is on the table,the other is between 50 cm and 60 cm above the table. Make sure thatone mass holder is directly in front of the meter stick.Measure the initial mass on each holder, including the holder.Record the initial values:m1 gm2 gThese numbers should initially be (approximately) equal.While gently holding the system (place your finger under themass holder), obtain a difference of 1 gram between the sides. Let goFigure 1of the mass holder to see if the system moves. If the system does notmove, see if it will move if you very gently tap the larger mass. If the system still does not move,continue adding masses and tapping the heavier mass until the system does move. Record theadditional mass required to start the system moving.1. With an equal total mass on each side, remove a 10 gram mass from the side farthest from themeter stick (m2) and add it to the side in front of the meter stick, m1, thus making the massdifference between the two 20g.
2. Pull m2 (the light side) down to the table and hold it in place. Read the distance of m1 (theheavy side) above the table by sighting across the bottom of the mass holder to the meter stick.3. Record this distance in the data table as y.4. Release the lighter mass; the heavier mass will then fall to the table.5. Use a stopwatch to determine the time required for the heavier mass to fall.6. Record the time in the data table as t. Perform a total of five trials.Return the 10g mass to m2, remove the 20g mass from m2, and add it to m1 so that m1 is 40 gheavier than m2. Repeat step
Physics 1011/2111 Labs General Guidelines The Physics 1011 and 2111 labs will be divided into small groups (so you will either be working with one lab partner, or, for the larger classes, in a small group).